行政院國家科學委員會專題研究計畫 成果報告
子計畫四:奈米生物性氣膠採樣與分析探討(III)(2/2)
計畫類別: 整合型計畫
計畫編號: NSC93-2621-Z-002-003-
執行期間: 93 年 08 月 01 日至 94 年 07 月 31 日
執行單位: 國立臺灣大學公共衛生學院環境衛生研究所
計畫主持人: 李芝珊
計畫參與人員: 曾俊傑
報告類型: 完整報告
處理方式: 本計畫可公開查詢
中 華 民 國 94 年 10 月 24 日
行 政 院 國 家 科 學 委 員 會 補 助 專 題 研 究 計 畫 期 末 報 告
奈 米 生 物 性 氣 膠 採 樣 與 分 析 探 討
(III)(2/2)
計 畫 類 別 : □ 個 別 型 計 畫
■
整 合 型 計 畫
計 畫 編 號 :
NSC
93-2621-Z-002-003-執 行 期 間 :
93 年 8 月 1 日 至 94 年 7 月 31 日
計 畫 主 持 人 :
李 芝 珊
執 行 單 位 : 台 灣 大 學 環 境 衛 生 研 究 所
成 果 報 告 類 型 (依 經 費 核 定 清 單 規 定 繳 交 ): □ 精 簡 報 告
■
完 整 報 告
本 成 果 報 告 包 括 以 下 應 繳 交 之 附 件 :
□ 赴 國 外 出 差 或 研 習 心 得 報 告 一 份
□ 赴 大 陸 地 區 出 差 或 研 習 心 得 報 告 一 份
□ 出 席 國 際 學 術 會 議 心 得 報 告 及 發 表 之 論 文 各 一 份
□ 國 際 合 作 研 究 計 畫 國 外 研 究 報 告 書 一 份
處 理 方 式 : 除 產 學 合 作 研 究 計 畫 、 提 升 產 業 技 術 及 人 才 培 育 研 究 計 畫 、
列 管 計 畫 及 下 列 情 形 者 外 , 得 立 即 公 開 查 詢
□ 涉 及 專 利 或 其 他 智 慧 財 產 權 , □ 一 年 □ 二 年 後 可 公 開 查 詢
執 行 單 位 :
中 華 民 國 94 年 10 月 23 日
目 錄
目 錄 ...II 一 、 中 文 摘 要 ...III Abstract ...III 二 、 前 言 ... 1 三 、 研 究 目 的 ... 1 四 、 文 獻 探 討 ... 1 五 、 研 究 方 法 ... 2 六 、 結 果 與 討 論 ... 5 七 、 計 畫 成 果 自 評 ... 7 八 、 參 考 文 獻 ... 7一 、 中 文 摘 要 為 達 到 對 感 染 性 病 毒 氣 膠 去 活 化 之 目 的 , 紫 外 線 之 應 用 也 就 非 常 普 遍 。 本 研 究 在 實 驗 室 測 試 腔 評 估 紫 外 線 對 空 氣 以 及 表 面 病 毒 的 去 活 化 效 率 , 評 估 不 同 紫 外 線 劑 量 、 不 同 的 病 毒 核 酸 形 式 以 及 不 同 的 相 對 濕 度 對 於 病 毒 去 活 化 效 率 之 影 響 。 對 空 氣 中 病 毒 來 說 , 紫 外 線 欲 去 除 百 分 之 九 十 之 單 股 RNA病 毒 以 及 雙 股 RNA病 毒 別 需 要 劑 量 339-423 μ W sec/cm2 和 662-863 μ W sec/cm2。 同 時 本 研 究 也 發 現 , 欲 對 空 氣 以 及 表 面 病 毒 達 到 百 分 之 九 十 九 之 去 除 效 率 所 需 之 紫 外 線 劑 量 為 百 分 之 九 十 去 除 效 率 之 兩 倍 。 另 外 , 在 相 同 病 毒 去 除 效 率 下 , 表 面 上 的 病 毒 所 需 之 紫 外 線 劑 量 為 空 氣 中 病 毒 的 3.9至 7.6倍 。 不 論 是 空 氣 中 或 表 面 上 的 病 毒 , 單 股 核 酸 病 毒 均 比 雙 股 核 酸 病 毒 對 紫 外 線 具 有 較 佳 之 感 受 性 。 在 相 對 濕 度 85 %時 , 紫 外 線 對 於 病 毒 去 活 化 效 果 較 相 對 濕 度 55 %差 , 可 能 的 原 因 是 水 氣 附 著 於 病 毒 表 面 遮 蔽 部 分 UVGI, 導 致 RNA病 毒 在 高 相 對 濕 度 下 , 對 紫 外 線 之 感 受 性 降 低 。 由 以 上 結 果 可 知 , 紫 外 線 對 於 病 毒 來 說 具 有 非 常 好 的 去 活 化 效 果 。 關 鍵 詞 : 生 物 氣 膠 、 病 毒 氣 膠 、 噬 菌 體 紫 外 線 Abstract
The increasing incidence of infectious
diseases has prompted the application of Ultraviolet Germicidal Irradiation (UVGI) for the inactivation of viruses. This study evaluates UVGI effectiveness for both airborne and surface viruses in a laboratory test chamber by determining the effect of UV dosage, different nucleic acid type of virus, and relative humidity on virus survival fraction after UVGI exposure. For airborne viruses, the UVGI dose for 90% inactivation was 339-423 μ W sec/cm2 for ssRNA, and 662-863 μ W sec/cm2 for dsRNA. For all tested, the UVGI dose for 99% inactivation was 2 times higher than that for 90% inactivation, and the ratio of surface to airborne UVGI dose ranged from 3.9 to 7.6.
Airborne and surface viruses with
single-stranded nucleic acid were more susceptible to UV inactivation than were those with double-stranded ones. For all tested viruses at the same inactivation, the UVGI dose at 85% RH was higher than that at 55% RH, possibly because water sorption onto a virus surface provides protection against UV-induced RNA damage at higher RH. In summary, UVGI was an effective method for virus inactivation.
Keywords: bioaerosols ; virus aerosol;
二 、 前 言
Viruses are obligate parasites that are biologically active only within their host. Viruses can be transmitted by various routes, including direct and indirect contact, vector transmission, and vehicle transmission. For deadly viruses such as Severe Acute
Respiratory Syndrome (SARS) virus,
influenza virus, and enterovirus, the vehicle transmission pathways include respiratory transmission by droplets and aerosols, as well as fecal-oral transmission via water, food, and environmental surfaces. To reduce infection risk from virus infection, control techniques for inactivating such viruses have been extensively researched (Jensen, 1964 ; Gerba et al., 2002 ; Shin et al., 2003; Thurston-Enriquez et al.,2003). Among
these control techniques, ultraviolet
germicidal irradiation (UVGI) was
demonstrated to be extremely efficient for virus inactivation (Jensen, 1964; Galasso et al.,1965; Gerba et al., 2002; Nuanualsuwan et al., 2003; Thurston-Enriquez et al., 2003).
三 、 研 究 目 的
This study evaluates UVGI effectiveness for both airborne and surface viruses in a laboratory test chamber by determining the effect of UV dosage, different nucleic acid type of virus (single-stranded RNA, ssRNA and double-stranded RNA, dsRNA), and relative humidity on virus survival fraction after UVGI exposure.
四 、 文 獻 探 討
The mechanisms of UVGI on microbes
are uniquely vulnerable to light at
wavelengths at or near 2537 Angstroms, because the maximum absorption wavelength of a DNA molecule is 253.7 nm. The pyrimidine of DNA base can strongly absorb UV light. After irradiation, the DNA sequence where pyrimidine and pyrimidine
link can form pyrimidine dimers. These dimers can change the DNA double helix structure and interfere with DNA duplication, as well as lead to the destruction of the replicate ability of cells and thus render the cells non-infectious (Brickner et al., 2003). Until now, the application of UVGI has mainly focused on control of tuberculosis transmission, although the susceptibility to UVGI for different microorganism species widely differs (Brickner et al., 2003). The UVGI effectiveness for microorganisms is known to be significantly affected by the irradiation level, duration of irradiation, room configuration, lamp placement, lamp age, air movement patterns, and relative humidity (RH) (Summer, 1962; NIOSH, 1972; CDC, 1994), as well as by the mixing degree of room air (Nicas 1996).
Early research on UVGI applications focused mainly on airborne bacteria, such as
Bacillus subtilis and Mycobacterium tuberculosis (Sharp et al., 1938; Rentschler
et al., 1941), as well as fugal spores, such as
Fusarium, Penicillium, and Aspergillus
species (Luckiesh et al., 1946). Recent studies report that the UV susceptibility of these microorganisms is significantly reduced when the RH is increased (Peccia et al., 2000;
Ko et al., 2000), that airborne
microorganisms are much more susceptible to UV damage than those suspended in a liquid broth (Brickner et al., 2003), and that the UVGI dose between fungal spores and bacterial cells is as high as 80 times (Lin and Li, 2002). These previous studies reveal that the susceptibility of microbes is highly related to the presence or absence of a cell wall, to the cell-wall thickness, and to RH.
Until now, only limited data has been available on the inactivation of airborne viruses by UVGI. In 1942, the use of UVGI in schools greatly reduced the spread of measles, chickenpox, and mumps (Wells et al., 1942). Recently, adenovirus was reported less susceptible to UVGI, possibly due to dsDNA as its genetic material (Thurston-Enriquez et al., 2003). Moreover, the required dose of UVGI for viruses that
lack a cell wall is lower than that for bacteria and fungi (Jensen, 1964; Brickner et al., 2003). Virus inactivation by UVGI also depends on the type of nucleic acid; viruses with double-stranded genomes are less
susceptible to UV inactivation
(Thurston-Enriquez et al., 2003) possibly because only one strand of the nucleic is damaged during inactivation, and thus the undamaged strand might then serve as a template for repair by host enzymes (Kallenbach et al., 1989). In virus inactivation, UVGI predominately damages DNA and inhibits replication. However, only limited information is available about the mechanism of UVGI on RNA viruses.
For assessment of UVGI inactivation on viruses, bacteriophages have been used as surrogates for mammalian viruses. Among these phages, MS2 has been suggested as an adequate indicator for enteric virus UV inactivation, because the size, shape, and nucleic acid type of MS2 are similar to those of enteric virus (Havelaar et al., 1991). Therefore, MS2 has been used as a surrogate for poliovirus and other enteric viruses (Jones et al., 1991; Maillard et al., 1994). The susceptibility of these different nucleic acid types to UVGI inactivation might not be the same.
Viruses from fecal-oral transmission via different environmental surfaces are also directly related to the potential risk for human exposure, such as SARS virus and enterovirus. SARS virus and enterovirus are apparently most commonly spread by
close person-to-person contact through
exposure to infectious droplets and possibly by direct or indirect contact with infected body fluids (Tsang, et al., 2003). Emerging evidence indicates that these infectious
viruses can also be acquired from
contaminated inanimate objects in the
environment (Poutanen et al., 2003).
Therefore, applications of UVGI on surface viruses are equally important as on airborne viruses. Until now, however, only limited data has been available about the virus inactivation by UVGI to virus-coated solid
surfaces. Most investigations of UVGI inactivation to surface viruses have involved virus stock solution in glass dishes for UVGI irradiation (Galasso et al., 1965; Ma et al.,
1994). Although UVGI effectively
inactivated a high titer (108 PFU/ml) of virus on the surface of water (> 99% of the virus
was inactivated by UV light), a
corresponding inactivation effect on viruses bound to a solid surface was not realized. Compared with airborne viruses, viruses bound to both water and solid surfaces were more difficult to inactivate (Galasso et al.,
1965). Therefore, to simultaneously
eliminate both airborne and surface viruses, understanding and quantifying the effective UVGI dose for surface virus inactivation is crucial.
In our current study, the effectiveness of UVGI was evaluated for both airborne and surface viruses in a laboratory test chamber by determining the effect of UV dosage, different nucleic acid type of virus (different bacteriophages with single-stranded RNA, and double-stranded RNA), and RH (55% and 85%) on virus survival fraction after UVGI exposure.
五 、 研 究 方 法 Test Viruses
In this study, the test viruses were two
different bacteriophages: single-stranded
RNA, or ssRNA (MS2, ATCC 15597-B1), and double-stranded RNA, or dsRNA (phi 6 with envelope lipid, ATCC 21781-B1). The host bacteria were Escherichia coli for
coliphages MS2 (ATCC 15597) and
Pseudomonas syringae (ATCC 21781) for
phi 6. A high titer stock of bacteriophages (109-1010 PFU/ml, where PFU is Plaque Forming Units) was prepared via plate lysis and elution. To allow the phage to attach to the host, the bacteriophages were mixed with their own respective host. First, 5 ml of top agar was added to a sterile tube of infected cells. Then, the contents of the tube were mixed by gentle tapping for 5 sec and poured
onto the center of a labeled agar plate. Finally, the plate was incubated for 24 h either at 37 °C for coliphages or at 26 °C for phi 6. After cultivation, 5 ml SM buffer (containing NaCl, MgSO4•7H2O, Tris, and
gelatin) was pipetted onto a plate that showed confluent lysis. Then, the plate was slowly rocked for 40 min and the buffer was transferred to a tube for centrifugation at 4,000 x g for 10 min. After the supernatant was removed, the resulting phage stock was stored at 4 °C.
Aerosol Test System
(I) Aerosol Generation Unit
A Collison three-jet nebulizer (BGI Inc., Waltham, MA) was used to nebulize the bacteriophage stock in deionized water at 3
L/min with dry, filtered, compressed
laboratory air, then passed though a Kr-85 particle-charge neutralizer (model 3077, TSI). The aerosolized suspension was then diluted with filtered, compressed air at 57 L/min. The stock solutions of bacteriophages MS2 was diluted in sterile, deionized water for nebulization, and that of phi 6 phage was diluted in sterile, deionized water containing 0.03 % Tween 80 to preserve infectivity.
(II) RH Regulation Unit
A humidified gas stream was generated by passing pure compressed air through a humidity saturator. The water vapor content (i.e., RH) in the gas stream was adjusted by changing the flow rate ratio of humidified gas stream to dry gas stream, and finally measured using a hygrometer (Testo, Sekunden-Hygrometer 601) placed in the sampling chamber. For evaluating the effect of RH, the humidified gas stream was heated by adding a dry gas stream to reach the medial (RH 55%) or humid condition (85%).
(III) UV Exposure Unit
As shown in Fig. 1, the eight Germicidal lamps (Philips Germicidal Lamp, TUV 8W/G8 T5, Holland) were low-pressure mercury-vapor discharge lamps consisting of
a tubular glass envelope that emitted short-wave UV radiation with a radiation peak at 253.7 nm (UV-C) for germicidal action. Each lamp was 28.8 cm long, and was two-ended with a two-pin base. The UV irradiance intensity was measured using a
radiometer (P-97503-00, Cole-Parmer,
France) with a 254nm sensor. Exposure of airborne virus to a given intensity of UV was carried out by passing the aerosolized suspension through a cylinder (5-cm diameter, 28-cm length, made of quartz) at a distance from 0 to 30 cm from the UV source (with a radiation peak at 254 nm). The UV irradiance intensity was measured using a radiometer (P-97503-00, Cole-Parmer) with a 254-nm sensor fixed inside the cylinder and oriented with its surface parallel to the germicidal lamps. Therefore, an average facial intensity (four faces) could be obtained. With an air flow rate of 60 L/min and UV exposure volume of 0.55 L, the exposure time was 0.55 sec. The evaluated parameter was UV dose, defined as the product of UV
intensity and UV exposure time.
Experiments were done at least in triplicate for each set of conditions with different UV intensity (60, 120, 180, or 240 μ W/cm2), RH (55% and 85%), and test virus. The test system was located in a chemical hood so that the exhausted gas was vented outside (Lin and Li, 2002).
(IV) Virus Aerosol Sampling
An Andersen one-stage viable impactor (Andersen Samplers, Inc., Atlanta, GA) was used to sample the virus aerosol. This stage has four hundred 0.25-mm holes and has a
sampling flow rate of 28.3 L/min
(corresponding to a velocity of 24 m/s) when 20 ml LB (Luria-Bertani) broth is used with 3% gelatin plates. The measured and theoretical cut-point diameters of this stage are 0.57 μ m and 0.65 μ m, respectively (Nevalainen et al. 1993). Because this impactor has only one sampling port, samples of each virus aerosol were taken in sequence first without and then with UVGI
concentration of virus, the sampling times without UVGI exposure ranged from 30 sec to 1 min, and those with UVGI exposure ranged from 1 min to 5 min. After sampling, the plate with collection medium from the impactor was placed in an incubator at 37 °C for 10 min. All of the viral samples were subjected to plaque assay for coliphage at 37 °C and for phi 6 at 26 °C. Then, PFU per cubic meter (PFU/m3) was calculated based on the dilution ratio, plated volume, sampling time, and sampling flow rate. Our results showed that the virus infectivity in the aerosolized suspension and aerosol phase (at 55% and 85% RH) could be maintained up to 90 min with a coefficient of concentration variation less than 25% (Tseng and Li., 2005). Therefore, the natural decay rates of the aerosolized suspension were found to be insignificant.
Surface Test System
(I) Solid Media on a Gelatin Agar Plate
A diluted culture of virus stock solution (0.1 ml) was spread on the surface of LB (Luria-Bertani) media plates (with 3% gelatin) and then dried for 20 min in laminar flow. The virus concentration in each plate was 108 PFU/ml. All of the viral samples (both UVGI-exposed and unexposed samples) were subjected to plaque assay for coliphage at 37 °C and for phi 6 at 26 °C. For UVGI-exposed samples, the UV-induced inactivation on virus growth was observed. For all viral samples, the observed incubation time period was 24 hours. The virus survival fraction was calculated as the ratio of the number of plaques forming on the UVGI-exposed plates compared to that on the UVGI-unexposed control plates. Based on our preliminary test (data not shown), we selected the UVGI intensity range from 60 μ W/cm2
to 240 μ W/cm2, and the exposure time range from 3 sec to 6 min. Experiments were done at least in triplicate for each set of conditions for different UV intensity (60, 120, 180, or 240 μ W/cm2), RH (55% and 85%), and test virus. The test system was located in a chemical hood so
that the exhausted gas was vented outside.
(II) RH Regulation Unit
The experimental apparatus used for RH regulation was the same as that used in the
aerosol test system described above,
consisting of a compressed air system, RH conditioner, and an UV exposure chamber. The humidified gas stream was generated by passing pure compressed air through a humidity saturator. The air temperature and RH (55% and 85%) throughout the trials were monitored using a humidity/temperature sensor (Hygromer-A1, Rotronic) mounted inside the chamber.
(III) UV Exposure Unit
The UV exposure chamber was
approximately 26 liters in volume (26.5 cm x 30 cm x 33 cm). The exposed samples were irradiated with four 8W UV-C lamps (Philips Germicidal Lamp, TUV 8W/G8 T5, Holland), which were placed 30.5 cm above the surface of the media. Lamps were wrapped in a layer of cellophane to attenuate
original irradiation magnitude. The
intensity of UVGI on the surface of the media was measured using an UV-radiometer (P-97503-00, Cole-Parmer, France) with a 254-nm sensor. The UV intensity level was adjusted to 60, 120, 180, or 240 μ W/cm2 by changing the number of lamps. Finally, the UV dose was calculated as the product of the UV intensity and UV exposure time.
• Survival Fraction of Viruses vs. UVGI Exposure
The total dose to which an airborne virus was exposed was defined as the product of the UVGI intensity I on the microbe and the exposure time t. The survival fraction is a ratio that represents the virus concentration after UVGI exposure, and defined as
where
Na,uv = concentration of airborne virus
KIt s uv s a uv a
e
N
N
or
N
N
−=
0 , , 0 , ,surviving after exposure to UVGI
by using one-stage Andersen
sampler (PFU/m3)
Na,0 = concentration of airborne virus
unexposed to UVGI by using
one-stage Andersen sampler
(PFU/m3)
Ns,uv = centration of surface virus
surviving after exposure to UVGI (PFU/ml)
Ns,0= concentration of surface virus
unexposed to UVGI (PFU/ml)
I = UV intensity (μ W/cm2)
t = UV exposure time
K = microorganism susceptibility factor
(cm2 /μ W sec)
Statistics
The parameter exponential log of the survival fraction vs. UV dose for each experiment was used to perform regression analysis on the data for each virus. Comparisons of survival fraction among the viruses were performed using t test to evaluate statistically significant differences.
六 、 結 果 與 討 論
In this study, the germicidal effect of UVGI was evaluated for both airborne and surface viruses. The effect of UV dose and RH was evaluated for two different bacteriophages selected to represent virus nucleic acid: bacteriophages with ssRNA (MS2), or dsRNA (phi 6).
The effectiveness of UVGI on both airborne and surface viruses inactivation was fitted well with an exponential decay model where the logarithm of survival fraction of virus surviving with UVGI exposure was linearly proportional to UVGI dose. Our findings were also consistent with the Bunsen-Roscoe reciprocity law, which states that virus survival fraction with UVGI irradiation being dependent on UV dose, is not affected by reciprocal changes in UV intensity or to exposure time. In summary, the germicidal effects of UVGI for airborne
and surface virus inactivation depended on UV dose, neither UV intensity nor exposure time. In this study, the survival fraction decreased exponentially with increasing UVGI dose.
Survival Fraction of Airborne Viruses after UVGI Exposure Figures 2 and 3 show the measured survival fraction of two viruses at the two RH conditions. For all four viruses, the survival fraction was inversely related to UVGI dose. To obtain 90% virus inactivation, the ssRNA virus (MS2) required only an extremely low dose (339-423 μ W
sec/cm2), the the dsRNA virus (phi 6)
required a relatively high dose (662-863 μ W sec/cm2). These results indicate that the UVGI dose for 90% inactivation of dsRNA and dsDNA viruses is approximately 2 times higher than that of ssRNA and ssDNA viruses.
To obtain 99% virus inactivation, the ssRNA virus (MS2) required a dose of 803-909 μ W sec/cm2, and the dsRNA virus (phi 6) required a dose of 1388-1771 μ W sec/cm2. Similar to the results for 90% inactivation, these results indicate that the UVGI dose for 99% inactivation of dsRNA viruses is approximately 2 times higher than that of ssRNA viruses.
The required doses for the two viruses evaluated in this study are similar to those reported for airborne fragile bacteria, E.coli (Lin and Li, 2002), but are significantly lower than those for endospore bacteria (B.
subtilis), fungi (yeast), and fungi spore (P. citrinum). Therefore, UVGI is clearly more
effective for inactivation of airborne virus than for inactivation of yeast and other spore-type microorganisms.
In our study, the survival fraction decreased exponentially with increasing UVGI dose. Based on simple exponential regression analyses, the microorganism susceptibility factor, K (expressed in
cm2 /μ Ws), which is a commonly used
indicator of the sensitivity of the test microorganism, varied widely. MS2 showed the highest K (0.0054-0.0068) and phi6 the lowest (0.0031-0.0043).
Previous findings (Thurston-Enriquez et al., 2003) suggest that viruses with dsRNA or
dsDNA are less susceptible to UV
inactivation. The reason is that only one strand of the nucleic acid is damaged during inactivation, and the undamaged strand might then serve as a template for repair by host enzymes (Kallenbach et al., 1989). For DNA viruses, host cells can contain the enzymatic machinery to repair damage by excision or recombinational repair. This has been suggested as a reason for the
shouldering effect observed in UV
inactivation experiments involving dsRNA viruses. Except for the complex nucleic acid, the capsid structure and the lipid component of virus might act as barriers that prevent UVGI penetration. Therefore, shielding or absorption of UV irradiation before reaching the nucleic acids might occur. Based on our results (as shown in Figures 2 and 3), phi6 with high-resolution capsid (Bamford et al., 2002) and lipid envelope showed higher susceptibility to UVGI than
did isosahedral bacteriophages (MS2)
without lipid.
The K of airborne viruses studied here ranged from 0.0031 to 0.0081, similar to that reported (Lin and Li, 2002) for bacterial aerosol of E. coli (0.0032–0.0054), but much higher than that for a fungal aerosol of yeast (0.00036-0.00050),B.subtilis(0.00039-0.0005 0), and P.citrinum (0.000092-0.00015). These findings reveal that the susceptibility to UVGI of viruses is similar to that of fragile bacteria, but is higher than that for endospore bacteria, yeast, and fungi spores. These results can be explained as follows; the susceptibility of microorganisms to UV irradiation is highly related to the presence or absence of a cell wall, to the cell-wall thickness, and to the type of nucleic acid. Because viruses lack a cell wall, they might be more susceptible to UVGI irradiation.
For all viruses tested here, K
(0.0031-0.0064) at 85% RH was lower than that (0.0043-0.0081) at 55% RH (Figs. 2 and 3), indicating that a higher UVGI dose was required to inactivate a virus at higher RH
conditions. At higher RH, the UVGI was apparently attenuated by water vapor. The water sorption onto a virus surface might also provide protection against UV-induced RNA damage when RH is increased (Peccia et. al, 2001).
Survival Fraction of Surface Viruses after UVGI Exposure
Figures 4 and 5 show the virus survival fraction and UV exposure dose for the two tested viruses at 55% and 85% RH, respectively, for surface evaluation. For 90% inactivation, the ssRNA virus (MS2) required an extremely low UV dose (658 to
1332 μ Wsec/cm2), and dsRNA (phi 6)
required a relatively higher dose (1294 to 4352 μ W sec/cm2). These results clearly indicate that dsRNA viruses are more resistant to UV light inactivation than are ssRNA viruses. The measured UVGI dose for the ssRNA virus (658 to 1332 μ Wsec/cm2) agrees with that previously reported for poliovirus type 1 (ssRNA), 960 μ Wsec/cm2 necessary for 90% inactivation on clear suspending medium (Nuanualsuwan and Cliver, 2003).
For 99% surface virus inactivation, the UVGI dose for MS2 ranged from 2376 to
3310 μ W sec/cm2, and for ph6 from 7644 to
8915 μ W sec/cm2. These results indicate that the dose for surface virus inactivation for dsRNA viruses is approximately 3 times higher than that for ssRNA viruses. These UV doses for 99% surface virus inactivation are similar to that previously reported for
E.coli (4160 to 5530 μ W sec/cm2), but much lower than that for subtilis (24920 to 40310 μ W sec/cm2
), yeast (12260 to 13700 μ W sec/cm2), and P. citrinum (30160 to 41520 μ W sec/cm2
) (Lin and Li, 2005). The K of the surface viruses studied here was the highest for MS2 (0.0007-0.0017) and lowest for T7 (0.0002-0.0004), indicating that dsRNA viruse is more resistant to UV
irradiation than are ssRNA viruse.
Comparison with the K of airborne viruses measured here reveals that the apparent UV lethal radiation doses required for airborne
viruses are lower than those for surface viruses. With respect to RH effect on surface virus inactivation, for all viruses tested here the survival fraction at 85% RH was higher than that 55% RH. The humid conditions possibly promote water sorption onto a virus surface that might provide protection against UV-induced DNA damage. Comparison of UVGI Dose for Airborne and Surface Virus Inactivation
Our results show the UV lethal radiation doses required for airborne viruses (Figs. 2 and 3) were lower than those for surface viruses (Figs. 4 and 5). Furthermore, the ratio of the inactivation dose for surface viruses to airborne viruses for 90% inactivation ranged from 3.9 to 7.6 for MS2, and from 5.7 to 6.2 for phi 6. One explanation for the higher dose required for surface virus inactivation might be that only one side of the surface virus was exposed to UVGI on the medium surface, whereas the entire surface of the airborne virus was exposed to UVGI. Furthermore, because the viruses on a surface might be aggregated, a higher UVGI dose might be needed to inactivate a surface virus. Therefore, not only the UVGI intensity and the exposure time but also the degree of virus aggregation affected the UV effectiveness on surface viruses (Galasso et al., 1965). For bacteria and fungi (Lin and Li, 2002; Lin and Li, 2005), the ratio of the inactivation dose for surface viruses to airborne viruses ranged from 4.18 to 5.62 for E. coli, from 2.95 to 3.38 for B. subtilis, from 1.18 to 1.57 for yeast, and from 0.69 to 1.35 for P. citrinum. Based on our results and these previous results, the UVGI dose that can inactivate surface microorganisms will be more than
adequate to inactivate airborne
microorganisms, especially for viruses and fragile bacteria.
In summary, our current results agreed with the previous extensive laboratory and model-room studies that the germicidal effects of UVGI irradiation on viral nucleic acid are related to the UV intensity and
exposure time (Ko et al., 2000; Ko et al., 2002). UVGI inactivation of ssRNA was easier than that of dsRNA and dsDNA viruses, regardless of whether the viruses were suspended in air or on a surface. In addition, viruses could be protected from the UV light inactivation by a complex nucleic acid, by strong capsid structures, by host cell repair mechanisms, and by lipid content. For all viruses evaluated here, the survival fraction at 85% RH was higher than that at 55% RH. Finally, the UVGI dose that can inactivate surface viruses will be more than adequate to inactivate airborne viruses.
七 、 計 畫 成 果 自 評 本 計 畫 已 在 實 驗 室 中 建 立 病 毒 氣 膠 採 樣 與 控 制 的 評 估 系 統 , 並 已 運 用 此 系 統 評 估 紫 外 線 對 空 氣 以 及 表 面 病 毒 之 去 除 效 果 , 此 成 果 可 運 用 於 環 境 病 毒 之 控 制 , 並 進 一 步 達 到 預 防 病 毒 感 染 之 成 效 。 八 、 參 考 文 獻
1. Bamford, D. H., Burnett, R. M., and
Stuart, D. I. (2002). Evolution of Viral Structure, Theo. Pop. Biol. 61: 461-470. 2. Brickner, P. W., Vincent, R. L., First,
M., Nardell, E., Murray, M., and Kaufman, W. (2003). The Application of Ultraviolet Germicidal Irradiation to Control Transmission of Airborne Disease: Bioterrorism Countermeasure,
Pub. Health. Rep. 118: 99-114.
3. CDC (1994). Guidelines for preventing the transmission of Mycobacterium
tuberculosis in health-care facilities.
MMWR 43(RR-13), 1-132.
4. Galasso, G. J., and Sharp, D. G. (1965).
Effect of Particle Aggregation on Survival of Irradiated Vaccinia Virus, J.
Bacteriol. 90: 1138-1142.
5. Gerba, C. P., Gramos, D. M., and
Nwachuku, N. (2002). Comparative
Inactivation of Enteroviruses and
Adenovirus 2 by Uv Light, Appl.
6. Havelaar, A. H., Nieuwstad, T. J., Meulemans, C. C. E., and Vanolphen,
M. (1991). F-Specific Rna
Bacteriophages as Model Viruses in Uv Disinfection of Waste-Water, Water Sci.
Technol. 24: 347-352.
7. Jensen, M. M. (1964). Inactivation of
Airborne Viruses by Ultraviolet
Irradiation, Appl. Microbiol. 12: 418-420.
8. Jones, M. V., Bellamy, K., Alcock, R., and Hudson, R. (1991). The Use of Bacteriophage-Ms2 as a Model System
to Evaluate Virucidal Hand
Disinfectants, J. Hosp. Infect. 17: 279-285.
9. Kallenbach, N. R., Cornelius, P. A., Negus, D., Montgomerie D., and Englander, S. (1989). Inactivation of Viruses by Ultraviolet Light, In. J. J. 70-82. Morgenthaler (ed.), Virus Inactivation in Plasma Products, 56. Karger, Basel, Switzerland.
10. Ko, G., First, M. W., and Burge, H. A. (2000). Influence of Relative Humidity on Particle Size and Uv Sensitivity of Serratia Marcescens and Mycobacterium Bovis Bcg Aerosols, Tuber. Lung. Dis. 80: 217-228.
11. Ko, G., First, M. W., and Burge, H. A.
(2002). The Characterization of
Upper-Room Ultraviolet Germicidal Irradiation in Inactivating Airborne
Microorganisms, Environ. Health.
Perspect.110: 95-101.
12. Lin, C. Y., and Li, C. S. (2002). Control
Effectiveness of Ultraviolet Germicidal Irradiation on Bioaerosols, Aerosol. Sci.
Technol. 36: 474-478.
13. Lin, C.Y. and Li, C. S. (2005). Evaluation of Surface Disinfection by
Ultraviolet Germicidal Irradiation,
submitted. A&WMA
14. Luckiesh M. (1946). Applications of germicidal, erythemal and infrared energy. D. Van Nostrand Company, Inc.;.New York.
15. Ma, J. F., Straub, T. M., Pepper, I. L., and Gerba, C. P. (1994). Cell-Culture and Pcr Determination of Poliovirus Inactivation by Disinfectants, Appl.
Environ. Microbiol. 60: 4203-4206.
16. Maillard, J. Y. (1996). Opinion - Bacteriophages: A Model System for Human Viruses, Lett. Appl. Microbiol. 23: 273-274.
17. Maillard, J. Y., Beggs, T. S., Day, M. J., Hudson, R. A., and Russell, A. D.
(1994). Effect of Biocides on
Ms2-Coliphage and K-Coliphage, Appl.
Environ. Microbiol. 60: 2205-2206.
18. Nevalainen, A., Willeke, K., Liebhaber, F., Pastuszka, J., Burge, H., and Henningson, E. (1993). Bioaerosol Sampling. Aerosol Measurement:
Principles, Techniques, and Applications, (Edited by Willeke, K. and
Baron, P. A.), 471-492. Van Nostrand Reinhold, New York
19. Nicas, M. (1996). Estimating Exposure Intensity in an Imperfectly Mixed Room,
AIHAJ 57: 542-550.
20. NIOSH(1972). Occupational Exposure to Ultraviolet Radiation; Criteria for a
Recommended Standard. DHEW
Publication no. (HSM) 73-11009. U. S. Department of Health, Education, and
Welfare, Public Health Service,
Rockville, MD.
21. Nuanualsuwan, S., and Cliver, D. O.
(2003). Infectivity of Rna from
Inactivated Poliovirus, Appl. Environ.
Microbiol. 69: 1629-1632.
22. Peccia, J., Werth, H. M., Miller, S., and Hernandez, M. (2001). Effects of Relative Humidity on the Ultraviolet
Induced Inactivation of Airborne
Bacteria, Aerosol. Sci. Technol. 35: 728-740.
23. Poutanen, S.M., Low, D.E., Henry, B., Finkelstein, S., Rose, D., and Green, K. (2003) Identification of Severe Acute Respiratory Syndrome in Canada. N.
Engl. J. Med. 348:1995–2005.
24. Rentschler, H. C. (1941). Bactericidal Effect of Ultraviolet Radiation, J.
Bacteriol. 42: 745-774.
25. Sharp, D. G. (1938). A Quantitative Method of Determining the Lethal Effect of Ultraviolet Light on Bacteria Suspended in Air, J. Bacteriol. 35: 589-599.
26. Shin, G. A., and Sobsey, M. D. (2003). Reduction of Norwalk Virus, Poliovirus 1, and Bacteriophage Ms2 by Ozone Disinfection of Water, Appl. Environ.
Microbiol. 69: 3975-3978.
27. Summer, W.(1962). Ultraviolet and
Infrared Engineering. Interscience
Publishers, Inc., New York, pp. 197, 202-203.
28. Thurston-Enriquez, J. A., Haas, C. N., Jacangelo, J., Riley, K., and Gerba, C. P.
(2003). Inactivation of Feline
Calicivirus and Adenovirus Type 40 by Uv Radiation, Appl. Environ. Microbiol. 69: 577-582.
29. Tsang, K.W., Ho, P.L., Ooi, G.C., Yee, W.K., Wang, T., and Chan, Y. M. (2003). A Cluster of Cases of Severe
Acute Respiratory Syndrome in
HongKong. N. Engl. J. Med.
348:1977–1985.
30. Tseng, C. C. and Li, C. S. (2005). Collection Efficiencies of Aerosol Samplers for Virus-containing Aerosols,
J. Aerosol Sci. 36:593-607.
31. Wells, W. F., Wells, M. W., and Wilder, T. S. (1942). The Environmental Control of Epidemic Contagion. I. An
Epidemiologic Study of Radiant
Disinfection of Air in Day Schools, Am.
Ind. Hyg. Assoc. J. 35: 97-121.
32. Wetz, K., Zeichhardt, H., Willingmann, P., and Habermehl, K. O. (1983). Dense
Particles and Slow Sedimenting
Particles Produced by
Ultraviolet-Irradiation of Poliovirus, J.
Pump Compressed Air 1.pressure regulator 2.HEPA filter 3.needle valve 3
4.mass flow controller 4
4
5.Nebulizer
6.diffusion dryer 7.neutralizer
8.humidifier
9.heat plate
10.ultraviolet germicidal lamps
12.Andersen sampler 13.hygrometer 11.quartz tube (exposure chamber)
A A 30 cm AA Section Quartz tube UV lamp 5 cm 5 cm 7 cm 3
Fig. 1. Experimental apparatus to evaluate UVGI
on virus-containing aerosols. 1. pressure regulator; 2. HEPA filter; 3. needle valve; 4. mass flow controller; 5. nebulizer; 6. diffusion dryer; 7. neutralizer; 8. humidifier; 9. heat plate; 10. ultraviolet germicidal lamps; 11. quartz tube (exposure chamber); 12. Andersen sampler; 13. hygrometer. b. AA Section. The distance between UV lamps and quartz tube is adjustable (from 0 to 30 cm). 0 200 400 600 800 1000 1200 1E-3 0.01 0.1 1 MS2 K=0.0081, r=-0.98 phi 6 K=0.0043, r=-0.98 S u rv iv a l F ra c ti o n Dose (µ W sec/cm2 )
Fig. 2. Survival fraction of airborne viruses (MS2, and phi 6) exposed to UVGI at RH 55%. Error bars represent one standard deviation of the mean of at least three trials.
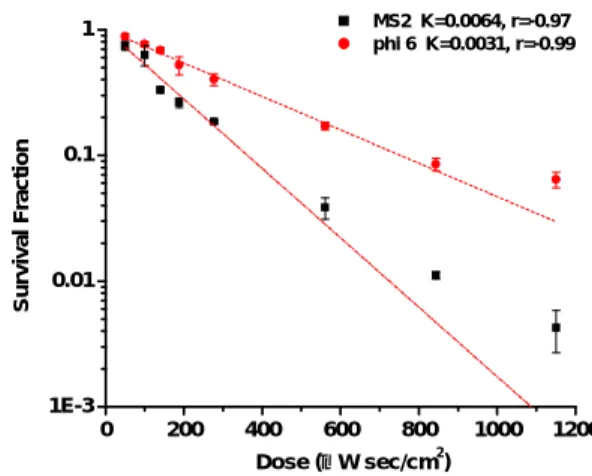
0 200 400 600 800 1000 1200 1E-3 0.01 0.1 1 MS2 K=0.0064, r=-0.97 phi 6 K=0.0031, r=-0.99 S u rv iv a l F ra c ti o n Dose (µ W sec/cm2 )
Fig. 3. Survival fraction of airborne viruses (MS2, and phi 6) exposed to UVGI at RH 85%. Error bars represent one standard deviation of the mean of at least three trials.
0 5000 10000 15000 20000 25000 30000 1E-7 1E-6 1E-5 1E-4 1E-3 0.01 0.1 1 MS2 K=0.0017, r=-0.97 phi 6 K=0.0006, r=-0.98 S u rv iv a l F ra c ti o n Dose (µ W sec/cm2 )
Fig. 4. Survival fraction of surface viruses (MS2, and phi 6) exposed to UVGI at RH 55%. Error bars represent one standard deviation of the mean of at least three trials.
0 5000 10000 15000 20000 25000 30000 1E-7 1E-6 1E-5 1E-4 1E-3 0.01 0.1 1 MS2 K=0.0007, r=-0.91 phi 6 K=0.0004, r=-0.99 S u rv iv a l F ra c ti o n Dose (µ W sec/cm2)
Fig. 5. Survival fraction of surface viruses (MS2, and phi 6) exposed to UVGI at RH 85%. Error bars represent one standard deviation of the mean of at least three trials.