Characteristics of the Gain and Signal-To-Noise Ratio
of a Distributed Erbium-Doped Fiber Amplifier
Senfar Wen and Sien Chi
Absfract- The effects of the stimulated Ramam scattering
(SRS) on the gain and signal-to-noise ratio (SNR) of the DEDFA with 100-km fiber length and with bidirectional pumps are numerically studied. It is found that the gain and SNR are significantly enhanced by the SRS with practical parameters. For 1.55-pm signal and 10-pW initial signal power, there are 8.8-dB gain enhancement and 3.3-dB SNR enhancement for 1.48-pm pump wavelength and 75" initial pump power. The characteristics of the gain and SNR enhancements due to SRS are studied for different signal wavelength, signal powers, pump wavelengths, pump powers, and effective fiber cross sections. The results show that the gain and SNR are decreased by SRS only for the unpractical high pump power and/or small effective fiber cross section.
I. INTRODUCTION
HE erbium-doped fiber amplifier (EDFA) is an optical
T
amplifier in the third telecommunications window near 1.55-pm regime [l], [2]. There are extensive studies about the EDFA [3]. These works show the EDFA is effective and practical for optical communication systems. The erbium ions are doped in the fiber core and the waveguide structure provides excellent power confinement to pump the erbium ions over long interaction length. Besides, the EDFA can be used in the wavelength-division-multiplexing (WDM) communication system because of its large gain bandwidth in the 1.55-pm regime. The fiber of a few tens of meters in length and with heavily doped erbium ions is used as a lumped EDFA (LEDFA) [4]. The LEDFA amplifies the signal power within the erbium-doped fiber and provides few tens of dB gain. On the other hand, the fiber of several tens of kilometers in length and with lightly doped erbium ions is used as a distributed EDFA (DEDFA) [ 5 ] , [6]. The DEDFA provides the gain and it is itself the transmission line. In theory, the DEDFA can have lower amplified spontaneous emission noise (ASEN) than the LEDFA [7], [8], but, in practice, the advantage is not significant [9]. However, because the DEDFA has the advantage of lower excursion of the signal power than the lumped amplifier, the DEDFA is more suitable for both linear or nonlinear signal transmission at the ultra-high bit rate.Manuscript received October 17, 1991; revised May 29, 1992. S. Wen was supported by National Science Council of R.O.C. under contract NSC 81- 0417-E216-01. S. Chi was supported by National Science Council of R.O.C. under contract NSC 81-0417-E009-05.
S. Wen is with the Department of Electrical Engineering, Chung-Hua Polytechnic Institute, Hsinchu, Taiwan 30067, Republic of China.
S. Chi is with the Institute of Electro-Optical Engineering and Center for Telecommunications Research, National Chiao Tung University, Hsinchu, Taiwan 30050, Republic of China.
IEEE Log Number 9204528.
The LEDFA and DEDFA are basically the same, except their fiber lengths and doping densities differs about three order of magnitudes. Recently, it is found that the SRS [lo] enhances both the gain and SNR of the DEDFA at the 1.55-pm signal wavelength [ l l ] . While, the SRS in LEDFA can be neglected because the fiber length is too short. There are several bands of wavelengths that can be used to efficiently pump the erbium- doped fiber to provide gain at 1.55-pm regime (121, 1131. Because the intrinsic loss of the fiber is important for the long distance fiber, the pump wavelength near 1.48 pm has the advantage of lower intrinsic loss than the other bands [6], [14], [15] and is used in the DEDFA. Because the Raman gain is maximum for 440-cm-l frequency separation, the 1.55-pm wavelength regime is within the Raman gain spectral width for 1.48-pm pump wavelength. In the DEDFA, the effect of the SRS reduces the gain from the pumped erbium ions because part of the pump power is depleted by SRS. Although the efficiency of the SRS is less than the stimulated emission of the pumped erbium ions, the pump power simultaneously utilized by the two effects leads to the result that the gain from the SRS is larger than the reduction of the gain from the pumped erbium ions and the total gain increases.
In this paper, we consider the effects of the SRS on the DEDFA for different signal wavelengths, signal powers, pump wavelengths, pump powers, and effective fiber cross sections to numerically study the characteristics of the gain and SNR of the DEDFA with SRS. The theoretical model used in this paper is described in Section 11. The evolutions of the optical powers and gain coefficients along the fiber are considered in Section 111. In Section IV, the characteristics of the effects of the SRS on the gain and SNR of the DEDFA are studied. The conclusions are given in Section V.
11. THEORETICAL MODEL
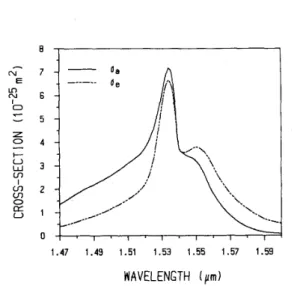
The signal propagating in the erbium-doped fiber of long length experiences the gain from the pumped erbium ions and the SRS. Fig. 1 shows both the absorption cross-section line- shape ( oa (A)) and emission cross-section lineshape ( cre (A)) of the erbium ions doped in the fiber [16]. The maximum emission cross section is near 1.53 pm. Fig. 2 shows the Raman gain spectrum (g,(Au,)) [17], where Au, is the frequency difference between the pump wave and the stoke wave. In Fig. 2, the maximum gain coefficient is 1.97 x 10⁻¹⁴/A, m/W when Au, = 440 cm-', where A, is the pump wavelength and in unit of micrometers [18]. It is noticed that the absorption and emission cross sections considered in [ l l ] are different from that given in Fig. 1. 0733-8724/92$03.00 0 1992 IEEE
1870 JOURNAL OF LIGHTWAVE TECHNOLOGY, VOL. 10, NO. 12, DECEMBER 1992
-
N EI
1.47 1.49 1.51 1.53 1.55 1.57 1.59 WAVELENGTH ( y m )Fig. 1. Spectra of the absorption cross section ..(A) and emission cross section oe(X) of the erbium ions doped in the fiber.
z U =E [r a 0.0 0 100 200 300 4W 500 600 700 FREQUENCY 0
I
FFERENCE (em-' 1Fig. 2. Spect" of the Raman gain gP(Aup) in the fiber. The max- imum gain coefficient is 1.97 x 10⁻¹⁴/X, at the frequency difference AV, = 440 cm-l where A, is pump wavelength and in unit of micrometers.
-
-Is+
"""(I,+
+
1;)
hu,
and, nl = nt
-
n.2, where nt is the total erbium ions density,and nl and n2 are the populations densities of the ground level and upper level, respectively. In this paper, we use the superscripts
+
and-
to denote the variables corresponding to the optical beam propagating along $ 2 and -2 directions,respectively. We will call the wave propagating in +z direction the forward wave and the wave propagating in - 2 direction the
backward wave. For example, in (l), 1; is the forward pump power intensity and so on. The absorption and emission cross sections of the signal beam, pump beam and kth ASE beam are ~ , , ~ : , , , , k T is the spontaneous life time of the upper level.
The rate equation given by (1) depends on the coordinates z , T,
4.
To simplify the rate equation, we make the followingassumptions. We assume a Gaussian approximation for the optical mode of wavelength A j and
where P: is the power of the optical mode and w j is the mode spot size. The erbium ions are assumed to be uniformly doped within a radius of 6 in the fiber core and the radius b is small enough that the erbium ions are uniformly pumped. With these assumptions, we have the rate equation which depends only on z by integrating (1) over the transverse cross section of the fiber and it becomes
where the data are reported more recently. Because of the N
Ae
high gain of the DEDFA, the spontaneous emission noise and 2, the gain bandwidths Of both effects are large and
(ASEN) is broadband. We consider the ASEN as a number
at the optical wavelength x k = C / V k to resolve the ASE spectrum [16]. For the pump wavelength A, = 1.45-1.5 pm, the pumped erbium ions can be modeled as a two level system and its rate equations describing the effects of the
signal power intensity ( I s ( z , r ,
d)),
pump power intensity5
= [rs(oeSn2-
oasnl)+
*
(pp++
p ~ )
-
a i s ]c
on the population densities are [16]
is amplified and depletes the pump power. From Figs. 1 k = l
where A , = Tb2 is the dopant area and
r j
is the confinement the spectrum Of the amp1ified spontaneous emission noise factor related to the optical mode of wavelength A, and of optical beams with frequency bandwidth Auk centeredr .
3 --
1 - e - b z / w : . (4)The equations to describe the variations of the powers of the optical beams through the fiber are
(5)
(7) where A,, = TW? is the mode area related to the optical mode
of wavelength A,: CY,] is the intrinsic loss at the wavelength
A, : in (7), m = 2 represents the two polarization modes of the ASEN; U+ = $1 and 11- = -1 correspond to the forward
and backward waves, respectively. In (6), the terms with the Raman gain coefficient .yTk represent the pump depletion due to SRS. On the other hand, in (5) and (7), the terms with
g,.k represent the Raman gain from the pump waves, and the
terms with hukAuk in (7) represent the spontaneous emission. It is noticed that, the Raman effect among the signal and the ASEN beams are neglected. The neglection is valid when the power of the signal and the ASEN are small. Assuming the steady-state condition for the rate equation (3), the population densities nl and n 2 in (5)-(7) can be derived in terms of the optical mode powers. With this assumption, (5)-(7) become
(10) where the ratio of the population density of the upper state n2 and the erbium ion density nt is
for IC = s , p . 1 . 2 , .
.
. N .In this paper, the coupled equations @)-(lo) are numeri- cally solved with the absorption cross section o a k and emission
cross section r r c k given by Fig. 1, the Raman gain coefficient
g l k given by Fig. 2, and the following parameters: T = 10 ms, nt = 1 x 10” m-3, b = 1 pm (il, = 3.14 jrm’), fiber length
L = 100 km, and ( 1 , k = 0.26 dB/km, wk = w ( & ~ = &) for all k for simplicity. The mode spot size J is varied in the
followings.
The initial signal power Ps(0) = Pso is launched into the fiber at z = 0. For bidirectional pumping, the initial pump powers P:(0) = P,-(L) =
f‘,,
are launched into the fiber at z = 0 and L, respectively. We use 100 points to sample the ASE spectrum from 1.5-1.6 pm, which corresponds to the wavelength spacing of AA = 1 nm (the corresponding frequency spacing Auk = 128.1 GHz at A,, = 1.53 ILm), and there are 1+
2+
2 x 100 = 203 differential equa- tions necessarily to be solved simultaneously for bidirec- tional pumping.Before considering the effect of SRS on the DEDFA, we estimate the power range that SRS should be considered. Inspecting the gain coefficients in (S), the effect of SRS is important when the pump power is high enough. When the pump power equals
the gain coefficients from the pumped erbium ions and SRS are equal. Therefore,
Pi
is the pump power when the gains from the pumped erbium ions and SRS are comparable for the wavelength at A,. We call Pi the comparable pump power. In (13), 7 1 2 / i ~ t depends on z and, from ( l l ) , the maximum achievable value of i t z / n t isn2 nap
ILkLX- = ~
ILt g e p
+
g u pfor the pump power Pp
>>
Pi‘, where Pj’ is only few milli- Watts for the parameters given above. Substituting (13) into (13), we have the comparable pump power(14)
In (15), the ratio (S,,/O~~ should be small for efficient pump rate. From Fig. 1, (T,,/(T,, = 0.3 for A, = 1.38 I‘m. From (15), P; increases as the emission cross section at the signal wavelength and decreases as the Raman gain coefficient increases. The comparable pump power Pi varies with the wavelength. For A, = 1.48 pm, -4, = 35 /mi2 for the dis- persion shifted fiber [19], and the other numerical parameters given above, we have P; = 330 mW for A,, = 1.53 pm and
Pi = 150 mW for A, = 1.55 pm.
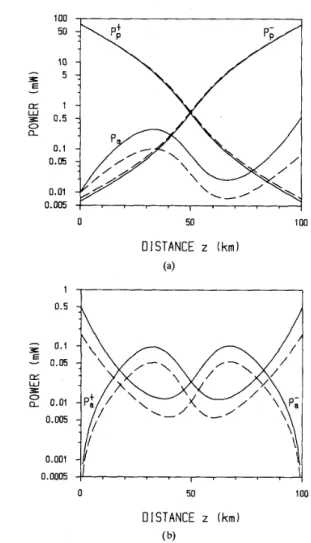
111. EVOLUTIONS OF THE OPTICAL WAVES ALONG THE FIBER In this section, we consider the variations of the optical powers and gain coefficients along the fiber to show the gains from the pumped erbium ions and SRS. Fig. 3(a) and (b) shows the evolutions of the signal power P,, pump powers
1872 JOURNAL OF LIGHTWAVE TECHNOLOGY, VOL. 10, NO. 12, DECEMBER 1992 100 50 10 3 = 5 E I E 1 W 3 0.5 0 Q 0.1 0.05 0.01 0.005 0 50 100
DISTANCE
z
(km) (a) 1 , 1 0.5h
n
0.00051'
I.
I,
, I , , I( 0 50 100DISTANCE
z (km) ( b)Fig. 3. Variations of the (a) signal power P,, forward pump power P:, backward pump power P; and (b) total forward ASE power P:, total backward ASE power Pa- along the fiber of length L = 100 km and erbium ions density nt = 1 x 10²²m-3 for 1.55-pm signal and 1.48-pm pump. The initial signal power P,o = 10 pW and the initial pump power PPo = 75 mW. The powers with and without SRS are shown by the solid and dashed lines, respectively.
the signal with 1.55-pm wavelength and 10-pW initial power, and the pump with 1.48-pm wavelength and 75-mW initial power, and the effective fiber cross section A, = 35 pm2. The total ASEN powers are defined as P,' =
E:='=,
P:. It is noticed that the given pump power is the case half of the comparable pump power shown in the last section. In Fig. 3(a) and (b), the case without SRS is also shown for comparison. From Fig. 3(a), it is seen that the signal power with SRS at the output end of the fiber ( z =L )
is higher than the signal power without SRS and the pump powers with SRS are depleted more seriously than the pump powers without SRS. Therefore, in the case with SRS, the pump powers are more efficiently utilized and the signal obtains more gain. From Fig. 3(a), the gain with SRS is 17.6 dB and the gain without SRS is only 8.8 dB. The effect of the SRS enhances 8.8-dB gain in this case. The gain enhancement A G is defined as A G = G,,-
G,, where G,,is the gain with SRS and G, is the gain without SRS.
0.2 ,
-
0.15 E y 0.15
0.05 Uz
0.0 LL W8
-0.05 z U-
4 -0.1 -0.15 0 50 100DISTANCE
z(km)
Fig. 4. Variations of the gain coefficients a e s , a r s , and at, of the case
shown in Fig. 3(a). The gain coefficients with and without SRS are shown by the solid and sashed lines, respectively.
The gains from the pumped erbium ions and SRS can be clearly seen by the evolutions of the gain coefficients from the two effects. From (8), we define the gain coefficient from the pumped erbium ions is ae, = (ag,
+
al,)nn/nt-
azs
and the gain from the SRS is a,, = (g,,/A,,)(P:
+
P;). The gains from the two effects are the integrations of the gain coefficients over the fiber length. Because there is the intrinsic fiber loss, the total gain coefficient is at, = aes +a,,-
a;,. It is noticed that the total gain coefficientat,
defined here is different from that defined in [ll], where a%, is not included in a t S . For the case without SRS, a,,, = 0 and at, = a e s - atS. Fig. 4shows the evolutions of the gain coefficients for the cases with SRS and without SRS shown in Fig. 3. It is seen that the gain coefficient from SRS is significant at the beginning but decays quickly due to decaying pump power. The gain coefficient from the pumped erbium ions is lower than the case without SRS due to part of the pump power is depleted by SRS. The total gain coefficient of the DEDFA with SRS is larger than the gain coefficient of the DEDFA without SRS except in the middle of the transmission length. Although the gain from the pumped erbium ions is reduced due to part of the pump powers is depleted by SRS, the gain from SRS is larger than the reduction of the gain from the pumped erbium ions.
Although the signal gain is enhanced by the SRS, the gain of the ASEN is enhanced also as is shown in Fig. 3(b). An important problem is whether the SNR is also enhanced by the SRS. Using the bandpass optical filter with center of wavelength at A = A, and bandwidth AX, = 0.2 nm at the end of the fiber, we define the SNR as the ratio of the output signal power and the output ASEN power and
SNR 10 x log(AAP,(L)/Ax,P,+(L)) (16) where P z ( L ) is the power of the forward ASEN with band- width AA centered at A,. For the case shown in Fig. 3(a) and 3(b), the SNR with SRS is 25.3 dB and the SNR without SRS is 22.0 dB. Therefore, the effect of SRS enhance 3.3-dB SNR in this case. The SNR enhancement ASNR is defined as ASNR = SNR,,
-
SNR,, where SNR,, is the SNR with SRS and SNR, is the SNR without SRS.IV. GAIN AND SNR
The DEDFA is usually designed to have zero decibel net gain, i.e., the fiber loss is just compensated. The 17.6-dB gain of the DEDFA shown in the last section is much higher than required. If the pump power is reduced for zero decibel gain, the SNR reduces to 13.5 dB. To improve the SNR, either higher initial signal power or higher pump power is required [ l l ] . In this section, we will consider the cases of different signal power levels and pump power levels for which the corresponding gains may be higher than zero decibel. The cases of different signal wavelengths, pump wavelengths, and effective fiber cross sections are also considered. The results are useful for the design of DEDFA’s.
A. Dependence of the Signal Wavelength
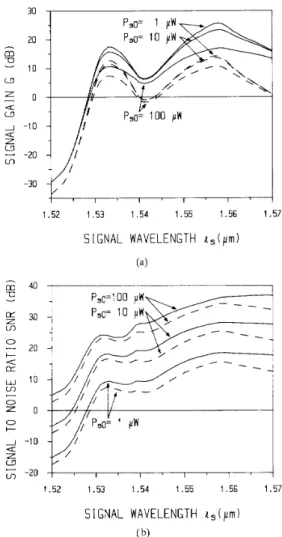
Fig. 5(a) and (b) shows the gain and SNR of the DEDFA versus the signal wavelength, respectively, for different initial signal powers. In Fig. 5(a) and 5(b), the case without SRS is also shown for comparison. In the figures, the pump wavelength is 1.48 pm, the initial pump power is 75 mW, and the effective fiber cross section is 35 pm2. It is seen that both the gain and SNR are enhanced for all the considered wavelength range. The SNR increases as the initial signal power, but the gain decreases as the initial signal power increases because of the gain saturation. There are two gain peaks near the wavelengths 1.534 and 1.557 pm. For the SNR, the two peaks are not so obvious.
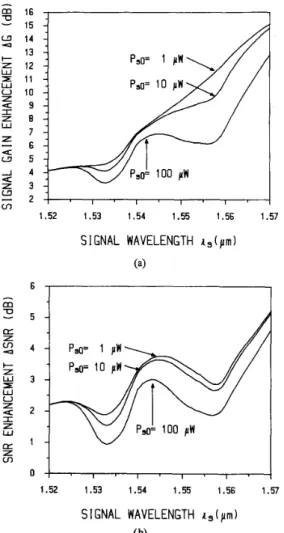
The corresponding enhancements of the gain and SNR shown in Fig. 5(a) and (b) are given in Fig. 6(a) and (b), respectively. Because the Raman gain increases with the wavelength in the considered wavelength range, the enhance- ments of the gain and SNR, basically, follow the Raman gain profile except there are concavities of the profiles near the wavelengths 1.534 and 1.557 pm. It is noticed that there are gain peaks near the two wavelengths and the enhancements near the two wavelengths are less than the enhancements at the wavelengths of lower gains due to the gain saturations. The enhancements of the gain and SNR decreases as the initial signal power increases and this is also due to the gain saturation. The value in the concavities of the profiles near 1.534 pm for the case with 1-pW initial signal powers will become negative if the initial pump power is higher than about 250 mW, i.e., the SRS decreases the gain and SNR. For higher initial signal power, the initial pump power to make the enhancements of the gain and SNR negative is even higher. B. Dependence of the Initial Pump Power
In [11], it is shown that both the gain and SNR increase with the initial pump power. The results are recalculated with the same parameters as in the [ I l l except the absorption and emission cross sections now given in Fig. 1. Fig. 7(a) and (b) shows the gain and SNR of the DEDFA versus the initial pump power, respectively, where the signal wavelength is 1.55 pm, pump wavelength is 1.48 pm, and the effective fiber cross section is 35 pm2. In Fig. 7(a) and (b), the case without SRS is also shown for comparison. It is seen that both the gain and SNR with SRS are larger than the gain and SNR without SRS. For both the cases with SRS and without SRS, the gain
30 I 20 a a U -10 z 1.52 1.53 1.54 1.55 1.56 1.57 S 1 GNAL WAVELENGTH is ( p m ) (a) 1.52 1.53 1.54 1.55 1.56 1.57
S
1 GNAL WAVELENGTH ig ( pm) ( b) Fig. 5. fordifferent initial signal power P,o. The pump wavelength A, = 1.18 pm, initial pump power P,,o = 7’5 mW, fiber length L = 100 km and erbium ions density i > t = 1 x 10”rn-”. The cases with and without SRS are shown by the solid and dashed lines, respectively.
(a) Signal gain C: and (b) SNR versus the signal wavelength
and SNR increases as the initial pump power and saturate when the initial pump power is larger than about 80 mW. Because the slope of the gain curve with SRS is larger than that without SRS in saturation region, the gain enhancement due to SRS is more significant for higher pump power. As to the dependence of the initial signal power, gain decreases as the initial signal power increases but the SNR increases as the initial signal power. From the figures, the required initial pump power for the zero dB gain are around 55 mW for the case with SRS and the corresponding SNR’s are 3.6, 13.4, and 23.2 dB for Pso = I, 10, and 100 p W , respectively. For the case of low initial signal power, higher initial pump power is required to improve the SNR. However, for the initial pump power higher than about 90 mW, the SNR increases only slightly due to the saturation. The saturation SNR at 90-mW initial pump power is 18.1, 27.8, and 35.7 dB for
PSo = 1, 10, and 100 pW, respectively. It is found that, for the system with the requirement of the SNR higher than 20 dB, the initial signal power should be higher than 1.6 pW.
1874 JOURNAL OF LIGHTWAVE TECHNOLOGY, VOL. 10, NO. 12, DECEMBER 1992
-
16 15 v 14 13 4 c 2 12 W ZE 1 1 W 0 10 z I Z 8 7 W 5 6 U w 5 1 4 a a 9 cnE
:
;
I
1.52 1.53 1.54 1.55 1.56 1.57 SIGNAL WAVELENGTH r , ( pm 1 (a)-
m -0 I- z W =E W 0 z I z w a [L z U7 1.52 1.53 1.54 1.55 1.56 1.57 SI
GNAL WAVELENGTH i s ( pm 1Fig. 6. (a) Signal gain enhancement A G and (b) SNR enhancement A S N R
versus the signal wavelength A, shown in Figs. 5(a) and 6( b), respectively.
( b)
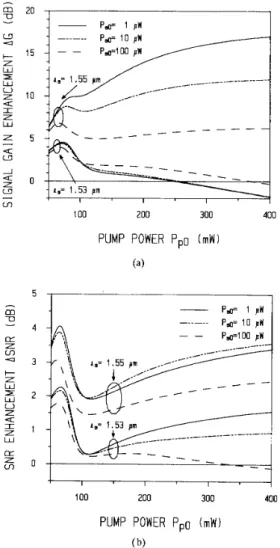
The enhancements of the gain and SNR due to SRS in Fig. 7(a) and (b) are shown in Fig. S(a) and (b), respectively. In Fig. 8(a) and (b), the case of 1.53-pm signal is also shown as the initial pump power is increased up to 400 mW. For the 1.55-pm signal, as the initial pump power increases, the enhancements of the gain and SNR increases until the initial pump power reaches near the saturation power. For the initial pump power around the saturation power, the enhancements decreases as the initial pump power increases. As the initial pump power further increases, the enhancements increases thereafter. It is noticed that the enhancements are significant even for the 50-mW initial pump power. The 50-mW initial pump power is only one third of the comparable pump power shown in the last section. For the 1.53-pm signal, the amount of the enhancements are smaller than the case of 1.55-pm signal because the wavelength difference between the signal wavelength and pump wavelength is smaller and hence the Raman gain is smaller. Furthermore, the dependences of the enhancements on the initial pump power are different for the cases of the 1.53- and 1.55-pm signals for high initial pump power. In the case of 1.53-pm signal shown in Fig. B(a), as
m ’D a
z
a w - l o ’ I . I I , I . I I ( I I I I 50 100 150 200PUMP POWER Ppo (mW)
(a)
-
m
? I U 40 [L z v) 0 30 I + U [L W Z v) 0 z + 0 l o P,o= 100 yw- - -
50 100 150PUMP POWER Ppo (mW)
(b)
Fig. 7. (a) Signal gain G and (b) SNR versus the initial pump power PPo for different initial signal power PSo. The signal wavelength A, = 1.55 pm,
the pump wavelength A, = 1.48 pm, fiber length L = 100 km and erbium ions density nt = 1 x 10²*me3. The cases with and without SRS are shown by the solid and dashed lines, respectively.
the initial pump power increases beyond the saturation power, the gain enhancement decreases as the initial pump power increases. It is found that the gain enhancements become neg- ative when the initial pump powers are larger than 250, 258, and 372 mW for the cases of 1, 10, and 100-pW initial signal powers, respectively. In Fig. 8(b), for the case of 1.53-pm signal, the SNR enhancements of the cases with 10 and 100 pW initial powers increase as the initial pump power in the high pump power region, but SNR enhancement for the case of 1-pW initial power becomes negative for the initial pump power larger than 337
p W .
However, because of the saturation of the gain and SNR shown in Fig. 7(a) and (b), it is unpractical to use such a high initial pump power.C . Dependence of the Pump Wavelength
From the previous results, the SRS enhances both the gain and SNR when the pump wavelength is 1.48 pm. Because the Raman gain increases as the frequency difference be-
m 20
2
~ P& 1 pw P& 10 pw +" 1
z 15 - - P&lOO pwf
m U @z z cn + z W z W 0 z I z W z m-
Q a_ _ - -
K - -
100 200 300 400PUMP POWER P,o ( m W ) (a) - P& 1 P& 10 1w
_ _ - -
-
- - _
-
I I I 100 200 300 400PUMP POWER P,o (mW)
Fig. 8. (a) Signal gain enhancement AG and (b) SNR enhancement ASNR versus the initial pump power PPo shown in Figs. 7(a) and 6(b), respectively.
( b)
tween the signal and pump if the difference is within the 440 cm-' gain width, larger enhancements may be achieved with shorter pump wavelength. On the other hand, the gain from the pumped erbium ions depends on the emission and absorption cross sections of the pump wavelength. Shorter pump wavelength may not result in higher gain and SNR. To chose the optimal pump wavelength, both effects should be considered.
In this section, we consider the gain and SNR for three pump wavelengths of 1.47, 1.48, and 1.49 pm. Fig. 9(a) and (b) shows the gain and SNR versus the signal wavelength for the above three pump wavelengths, where the initial signal power is 10 pW, the initial pump power is 75 mW and the effective fiber cross section is 35 pm'. In Fig. 9(a) and (b), the cases without SRS are shown for comparison. It is seen that, for the cases without SRS, the best pump wavelength X p b
among the three considered wavelengths is 1.48 pm for the gain and is 1.49 pm for the SNR for all the considered signal wavelengths. With SRS, the dependence of the best pump wavelength on the signal wavelength is more complicated.
1.53 1.54 1.55 1.56 1.57 S I GNAL WAVELENGTH (4 ( pm 1 1.53 1.54 1.55 1.56 1.57 SIGNAL WAVELENGTH ig ( g m ) ( b)
Fig. 9. (a) Signal gain enhancement G and (b) SNR versus the signal wavelength A, for different pump wavelength A,. The initial signal pump
power P,o = 10 p W , initial pump power P,o = 75 mW, fiber length
L = 100 km and erbium ions density nt = 1 x 10²²m-3.
When the signal wavelength is shorter than 1.539 pm, the best pump wavelengths are the same as the cases without SRS. When the signal wavelength is longer, the gain and SNR are more enhanced for shorter pump wavelength. For 1.47-pm pump wavelength, which is the worst pump wavelength for the cases without SRS, it becomes the best pump wavelength for both the gain and SNR when the signal wavelength is larger than about 1.555 pm.
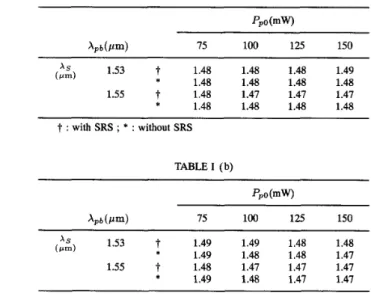
Tables I(a) and I( b) summarize the best pump wavelengths
X p b for the gains and SNR's of the 1.53- and 1.55-pm signals for the cases shown in Fig. 9(a) and (b) and the cases of higher initial pump powers. In Tables I(a) and I(b) the cases without SRS are also shown for comparison. From Tables I(a) and I(b), for the cases without SRS, the best pump wavelengths for the gain are all 1.48 pm and the best pump wavelengths for the SNR are shifted to shorter wavelength as the initial pump power increases. With SRS, for the case of 1.55-pm signal, the best pump wavelengths for both the gain and SNR are shifted to shorter wavelength as the initial pump power
1676 JOURNAL OF LIGHTWAVJZ TECHNOLQGY, VOL. 10, NO. 12, DECEMBER 1992
TABLE I (a)
THE B E ~ T WAVELENGTH A p b AMONG THE 1.47-, 1.48-, AND 1.49-pm PUMP WAVE-LENGTHS FOR (a) THE GAIN AND @) THE SNR AT THE SIGNAL WAVE-
WHERE THE OTHER NUMERICAL PARAMETERS ARE THE SAME AS THE CASES CONSIDERED IN FIG. 9(a) AND (b). BOTH THE CASES WITH
SRS AND WITHOUT SRS ARE SHOWN FOR COMPARISON. LENGTHS As = 1.53 AND 1.55 pm FOR SEVERAL INITIAL PUMP POWERS,
Apb(Pm) 75 100 125 150 (,,, ,,) A S 1.53 t 1.48 1.48 1.48 1.49 * 1.48 1.48 1.48 1.48 1.55 t 1.48 1.47 1.47 1.47 * 1.48 1.48 1.48 1.48 t : with SRS ; * : without SRS TABLE I (b) (elm) A S 1.53 t 1.49 1.49 1.48 1.48 * 1.49 1.48 1.48 1.47 1.55
t
1.48 1.47 1.47 1.47 * 1.49 1.48 1.47 1.47 t : with SRS ; * : without SRSincreases. The best pump wavelengths are also shifted to shorter wavelength to compare with the case without SRS.
As
to the case of 1.53-pm signal, the best pump wavelengths for both the gain and SNR are shifted to longer wavelengths to compare with the case without SRS. Although, the Raman gain is larger for shorter pump wavelength. Because the gain at 1.53 pm is small for the considered pump wavelengths, the effect of the depletion of the pump power due to the ASEN of long wavelength, which are with high Raman gain, may be significant. When the effect of the depletion due to the long wavelength ASEN is important, the longer pump wavelength for the short signal wavelength is preferred.D. Dependence of the Effective Fiber Cross Section
There are two areas considered in the DEDFA with SRS. One is the dopant area A, and the other is the effective fiber cross section A,. The smaller dopant area provides the higher gain from the pumped erbium ions. The smaller effective fiber cross section also provides higher optical power density and higher gain from the Raman effect. Both areas can be made smaller during the fabrication of the erbium-doped fiber, but the fiber of too small effective cross section is impractical. The dispersion, coupling and splice losses are serious problems for the fiber of too small effective cross section.
So far we only consider the cases with 3.14-pm2 dopant area and 35-pm2 effective fiber cross section. In this section, we will consider the dependences of the enhancements of the gain and SNR on the effective fiber cross section. Fig. lO(a) and (b) shows the enhancements of the gain and SNR, respectively, for the 3.14-pm2 dopant area and the effective fiber cross section varies from 5 to 60-pm2. In Fig. lO(a) and (b), we
-
m 20 E (3 I- 10 z W r W U z I z W Q a 05
a -10 U J U z tn E! -20 10 20 30 40 50 60EFFECT 1 VE F
I
BER CROSS-SECTI
ON A. ( ym2) (a)-
m U 10 z Ln 4 I- z W U z U I z -10 W oz z Lng
o
a,= 1.53 ,rm-
pc
6o''
P# 75 nW pc looI
- -
10 20 30 40 50 60EFFECT 1 VE F I BER CROSS-SECT 1 ON A. ( pm2)
(b)
Fig. 10. (a) Signal gain enhancement AG and (b) SNR enhancement ASNR versus the effective fiber cross section A, for different signal wavelength A, and initial signal power PB0. The pump wavelength A, = 1.48 pm, initial pump power PPo = 75 mW, fiber length L = 100 km and erbium ions density nt = 1 x 10²²m-3.
consider two cases with 1.53- and 1.55-pm signal wavelengths. The other parameters are 10-pW initial signal power, 1.48- pm pump wavelength and three different initial pump powers which are 60, 75, and 100 mW. From the figures, it is seen that, there exist the optimal effective fiber cross sections for the maximum gain and SNR. When the effective fiber cross section is small enough, the effect of the SRS is very significant and the pump power is seriously depleted due to the SRS and the gain from the pumped erbium ions is greatly reduced. To remember that the pumping efficiency of the SRS is in fact less than the pumped erbium ions, the gain from the SRS is no longer larger than the reduction of the gain from the pumped erbium ions in such a case. This effect leads to the decrement of the enhancement for small effective fiber cross section. On the other hand, as the effective fiber cross section is large, the effect of the SRS is reduced and the enhancements of the gain and
S N R
due to the SRS decrease. Therefore, there exists the optimal effective fiber cross section. However, theoptimal cross sections are all less than 20 pm2 and too small in practice. The practical cross-section range is from 35 to 50 pm2. It is seen that the variations of the enhancements of the gain and SNR in this range are small, especially for the enhancement of the SNR.
V. CONCLUSIONS
The effects of the SRS on the gain and SNR of the DEDFA of 100-km fiber length and bidirectional pumps are numerically studied. The signal is amplified by both the pumped erbium ions and the SRS. Although the gain from the pumped erbium ions is reduced by the SRS because part of the pump power is depleted by the SRS, it is found that the gain from the SRS is larger than the decrement of the gain from the pumped erbium ions. The total gain is enhanced by the SRS. Furthermore, the SRS also enhances the SNR. The evolution of the signal power, ASEN power, and pump power are shown. The effect of the gain enhancement is clearly shown in the evolutions of the gain coefficients from the pumped erbium ions and the SRS along the fiber. The enhancements are significant for practical parameters. For 1.55-pm signal and ~O-LLW initial signal power, there are 8.8-dB gain enhancement and 3.3-dB SNR enhancement for 1.48-pm pump wavelength and 75-mW initial pump power. The gain and SNR enhancements due to SRS are studied for the signal wavelength varied from 1.52 to 1.57 pm, signal power varied from 1 to 100 pW, pump wavelength varied from 1.47 to 1.49 pm, pump power varied from 50 to 350 mW, and effective fiber cross section varied from 5 to 60 pm2. The results are summarized as follows.
1) In the considered signal wavelength range and initial signal power range, both the gain and SNR are enhanced for 1.48-pm pump wavelength and 75-mW pump power. The enhancements increases as the signal wavelength except in the high gain regions near 1.534 and 1.557 pm where the enhancements are lowered due to gain saturation.
2) For 1.53- and 1.55-pm signal wavelengths, the gain and SNR increase with the initial pump power and saturate at about 80-mW pump power. Both the gain and SNR enhancements increase as the initial pump power when it is lower than the saturation pump power. For very high initial pump power, the gain and SNR may be decreased by the SRS for the case of 1.53-pm signal, e.g., for 1-pW initial signal power, the gain and SNR decrements occur for the initial pump power higher than 250 and 337 mW, respectively.
3) For the same initial signal power, the best pump wave- lengths of the gain and SNR depend on the signal wavelength and initial pump power. For the signal near 1.55 pm, the best pump wavelengths are shifted to shorter wavelength as the initial pump power increases. For the signal near 1.53 pm, the best pump wavelengths may not be shifted to shorter wavelength as the initial pump power increases due to the pump depletion by the long wavelength ASEN.
4) The gain and SNR enhancements increase when the effective fiber cross section decreases until the cross section reaches an optimal value. In practice, the optimal cross section is too small. For the effective fiber cross section smaller than
the optimal value, the enhancements decrease as the effective fiber cross section and become negative for too small a cross section.
REFERENCES
R. J. Mears, L. Reekie, I. M. Jauncey, and D. N. Payne, “Low-noise erbium-doped fiber amplifier operating at 1.54 pm,” Electron. Lett.,
K. Hagimoto et al., “250 km nonrepeatered transmission at 1.8 Gb/s using LD pumped Er”+-doped fiber amplifier in IM/direct detection system,” Electron. Lett., vol. 25, pp. 662-664, 1989.
H. R. D. Sunak, Bibliography on Erbium Doped Fiber Amplijiers: 1987
lo 1990.
C. A. Millier, “Joint tutorial: Active fiber amplifiers,” in Tech. Dig., Opt. Fiber Commun. Conf, OFC ’88, Opt. Soc. Amer., 1988, paper TuM2. P. Urquhart and T. J. Whitley, “Long span fiber amplifiers,” Appl. Opt., vol. 29, pp. 3503-3509, 1990.
J. R. Simpson et al., “Performance of a distributed erbium-doped dispersion-shifted fiber amplifier,” J . Linhtwave Technol., vol. 9,
vol. 23, pp. 1026-1028, 1987.
Kingston: EDFA Consultants, 1991.
pp.. 228-233, 1991.
A. Yariv, “Signal-to-noise considerations in the fiber links with periodic
or distributedoptical amplification,” Opt. Lett., vol. 15, pp. 1064- 1066, 1990.
C.R. Giles and E. Desurvire, “Propagation of signal and noise in catenated erbium-doped fiber optical amplifiers,” J . Lightwave Technol.,
D.N. Chen and E. Desurvire, “Noise performance evaluation of dis- tributed erbium-doped fiber amplifiers with bidirectional pumping at 1.48 pm,” IEEE Photon. Technol. Left., vol. 4, pp. 52-55, 1992. R. H. Stolen and E. P. Ippen, “Raman gain in glass optical waveguides,” Appl. Phys. Lett., vol. 22, pp. 276-278, 1972.
S. Wen and S. Chi, “Distributed erbium-doped fiber amplifiers with stimulated Raman scattering,” IEEE Photon. Techno. Lett., vol. 4, pp. 189-192, 1992.
R. I. Laming et al., “Efficient pump wavelengths of erbium-doped fiber optical amplifier,” Electron. Lett., vol. 25, pp. 12- 14, 1989. E. Snitzer, H. Po, F. Hakimi, R. Tumminelli, and B.C. McCollum, “Erbium fiber laser amplifier at 1.55pm with pump at 1.49pm and Yb sensitized Er Oscillator,” in Postdeadline Papers, Opt. Fiber Commun.
Conj, OFC ’88, Opt. Soc. Amer., 1988, paper 1988.
E. Desurvire, “Analysis of distributed erbium-doped fiber amplifiers with fiber background loss,” IEEE Photon. Technol. Lett., vol. 3,
B. J. Ainslie, “A review of the fabrication and properties of erbium- doped fibers for optical amplifiers,” J. Lightwave Technol., vol. 9, pp. 220-227, 1991.
C. R. Giles and E. Desurvire, “Modeling erbium-doped fiber amplifiers,” 1. Lightwave Technol., vol. 9, 271-283, 1991.
R. H. Stolen, J. P. Gordon, W. J. Tomlinson, and H. A. Haus, “Raman response function of silica-core fibers,” J . Opt. Soc. Amer. B, vol. 6, L. B. Jeunhomme, Single-Mode Fiber Optics. New York: Dekker, 1983,
p. 257.
L. F. Mollenauer, S. G. Evangelides, Jr., and H. A. Haus, “Long-distance soliton propagation using lumped amplifiers and dispersion shifted fiber,” J . Lightwave Technol., vol. 9, pp. 194-197, 1991.
vol. 9, pp. 147-154, 1991.
pp. 625-628, 1991.
pp. 1159-1166, 1989.
Senfar Wen was born on July 29, 1961, in Fengyuan, Taiwan, Republic of China. He received the B.S. degree in electro-physics, the M.S. degree
in electro-optical engineering, and the Ph.D. degree in electro-optical engineering, all from National Chiao Tung University, Taiwan, in 1983, 1985, and 1989, respectively.
In 1991, he joined the faculty of Chung-Hua Polytechnic Institute, where he is currently an Associate Professor of electrical engineering. His research interests are in the area of fiber and nonlinear optics.
1878
Sien Chi was born on July 6, 1936, in Huaiying, Jiangsu, China. He received the B.S.E.E. degree from National Taiwan University and M.S.E.E. de- gree from National Chiao Tung University, Taiwan, R.O.C., in 1959 and 1961, respectively. He received the Ph.D. degree in electrophysics from the Poly- technic Institute of Brooklyn, Brooklyn, NY, in 1971.
In 1971, he joined the faculty of National Chiao Tung University, where he is currently a professor of electro-optical engineering. From 1977 to 1978
he was a resident visitor at Bell Laboratories, Holmdel, NJ. From 1986 to
1987 he took a sabbatical leave to Hua Eng Wires and Cables, Taiwan, where he conducted research programs in fiber optics. His research interests are in the area of fiber and nonlinear optics.