Review
Wei-Lung Tseng1 Huan-Tsung Chang1 Su-Ming Hsu2 Ruey-Jien Chen3 Shiming Lin3 1Department of Chemistry 2Department of Pathology 3Center for OptoelectronicBiomedicine,
National Taiwan University, Taipei, Taiwan
Immunoaffinity capillary electrophoresis:
Determination of binding constant and
stoichiometry for antibody-antigen interaction
Affinity capillary electrophoresis (ACE) can provide both qualitative and quantitative information on molecular interactions and affords the advantages of very low sample consumption, high mass sensitivity, short analysis time, and the use of automated instrumentation. It has been applied clinically and biochemically to the determination of the binding constant and to the measurement of the binding stoichiometry for inter-actions between antibodies (Ab’s) and antigens (Ag’s) in free solution. In many situa-tions, the Ag molecule has two or multiple binding sites, each of which has a similar or different intrinsic affinity for binding independently to the combining site(s) on an Ab molecule. The multivalent binding reactions between Ab and Ag molecules often occur. The objective of this review is to describe the uses of ACE in the determination of bind-ing constants and stoichiometry of Ab-Ag interactions (immunoaffnity capillary electro-phoresis), focusing especially on multivalent Ab-Ag interaction modes. Five model binding systems developed recently using ACE techniques are described with princi-ples and examprinci-ples: (i) divalent monovalent Ag interaction, (ii) divalent mAb-(homo)polyvalent Ag interaction, (iii) cooperativity of two binding sites of mAb-mono-valent Ag interaction, (iv) monomAb-mono-valent Fab-dimAb-mono-valent Ag interaction, and (v) polyclonal Ab-monovalent Ag interaction. Finally, the determination of binding stoichiometry of Ab-Ag interactions by ACE is described.
Keywords: Affinity capillary electrophoresis / Antibodies / Antigens / Binding constant / Review
EL 4871
Contents
1 Introduction . . . 836
2 Slow Ab-Ag interaction kinetics . . . 838
2.1 Data analysis . . . 838
2.2 Examples . . . 839
3 Fast Ab-Ag interaction kinetics . . . 839
3.1 Divalent mAb-monovalent Ag interaction . . . 839
3.1.1 Data analysis . . . 839 3.1.2 Examples . . . 840 3.2 Divalent mAb-(homo)polyvalent Ag interaction . . . 840 3.2.1 Data analysis . . . 840 3.2.2 Examples . . . 841
3.3 Cooperativity of two binding sites of mAb . . . 841
3.3.1 Data analysis . . . 841
3.3.2 Examples . . . 842
3.4 Monovalent Fab-divalent Ag interaction . . . . 842
3.4.1 Data analysis . . . 842
3.4.2 Examples . . . 843
3.5 Polyclonal Ab-monovalent Ag interaction . . . 843
3.5.1 Data analysis . . . 844
3.5.2 Examples . . . 844
4 Determination of binding stoichiometry . . . 844
4.1 Data analysis . . . 845
4.2 Examples . . . 845
5 Concluding remarks . . . 845
6 References . . . 845
1 Introduction
The basic principles of Ab-Ag interaction are those of any biomolecular reaction. The binding of Ag by Ab can, in general, be described by the same theories and studied by the same experimental approaches as the binding of a hormone by its receptor, of a substrate by enzyme, or of oxygen by hemoglobin. There are several major differ-ences, however, between Ab-Ag interactions and these Correspondence: Dr. Shiming Lin, Centre for Optoelectronic
Biomedicine, National Taiwan University/College of Medicine, 1-1 Jen-Ai Road, Taipei, Taiwan
E-mail: [email protected] Fax:1886-2-23949125
Abbreviations: ACE, affinity capillary electrophoresis; dAg,
diva-lent antigen; DNP, N-(2,4-dinitrophenyl)amino; Fab, antigen-bind-ing fragment; hpAg, homopolyvalent antigen; HRV, human rhino-virus; IgG, immunglobulin G; mAB, monochonal antibody
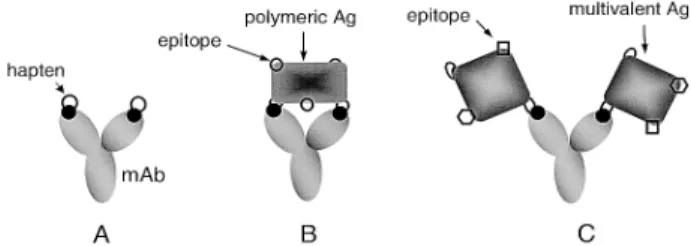
Figure 1. Schematic diagram depicting the interaction of mAb with haptens or Ag’s. (A) mAb binding to two sepa-rate homologous haptens. (B) Bivalent binding of mAb to polymeric Ag. (C) mAb binding to multivalent Ags.
other situations. First, unlike most enzymes and many hormone-binding systems, Ab-Ag interactions are non-covalent interactions and therefore reversible. Second, antibodies can be raised, by design of the investigator, with specificity for almost any substance known. In each case, one can find Ab’s with affinities as high as and spe-cificities as great as those of enzymes for their substrates and receptors for their hormones. The interaction of Ab with Ag can thus be taken as a prototype for interactions of macromolecules with ligands in general.
The quantitative aspects of the interaction of Ab and Ag can be studied by the use of a variety of methods which utilize either thermodynamic or kinetic approaches. At equilibrium, the binding constant or affinity of Ab-Ag reac-tion may be expressed as: K = [AbAg]/[Ab][Ag], where Ab represents free antibody sites, Ag the free antigen and AbAg the antibody-antigen complex. It should thus be possible to study the interaction kinetics of this re-action by conventional techniques involving addition of reactants, mixing and the subsequent determination of the concentration of the reactants or products at time inter-vals thereafter. Unfortunately, this simple type of approach is not suitable for the study of the reaction between Ab and complex multivalent Ag. One monoclonal antibody (mAb) molecule, immunoglobulin G (IgG), has two identical
com-bining sites and can combine with two separate homolo-gous hapten molecules (Fig. 1A), with two identical anti-genic determinants (epitopes, the regions of an Ag that bind to an Ab) on one polymeric Ag molecule (Fig. 1B), or with separate epitopes on two Ag molecules (Fig. 1C). From the application of the law of mass action to the Ab-Ag reaction, a variety of methods have been developed which facilitate experimental calculations of binding con-stants for the interaction between divalent Ab and multi-valent Ag. However, of the various existing methods for estimating the binding constant, most demand radioac-tive labeling (e.g., ammonium sulfate precipitation, radio-immunoassay) or chromophoric characteristics of the interacting compounds (e.g., fluorescence quenching, fluorescence enhancement), and these methods may require secondary reagents with an additional immobiliza-tion process (e.g., ELISA, immunosensor) for measure-ment at the liquid-solid interface. Capillary electropho-resis (CE) has recently become a tool for characterizing the molecular interactions in free solutions. This method not only affords the advantage of small capillary dimen-sions, leading to high mass sensitivity and reduced con-sumption of expensive affinity proteins or ligands, but also allows efficient separation and reproducible quantifi-cation by on-line detection of unlabeled components in the free solution rather than at the liquid-solid interface. The use of CE for the measurement of binding parameters for protein-ligand interactions has been reported [1–5], and several efforts have been made to use CE for ob-serving Ab-Ag complex formation [6, 7], analyzing Ab’s by affinity assays [8–12], or measuring the binding con-stant for slow Ab-Ag interaction [13–17].
Affinity capillary electrophoresis (ACE), a newly devel-oped technique based on CE, has recently been intro-duced for the study of fast molecular interaction kinetics and the evaluation of binding constants for Ab-Ag interac-tions in free solution [18–26] (Table 1). In these reports, the
Table 1. Molecule interactions where equilibrium constants have been determined by mobility-shift analysis Stoichiometry
(Ag : Ab)
Interaction systems Ref.
1 : 1 mAb against a negative charge ligand, phosphotyrosine [18]
1 : 1 mAb specific to a double-stranded 32-mer oligonucleotide and a single-stranded oligonucleotide [19] 1 : 2 mAb fragment specific to a divalent antigen, an 18-mer diphosphotyrosine peptide [20] 1 : Poly mAb against phosvitin, a phosphoprotein phosphorylated on the multiple-site serine residues [21] 2 : 1 Charge ligands containing DNP groups to bivalent monoclonal rat anti-DNP [22]
2 : 1a) Monoclonal anti-HSA and HSA [24]
2 : 1a) Monoclonal anti-BSA and BSA [25]
28 : 1a) A nonaggregating Ab (mAb 8F5) and HRV2 [26]
60 : 1a) Monovalent human very-low-density lipoprotein receptor encompassing repeats 2 and 3 and HRV2 [26]
Poly : 1 Polyclonal Ab specific to a hapten, DNP [23]
a) Ag attaches to n equivalent epitopes with equal affinity.
CE
and
simpler anti-(hapten)-hapten interaction can be suffi-ciently described by a 1:1 stoichiometry. However, the determination of the binding constant of anti-protein Ab is complicated by the multivalence (multiple epitopes) of the protein Ag. When the Ab is monoclonal, aggregates will not come up for a monomeric protein Ag. For homo-polymeric protein Ag; however, aggregates can be formed depending on conditions. The problem of aggre-gation can be minimized by the use of a very low concen-tration of reactants or by performing the determination with an Ag excess [21]. In addition, in some situations, the Ag has two or multiple binding sites, each of which has a similar or different intrinsic affinity for binding inde-pendently to each of two identical combining sites on a Ab (IgG) molecule [20, 27, 28]. It is not always easy to determine each of the intrinsic affinity. The problem of the heterogeneity of affinity of multivalent Ag’s still remains an obstacle to meaningful interpretation of data obtained. This review starts with the analysis of slow Ab-Ag interaction kinetics by CE and follows with an in-depth description about the quantitative expression and evalua-tion of binding constants for fast Ab-Ag interacevalua-tion kinetics by ACE, with particular emphasis on the non-cooperativity and non-cooperativity of two binding sites on the divalent monoclonal Ab.
2 Slow Ab-Ag interaction kinetics
For slow on-and-off kinetics, i.e., the half time of the AbAg complexes is long compared with the time for the electro-phoresis, and the reactants are generally preincubated prior to CE analysis (Figs. 2A, B). To determine the binding constant for slow Ab-Ag interaction, one generally
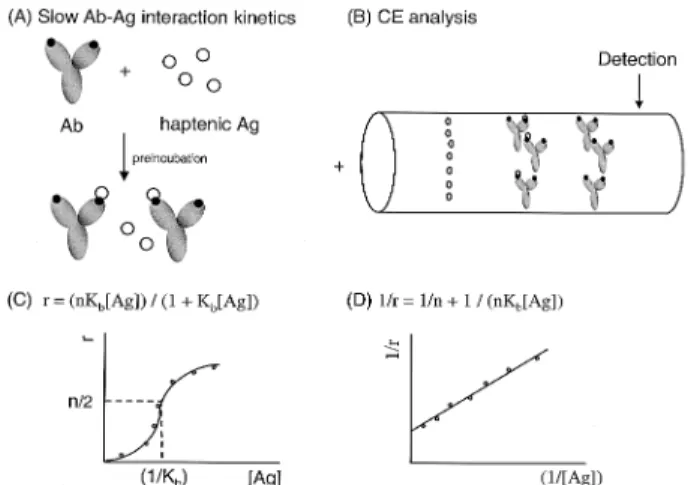
deter-Figure 2. Principle of CE-based binding studies for slow interaction kinetics of divalent Ab with haptenic Ag according to the peak area-change analysis. (A) Pre-incubation prior to CE analysis. (B) Schematic representa-tion of CE running. (C), (D) Data analysis (for details, see section 2.1).
mines the equilibrium concentrations of bound and free Ag, at increasing total Ag concentrations, but at constant Ab concentration. In this case, CE is simply a tool to sepa-rate and quantitate bound and free species. The reactants of different ratios of Ab’s and Ag’s are generally preincu-bated followed by electrophoretic separation of free from complexed AbAg molecules. Peaks corresponding to free Ag in a series of incubation mixtures are integrated, and binding curves of bound Ag as a function of free or total offered Ag or the bound/free ratio as a function of bound Ag can be constructed subsequently on the basis of cali-bration curves of known amounts of Ag [13–17]. Alterna-tively, one can vary the Ab concentration, but then the analysis is slightly more complicated.
2.1 Data analysis
In the case of slow on-and-off Ab-Ag interaction kinetics, the following form of the Langmuir adsorption isotherm may be drived [29]:
b/[Ab]o= r = (nKb[Ag])/(11Kb[Ag] (1) where b is the concentration of bound Ag, [Ab]ois the total concentration of Ab, n is the number of binding sites of Ab (Ab valence), r is the total fraction of Ag (hapten) bound per mole of Ab (0# r # n), [Ag] is the free hapten concen-tration, and Kb is the equilibrium constant for a single binding site (Fig. 2C).
The following equation is known as the Langmuir equation:
1/r = 1/(nKb[Ag])11/n (2)
Therefore, a plot of (1/r) versus 1/[Ag] over a range of free hapten concentration allows values of antibody affinity (Kb) and antibody valence (n) to be derived (Fig. 2D). For divalent anti-hapten Ab (n = 2 for IgG) this equation can be used to calculate the average intrinsic equilibrium con-stant of the Ab for the hapten. When half the Ab binding sites are bound (r = 1), Kbis equal to the reciprocal of the free hapten concentration at equilibrium.
The advantage of applying this relationship to calculate the equilibrium constant is that the result is not affected by the changes in electroosmotic flow and electrophore-tic mobilities of the free or bound antigens. However, a particular attention should be paid on the constant injection volume and reproducible peak area. In addition, another particular attention should be paid if the Ag is multivalent and can bind more than one Ab binding site; then Eq. (2) is valid only in Ag excess where the frequency of Ags with more than one Ab bound is very low. In this section, we are discussing only monovalent Ag’s (e.g., hapten) applied in CE, but this proviso must be kept in mind when the Scatchard or Langmuir analysis is applied in other CE circumstances.
2.2 Examples
We reported the use of a monoclonal anti-phosphoserine Ab against a negatively charged hapten, phosphoserine, as a model system to demonstrate the feasibility for the determination of the high (slow off-rates) Ab affinity in the free solution based on the change in peak areas of detect-able and quantitatively recoverdetect-able haptens [13]. The slow Ab-Ag interaction kinetics led to band broadening and resulted in far lower efficiency of the separation of complexed Ab from unbound Ab (Fig. 2). However, when the run-to-run reproducibility of free phosphoserine was examined, it was found that it can be recovered quantita-tively under the conditions of the electrophoresis. On the basis of measurement of peak areas at different phospho-serine concentrations, the association constant was esti-mated (Kb= 5.216105 M–1). The method is generally use-ful for the study of monoclonal antibody-hapten interac-tion where the kinetics is slow and where the charge/ mass ratio of the unbound Ag differs from that of the com-plexed molecule.
3 Fast Ab-Ag interaction kinetics
Fast Ab-Ag interactions kinetics commonly characterized by a relatively short lifetime of the Ab-Ag complexes can be analyzed by ACE [18, 30–37] of one component (Ab) in the presence of the other component (Ag) added to the background electrolyte. Since the ACE was introduced by Chu and Whitesides in 1992 [30], ACE has been wide-spread in many fields and used for the study of Ab-Ag interactions and the evaluation of binding constants in free solution [18, 19–26] (Table 1). The basic principle lies in the measurement of a changed electrophoretic mobility (migration shift) of the complex as compared to that of free species. When the on-and-off rates of Ab-Ag inter-actions are sufficiently fast compared with the time of the electrophoresis, all Ab molecules will participate in approximately the same number of complexes for the same amount of time, i.e., there is a dynamic equilibrium between the complexed and noncomplexed species which have different electrophoretic velocities. The result-ing migration time will therefore change without change in peak shape. Estimation of binding constants for Ab-Ag interactions on the basis of migration shifts is then feasible.
3.1 Divalent mAb-monovalent Ag interaction Interactions between divalent mAb, IgG, and monovalent Ag can be either cooperative (Section 3.3) or noncoop-erative (Sections 3.1 and 3.2): the binding at one site may or may not influence binding at another site. If the
combining sites on the mAb are independent (i.e., display no positive or negative cooperativity for Ag binding), then for many purposes one can treat these combining sites, reacting with monovalent ligands, as if they were separate molecules. Thus, many, but not all, of the properties we shall discuss in the following two sections (Sections 3.1 and 3.2) can be analyzed in terms of the degree of satura-tion of the binding sites of mAb, independent of the num-ber of such sites per mAb molecule (2 for IgG). On the other way, the simplest case in mAb-Ag interactions is that of the interaction of mAb with monovalent ligand. One may include in this category both anti-hapten mAb’s reacting with truly monovalent haptenic antigens, and anti-monomeric protein mAb’s, which have been fractio-nated to obtain a population that reacts only with a single, nonrepeating site on the monomeric protein Ag. In the latter case, the Ag behaves as if monovalent in its inter-action with the particular Ab population under study. The proviso that the site recognized (antigenic determinant) be nonrepeating, i.e., occur only once per Ag molecule, is critical.
3.1.1 Data analysis
The binding constant is commonly calculated from the shift of the electrophoretic mobility of the free or bound Ab (Fig. 3). The electroosmotic flow (EOF) change can be compensated and, thus, it is not necessarily constant. However, several possible factors affecting EOF have been well addressed, including protein adsorption on the capillary wall, Joule heating, pH change, etc. [38]. To improve the accuracy, the injected sample generally
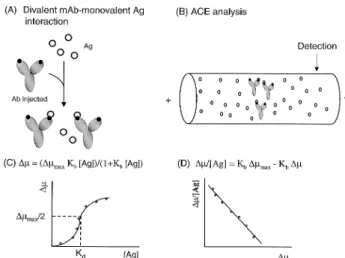
con-Figure 3. Principle of ACE-based binding studies for the interactions of divalent Ab’s with monovalent Ag’s according to the migration-shift analysis. (A) The separa-tion buffer is filled with Ag prior to Ab injecsepara-tion. (B) Sche-matic representation of ACE running. (C), (D) Data analy-sis (for details, see Section 3.1.1).
tains a neutral internal standard. The correlated electro-phoretic mobility (Dm) of the Ab can then be calculated from Eq. (3):
Dm = LtLd/V [(1/tAb1Ag) – (1/tN1Ag)] – [(1/tAb) – (1/tN)] (3) where Ltand Ldis the total length and effective length of the capillary, respectively, V is the voltage across the capillary, tAb1Ag and tN1Ag are the measured migration time of the antibody, and the neutral internal standard in the presence of antigen concentration, and tAband tNare the measured migration time of the antibody and the neu-tral internal standard in the absence of the Ag. Once the electrophoretic mobilities are corrected, a plot ofDm/[Ag]
versusDm is depicted, revealing a straight line with slope
(–Kb) and intercept (KbDmmax) based on Eq. (4) [39]:
Dm/[Ag] = KbDmmax– KbDm (4)
where [Ag] is the concentration of Ag in the running buffer, Dmmaxis the mobility of the Ab when it is saturated with the Ag, andDm is the change in the electrophoretic mobility of the AbAg complex in the presence of various concentra-tions of the Ag.
3.1.2 Examples
Heegaard [18] used a mAb (anti-phosphotyrosine) against a negatively charge Ag (hapten), phosphotyrosine, as a model system to test the use of ACE for the study of Ab-Ag interaction. Monoclonal anti-phosphotyrosine Ab with sufficiently fast interaction kinetics to be amenable to binding constant determination by this migration-shift method was used. On the assumption that the combining sites on the Ab are independent and identical, micromolar dissociation constants were calculated from the mea-surement of migration shift in the presence of various concentrations of the hapten. They also showed similar method for determination of dissociation constants be-tween monoclonal Ab and DNA by migration-shift im-muno-ACE method [19]. By ACE it was shown that the binding of the monoclonal anti-DNA Ab to DNA is highly dependent on the ionic strength conditions and that the binding is pH-dependent with a decrease in the dissocia-tion constant when decreasing the pH. The dissociadissocia-tion constant estimated for the Ab binding of a single-strand 32-mer oligonucleotide was 0.62mMat pH 7.90.
3.2 Divalent Ab-(homo)polyvalent Ag interaction
So far, we have discussed only situations in which the Ag is monovalent, or effectively monovalent with respect to the particular mAb under study. However, in many
situa-tions the protein Ag has multiple repeating identical antigenic determinants (eptitopes) [21], as in the case of homopolymers, each of which can bind independently to the identical combining sites on a divalent mAb (Fig. 1B). The determination of binding constant for anti-protein mAb will be complicated by the multivalence (multiple epitopes) of the Ag. Although the intrinsic affinity for the interaction of any single mAb combining site with any single epitope may be the same, the apparent or effective affinity may be much higher, due to the ability of a single mAb molecule to bind more than one identical epitope of an Ag molecule.
3.2.1 Data analysis
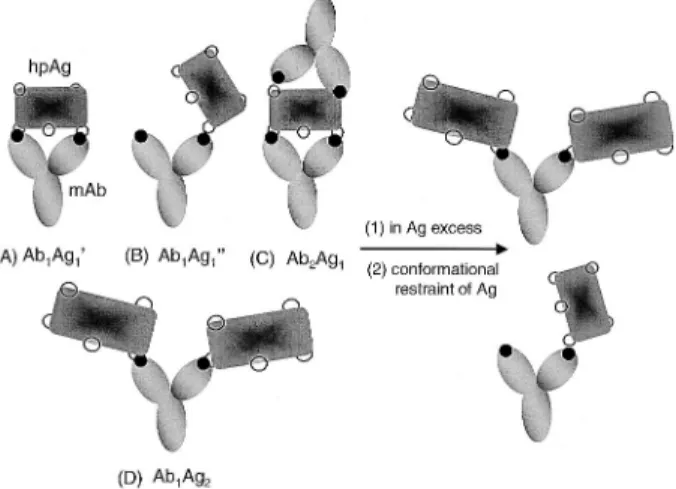
One can assume that the two combining sites of a diva-lent mAb, IgG, are equivadiva-lent and neither is affected by events at the other. A divalent anti-(homopolyvalent pro-tein) mAb can therefore be regarded as a monovalent molecule. The determination of the binding constant of a monovalent mAb is complicated by the homopolyvalence (multiple identical epitopes) of the Ag; however, in Ag excess, the effect of the multiplicity of epitopes can be reduced (Fig. 4). Under these conditions, the likelihood of both mAb molecules binding to a single Ag molecule (Fig. 4C, Ab2Ag1) will be minimal. At the concentration of Ag around Kd, the presence of 1:1 complexes as Ab1Ag1’ (Fig. 4A) or as a singly bonded species Ab1Ag1” (Fig. 4B) can not be neglected. However, some conformational restraint of Ag may inhibit the divalent interaction in the complex Ab1Ag1’ (Fig. 4A) but the complex Ab1Ag1”
Figure 4. Scheme of the binding of divalent mAb to hpAg’s. (A) One mAb molecule binding to two separate identical epitopes on an hpAg to form an Ab1Ag1’ com-plex. (B) One mAb molecule binding to one epitope on an hpAg to form an Ab1Ag1” complex. (C) One hpAg bound by two mAb’s on separate epitopes (Ab2Ag1 com-plex). (D) One mAb molecule binding to separate epitopes on two hpAg’s (Ab1Ag2complex).
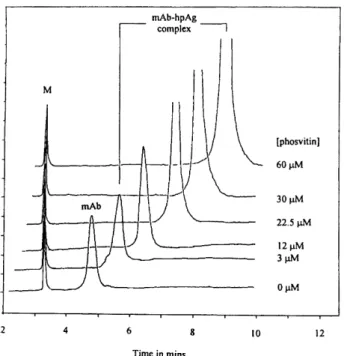
Figure 5. Evaluation of phosvitin binding to monoclonal anti-phosphoserine antibody by ACE. Peaks: M, internal peptide marker; mAb, free monoclonal phospho-serine antibody; mAb-hpAg complex, monoclonal anti-phosphoserine antibody complexed with homopolyvalent phosvitin antigen (hpAg). Buffer, 65 mMboric acid, 15 mM sodium tetraborate (pH 8.3) containing mAb with phosvi-tin concentrations ranging from 0 to 60mM; CE apparatus, Beckman P/ACE 5500; uncoated capillary, 57 cm (50 cm effective separation length)675 mm ID; sample, mixture of mAb (0.3mM) and peptide marker (0.33 mM) pressure-injected at 5 s; absorbance, UV 200 nm; temperature, 227C; operating voltage, 15 kV. Reprinted from [21], with permission.
(Fig. 4B) linked by monovalent interaction should still exist. In that case, the situation is the same as that treated in Section 3.1 and Eq. (4) is valid for the analysis.
3.2.2 Examples
We used ACE to study the interaction of a divalent anti-phosphoserine mAb to a homopolyvalent antigen (hpAg), phosvitin [21]. A model system, which allows the mea-surement of the true dissociation constant in Ag excess based on measurement of migration shifts of mAb-hpAg complexes at different Ag concentrations in solution, was presented for the study of the interactions between an Ab and an Ag that have identical determinants. The Ab com-plexed with phosvitin moved much more slowly than the free Ab because phosvitin (pI 2.1) exhibits more negative charge than Ab (pI 6.8, 7.6) at pH 8.3 buffer (Fig. 5). When a 1– to 40-fold concentration of Ag over Ab binding sites was conducted with this Ab, no linear plot was
Figure 6. Equilibria involved in Ab-Ag interactions. K1is the dissociation constant between the single occupied Ab and the occupied Ab. K2 is the dissociation constant between the double occupied Ab and the single occupied Ab. The degree of cooperativity between K1 and K2 is denoted asa. The relationship between K1, K2and K is based on the number of sites available for association and dissociation events. Adapted from [22].
observed. However, at large Ag excess (50– to 200-fold concentration excess), a linear plot was obtained. The experimental value of Kd (22.4 mM) obtained by ACE was also shown to be in close agreement with the value (17.8 mM) obtained by the conventional immunoassay based on indirect competition enzyme-linked immuno-sorbent assay.
3.3 Cooperativity of two binding sites of divalent mAb
There were several reports of positive cooperativity between the binding sites of Ab that bind monovalent Ag [40–42]. Cooperativity would yield a curved plot in Scatchard analysis, and values for two dissociation con-stants are not readily extracted from such a plot. Scatch-ard analysis, which was acceptable in a monovalent system by ACE as discussed in Sections 3.1 and 3.2, is thus not useful for a divalent system.
3.3.1 Data analysis
Mammen and co-workers [22] defined two dissociation constants, K1and K2, for the complex between divalent Ab (IgG) and two haptenic Ag’s [22]. When intermediate concentration of the Ag is present, divalent Ab exist in three forms: unoccupied (Ab), singly occupied (AbAg), and doubly occupied (AbAg2) (Fig. 6). In this system, they
assume that the dissociation rates (koff) are sufficiently fast (4 0.1 s–1) that they observed a concentration-weighted average electrophoretic mobility for all three species, i.e., one peak at all concentrations of Ag was detected. The electrophoretic mobility, melectro, is the weighted mobility of all three species.
melectro= ([Ab]/C)m
Ab1([AbAg]/C)mAbAg1([AbAg2]/C)mAbAg2 (5)
C = [Ab]1 [AbAg] 1 [AbAg2] (6) When the two binding sites are identical and noncoopera-tive, Scatchard analysis of values ofmelectroyield a straight line. In all other cases (positively or negatively cooperative binding), Scatchard plots are curved. As it is difficult to detect curves in a Scatchard plot, they derive a form anal-ysis (Eq. 7) which yields both values of K1and K2. [melectro–0.5(m
AbAg21mAb)[Ag]]/(melectro–mAb)
= [(mAbAg2–melectro)[Ag]2/(melectro–mAb)]61/K2– K1 (7) Plotting the left-hand side of Eq. (7) against the coefficient of the term 1/K2gives a line with a slope equal to 1/K2and a y-intercept equal to –K1.
3.3.2 Examples
Mammen and co-workers [22] chose charge ligands containing N-(2, 4-dinitrophenyl)amino (DNP) to divalent monoclonal rat anti-DNP, as a model for determination of the two dissociation constants of the AbAg complex. In this paper, 3-quinuclidinopropanesulfonate and K2SO4 were used to minimize the adsorption of the protein on the capillary wall. The valuemelectroof anti-DNP changed by increasing the concentration of the ligand. However, the value ofmelectroof two proteins standards, bovine carbonic anhydrase anda-lactalbumin, did not change significantly due to interactions with ions in the running buffer. They assume that the maximum value of Dmelectro for the singly occupied Ab is half of that of the occupied one,
i.e., (mAbAg–mAb) = 0.5 (mAbAg2–mAb). By using Eq. (7) to analyze the values of melectro of the Ab as a function of the concentration of ligand in the running buffer, they obtained values of both K1and K2and found that K2/K1 was& 4, and thus concluded that binding of Ab to ligands was noncooperative. This analysis method developed in this paper is more useful than Scatchard analysis for certain multivalent systems where cooperativity of bind-ing is in question, but where it is also possible to make plausible assumptions about electrophoretic mobilities of protein and protein-ligand complexes. Thus, the ab-sence of cooperativity can also be presented by a good fit of experimental data to Eq. (4), which is valid for the analysis of the interactions between bivalent binding pro-teins and haptenic ligand without cooperativity.
3.4 Monovalent Fab-divalent Ag interaction In many situations [27, 28], the ligand molecule has two or multiple copies of epitope, each of which has a similar or different intrinsic affinity for binding independently of the only combining site on a receptor molecule. The multiva-lent binding reactions between two molecules often occur in the Ab-Ag interactions. The antigen-binding fragment (Fab) from its monoclonal IgG preparation is monovalent. Antigens can be di- or multivalent either because they contain two or multiple copies of the same epitope [43]. It is not always easy to determine each of the intrinsic affi-nities or to predict the effects of di- or multivalency either by the use of ACE [21] or immunochemical methods [44] or by the kinetic analysis with biosensors [45]. However, although Ag’s show a heterogeneity of affinity, determina-tion of the average affinity (the average value of these intrinsic affinities) at equilibrium is helpful for supplying information on understanding the quality of Ab molecules and the binding characteristics of Ab to di- or multivalent Ag in solution [46–48].
3.4.1 Data analysis
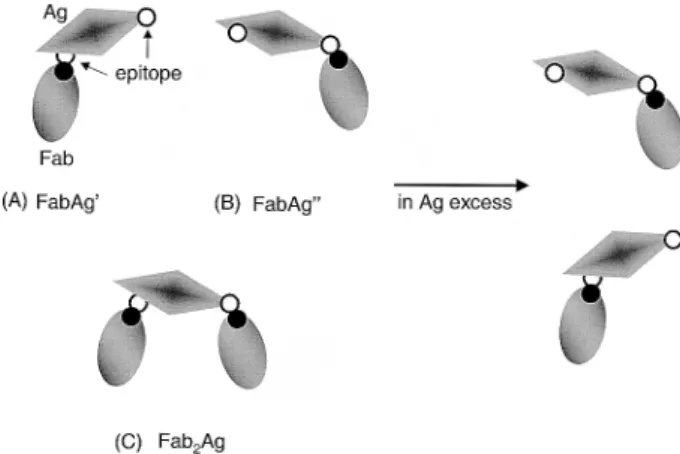
A monovalent Fab from its monoclonal IgG preparation has a binding site which can combine with any of two same epitopes on the divalent Ag (dAG) (Figs. 7A and B). Alternately, the two epitopes on an Ag molecule can react with the Fab molecule, respectively (Fig. 7C). However, at a high degree of Ag excess, the Fab2Ag complex shown in Fig. 7C may not exist, based on statistical
considera-Figure 7. Schematic illustration showing the interactions of monovalent Fab molecule with its dAg which has two copies of epitopes. The Fab molecule can combine with one of two epitopes on the Ag. (A) One of two epitopes located on one Ag binding to the combining site of Fab to form FabAg’ complex. (B) Another of two epitopes on the Ag binding to the combining site of Fab (FabAg” com-plex). (C) Two separate Fabs combining with separate epitopes on one Ag.
tions [49–51]. At equilibrium, free Ag, free Fab, FabAg’ complex, and FabAg” complex will exist in the free solu-tion. In Ag excess [20], Eq. [3] can be rearranged to give Eqs. (8) and (9):
Dm1/Dm1max= K1[Ag]/(11K1[Ag]) (8) Dm2/Dm2max= K2[Ag]/(11K2[Ag]) (9) Equation (8) plus Eq. (9) become
(Dm1max/Dm1)1(Dm2max/Dm2) = (Kd11Kd2)(1/[Ag])12 (10) where Kd1and Kd2the reciprocals of the association con-stants K1and K2, respectively, are the dissociation con-stants of the Fab for both epitopes on the Ag molecule, respectively. It is proposed that the FabAg’ complex has the same electrophoretic mobility (m1) as that of the FabAg” complex (m2), i.e.,
Dm1max/Dm1=Dm2max/Dm2=Dmm/Dmc (11) where Dmc is the change in the electrophoretic mobility due to the presence of the concentration c of charged ligand (Ag) in the electrophoresis buffer, andDmmis the value of Dmc at saturating concentrations of charged ligand Ag. Thus, Eq. (11) can be rewritten as
1/Dmc= (1/Dmm)1 (1/Dmm)(Kd) (1/[Ag]) (12) where Kd, equals (Kd11 Kd2) / 2, is the arithmetical aver-age value of the dissociation constants Kd1and Kd2. If the total amount of Ag available for binding is much higher than the amount of Fab, i.e., if there is an Ag excess, then 1/Dmc= (1 /Dmm)1 (1/Dmm)(Kd) (1/c) (13) where c is the total Ag concentration, andDm can be cal-culated from migration time.
3.4.2 Examples
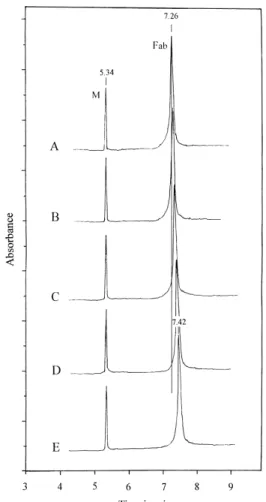
We choose a Fab, prepared from its monoclonal anti-phosphotyrosine IgG, specific to a divalent antigen (dAg), an 18-mer diphosphotyrosine peptide, as a model to evaluate the potential of ACE for the determination of the average affinity [20]. The mobility-shift behavior of Fab in electrophoretic solution was observed (Fig. 8) and the quantitative expression was presented to estimate the arithmetical average value of the intrinsic affinities for two epitopes on the dAg with the Ag-binding site on the Fab. In dAg excess, based on measurement of mobility changes of Fab analyte at different dAg concentrations, the experi-mental average dissociation constant (Kd= 27.7mM) was calculated from Eq. (13) and found to be useful for
estimat-Figure 8. Interaction of divalent antigens (dAg’s), 18-mer diphosphotyrosine peptides, with monovalent anti-phos-photyrosine Fab in ACE. CE apparatus, Beckman P/ACE 5500; uncoated capillary, 57 cm (50 cm effective separa-tion length)675 mm ID; sample, mixture (35 mL) of Fab (0.6mM) in borate buffer, pH 8.2, and internal peptide mar-ker (M) (0.1 mM) pressure-injected at 5 s followed by elec-trophoresis in the presence of (A) 0M, (B) 18mM, (C) 45mM, (D) 90mM, and (E) 120mMdAg. Absorbance, UV 200 nm; temperature, 227C; operating voltage, 15 kV. The vertical line indicates the migration time for the Fab in the control experiment (in the absence of dAg). Reprinted from [20], with permission.
ing the intrinsic affinity levels of the two different epitopes on the dAg. It was also found that the structural variation of the two epitopes for binding specificity to the Ag-bind-ing domain of Fab is not apparent.
3.5 Polyclonal Ab-monovalent Ag interaction The monoclonal Ab preparation only contains one epitope specificity. However, in many situations, the polyclonal Ab from immunoserum contains a heterogeneous population of Ab’s of different affinity for the immunogen.
3.5.1 Data analysis
The next level of complexity arises when one is deal-ing with a mixture of Ab’s of varydeal-ing affinity. More often a Scatchard plot, based on the ratio of the bound frac-tion to the concentrafrac-tion of the free Ag at various con-centrations against the concentration of the Ag, is estab-lished to evaluate the binding constant according to Eq. (14):
b =S{niKbi[Ab]/(11 Kbi[Ab])} (14) where b represents the total fraction of the Ag bound per Ab, niis the moles of binding site i per mole of the Ab, and Kbiis the binding constant for the Ag at the specific site. The Scatchard plot is linear for a homogeneous monoclonal Ab, but the Scatchard plot for heteroge-neous polyclonal Ab is curved. Taking the limits as [Ab] ? 0 and [Ab] ? ?, the intercept on the abscissa can be calculated as Sni and the intercept on the ordinate SKbini. Therefore, one can still obtain the total Ab site concentration from the intercept on the abscissa. The problem is in obtaining the different affinity, SKbi, and the concentration of the individual Ab subpopulation, Sni. It is difficult to determine the different intrinsic bind-ing constants between polyclonal Ab and monovalent Ag by Scatchard plot.
3.5.2 Examples
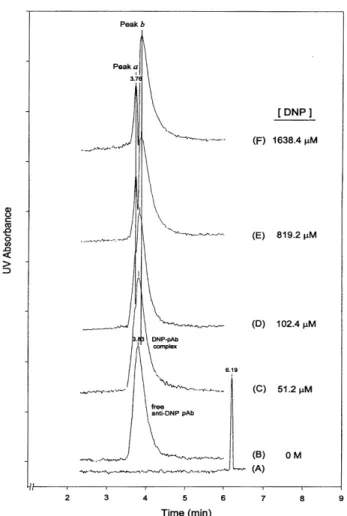
We chose a polyclonal Ab specific to a hapten, DNP, as a model to evaluate the potential of ACE for detecting anti-DNP Ab subpopulation by studying the migration-shift pattern of complexes [23]. When 1– to 32-fold concentra-tion of DNP over polyclonal Ab binding sites is conducted with this polyclonal anti-DNP Ab, the DNP-binding poly-clonal Ab does not produce any apparent change in the peak shape or migration time. However, at large DNP excess (32– to 1024- fold concentration excess) the poly-clonal Ab gradually splits in two subpopulations (Fig. 9). The minor peak was observed to migrate at a constant time with increasing amounts of DNP, while when the con-centrations of DNP were increased continuously, the major subpopulation gradually shifted away from the minor peak. This observation can be attributed to the fact that DNP is anionic at pH 8.35 and the negative charges change the charge on the complex compared to the free Ab, resulting in a change in the migration time of the complex. We propose that the major and the minor peak, in fact, represent a subpopulation of higher-affinity Ab’s and of low- or very-low-affinity Ab’s, individually. A conclusion would be that very few or no higher-affinity Ab’s exist in the preparation but that they are all in fact of low to moderate affinity.
Figure 9. Electropherograms showing the binding migra-tion-shift pattern of polyclonal anti-DNP antibody (pAb) to the DNP in ACE. CE apparatus, Beckman P/ACE System MDQ; uncoated capillary, 57 cm (50 cm effective separa-tion length)650 mm ID; sample, mixture (35 mL) of anti-DNP pAb (1.6 mM maximum available binding sites) in 65 mM boric acid/15 mM sodium tetraborate buffer, pH 8.35, pressure-injected at 5 s followed by electro-phoresis in the presence of (B) 0 M, (C) 51.2 mM, (D) 102.4mM, (E) 819.2mM, and (F) 1638.4mM DNP. Absor-bance, UV 200 nm; temperature, 227C; operating voltage, 20 kV. In control experiments, the pAb has a migration time of approximately 3.83 min (B), whereas the DNP has a migration time of approximately 6.19 min (A) under the same conditions. Two vertical lines indicate the migration time for the peak a in (D)–(F) and peak b in (F), respec-tively. Reprinted from [23], with permission.
4 Determination of binding stoichiometry
ACE was primarily used to determine the binding con-stant in biomolecular recognition. In addition, ACE can be easily adapted to the determination of binding stoi-chiometry. Information obtained from binding stoichiome-tries allows one to measure the concentration of biologi-cally active proteins and to probe specificity.4.1 Data analysis
One can assume that all sites on the Ab are equivalent with respect to their interaction with the Ag. i.e., Ag attaches to n equivalent paratopes with equal affinity. In the case of a high affinity system, for each mole of the Ab in the sample solution the addition of n moles of Ag results in the formation of exactly one mole of the complex. Sam-ple containing a fixed Ab concentration and various Ag concentration are prepared and a capillary only contains the running buffer. When the concentration ratio [Ag]total/ [Ab] increases, the concentration of the complex peaks increases until [Ag]total/[Ab] = n. The Ab has been fully associated with Ag beyond the n value. An abrupt slope change in a plot of integrated free Ag versus the ratio of [Ag]total/[Ab] = n in samples correspond to the n value [24].
4.2 Examples
Chu and co-workers [24] reported the use of ACE as a method to determine binding stoichiometry between a monoclonal anti-human serum albumin (anti-HSA) and its Ag (HSA). The two complex peaks, which have different electrophoretic mobilities, are likely to represent the bind-ing of one and two HSA molecules. The signal strength of two complex increases as the amount of HSA was increased. A plot of the area of normalized free HSA peaks
versus the ratio of [HSA]/[anti-HSA], with the concentration
of anti-HSA held constant, shows a sharp break at a point corresponding to the binding stoichiometry 2 and rises steeply as a straight line. They show the same result for the determination of binding stoichiometry between a monoclonal anti-(bovine serum albumin) (anti-BSA) Ab and its Ag (BSA) [25]. The estimate for molecular masses of BSA, anti-BSA Ab and two complex peaks was 64, 147, 209 and 258 kDa, respectively, by using nondenaturing SDS capillary gel electrophoresis with UV absorbance. Okun and co-workers [26] also reported on binding para-meter determination for human rhinovirus serotype 2 (HRV2)-binding Ab or soluble receptor Fab’s using ACE [26]. The stoichiometry largely exceeds that of molecules analyzed so far with a similar method and can theoreti-cally be within the range of 1:12 and 1:60 ([virus]/[Ab] with 12, 24, 30, and 60 symmetry-related equivalent sites present on an icosahedral surface. Binding of these com-pounds to their recognition sites on the viral surface is assumed to occur independently of the other symmetry-related equivalent sites (noncooperative binding). Plots based on different numerical values for the dissociation constant and the initial concentrations of the reactants resulted in curves of characteristic shapes, which depend on the relation between the dissociation constant and the analyte concentration. For a high-affinity system, the
curve approximates a decaying straight line and the bind-ing stoichiometry can be accurately determined from the intercept with the x-axis. For intermediate-affinity sys-tems, the binding stoichiometry can also be derived, however, with less accuracy dictated by the affinity and the initial concentrations of the analytes. For the low-affinity case, obviously no stoichiometry can be derived. The stoichiometry for the complex of a nonaggregating Ab (mAb 8F5) and of monovalent human very-low-density lipoprotein receptor encompassing repeats 2 and 3 with HRV2 was 1:28 and 1:60, respectively.
5 Concluding remarks
Essentially, the monoclonal Ab preparation employed in these immuno-ACE studies, at least in theory, contains a single, homogeneous population of Ab molecules specific to an epitope. However, in many situations the Ab prepara-tion assayed contains a heterogeneous populaprepara-tion of Ab’s (polyclonal Ab’s) of different affinity for the immunogen. Observation of hapten-specific Ab subpopulations re-quires the ability to detect and discriminate between the hapten-anti-hapten complex and the free species. Immuno-ACE has now been investigated for quite some time. The experimental method by immuno-ACE has been reported to observe Ab affinity distributions in Ab-Ag reactions and to assess the heterogeneity of affinity [23]. However, there is to date no proof of concept that immuno-ACE can be performed in estimating the intrinsic affinities or defining exactly how many subpopulations of different affinity exist in a polyclonal Ab. Nevertheless, it will be interesting to follow over the coming years how ACE will advance in this field of immunobiotechnology.
Received September 11, 2001
6 References
[1] Kajiwara, H., Hirano, H., Oono, K., J. Biochem. Biophys.
Methods 1991, 22, 263–269.
[2] Knauer, M. F., Soreghan, B., Kosmoski, J., Glabe, C. G., Proc.
Natl. Acad. Sci. USA 1992, 89, 7437–7442.
[3] Avila, L. Z., Chu, Y.-H., Blossey, E. C., Whitesides, G. M.,
J. Med. Chem. 1993, 36, 126–132.
[4] Avila, L. Z., Whitesides, G. M., J. Org. Chem. 1993, 58, 5508– 5513.
[5] Liu, J., Volk, K. V., Lee, M. S., Kerns, E. H., J. Chromatogr. A 1994, 680, 395–403.
[6] Nielsen, R. G., Rickard, E. C., Santa, P F, Sharknas, D. A., Sit-tampalam, G. S., J. Chromatogr. 1991, 539, 177–185. [7] Chen, F.-T., Evangelista, R. A., Clin. Chem. 1994, 40, 1819–
1822.
[8] Monnig, C. A., Kennedy, R. T., Anal. Chem. 1994, 66, 280R– 314R.
[10] Schultz, N. M., Kennedy, R. T., Anal. Chem. 1993, 65, 3161– 3165.
[11] Lausch, R., Reif, O.-W, Riechel, P., Scheper, T.,
Electro-phoresis 1995, 16, 636–646.
[12] Harrington, S. J., Varro, R., Li, T. M., J. Chromatogr. 1991,
559, 385–396.
[13] Lin, S., Hsu, S.-M., Electrophoresis 1997, 18, 2042–2046. [14] Heegaard, N. H. H., Robey, F. A., Anal. Chem. 1992, 64,
2479–2482.
[15] Tao, L., Kennedy, R. T., Electrophoresis 1997, 18, 112–117. [16] Hulme, E. C., Birdsale, N. J. M., in: Hulme, E. C. (Ed.),
Receptor-Ligand Interactions, IRL, Oxford University Press,
Oxford 1992, pp. 63–176.
[17] Heegaard, N. H. H., Robey, F. K., J. Liq. Chromatogr. 1993,
16, 1923–1939.
[18] Heegaard, N. H. H., J. Chromatogr. A 1994, 680, 405–412. [19] Heegaard, N. H. H., Olsen, D. T., Larsen, K.-L. P, J.
Chroma-togr. A 1996, 744, 285–294.
[20] Lin, S., Tang, P., Hsu, S.-M., Electrophoresis 1999, 20, 3388– 3395.
[21] Lin, S., Hsiao, I.-Y, Hsu, S.-M., Anal. Biochem. 1997, 254, 9–17.
[22] Mammen, M., Gomez, R. A., Whitesides, G. M., Anal. Chem. 1995, 67, 3526–3535.
[23] Lin, S., Tsai, J.-C., Hsu, S.-M., Anal. Biochem. 2000, 284, 422–426.
[24] Chu, Y. H., Lee, W. J., Stassinopoulos, A., Walsh, C. T.,
Bio-chemistry 1994, 33, 10616–10621.
[25] Ou, J. P., Chang, S. T. H., Yeung, W. S. B., J. Chromatogr. B 1999, 731, 389–394.
[26] Okun, V. M., Moser, R., Blaas, D., Kenndler, E., Anal. Chem. 2001, 72, 3900–3906.
[27] Hessian, P. A., Edgeworth, J., Hogg, N., J. Leukocyte Biol. 1993, 53, 197–204.
[28] Birge, R. B., Hanafusa, H., Science 1993, 262, 1522–1525. [29] Hage, D. S., J. Chromatogr. A 2001, 906, 459–481. [30] Chu, Y.-H., Whitesides, G. M., J. Org. Chem. 1992, 57,
3524–3525.
[31] Honda, S., Taga, A., Suzuki, K., Suzuki, S., Kakehi, K.,
J. Chromatogr. 1992, 579, 377–382.
[32] Carpenter, J. L., Camilleri, P., Dhanak, D., Goddall, J.,
J. Chem. Soc. Chem. Commun. 1992, 57, 3524–3526.
[33] Heegaard, N. H. H., Robey, F. K., J. Immunol. Methods 1993,
166, 103–110.
[34] Thomas, C. V., Cater, A. C., Wheeler, J. J., J. Liq.
Chroma-togr. 1993, 16, 1903–1911.
[35] Kuhn, R., Frei, R., Christen, M., Anal. Biochem. 1994, 218, 131–135.
[36] Winzor, D. J., J. Chromatogr. A 1995, 696, 160–163. [37] Rundlett, K. L., Armstrong, D. W., J. Chromatogr. A 1996,
721, 173–186.
[38] Gomez, R. A., Avila, L. Z., Chu, Y.-H., Whitesides, G. M.,
Anal. Chem. 1994, 66, 1785–1791.
[39] Colton, I. J., Carbeck, J. D., Rao, J., Whitesides, G. M.,
Electrophoresis 1998, 19, 367–382.
[40] Lancet, D., Pecht, I., Biochemistry 1997, 16, 5150–5157. [41] Zidovetzki, A. L., Pecht, I., Proc. Natl. Acad. Sci. USA 1979,
76, 5848–5852.
[42] Zidovetzki, R., Light, A., Pecht, I., Mol. Immunol. 1981, 18, 491–497.
[43] Berzofsky, J. A., Berkower, I. J., in: Paul, W. E. (Ed.),
Anti-body-Antigen Interaction, CRC Press, Boca Raton, FL
1983, pp. 595–644.
[44] Weir, D. M. (Ed.), Handbook of Experimental Immunology, Blackwell Scientific Publication, Oxford 1978, pp. 16.1– 16.20.
[45] Karlsson, R., Falt, A., J. Immunol. Methods 1997, 200, 121– 133.
[46] Celada, E., Schmidt, D., Strom, R., Immunology 1969, 17, 189–198.
[47] Steward, M. W., Petty, R. E., Immunology 1972, 22, 747–756. [48] Steward, M. W., Petty, R. E., Immunology 1972, 23, 881–887. [49] Mulligan J. J., Osler, A. C., Rodriguez, E., J. Immunol. 1966,
96, 324–329.
[50] Singer, S. J., Campbell, D. H., J. Am. Chem. Soc. 1952, 74, 1974–1979.
[51] LeFor, W. M., Bauer, D. C., J. Immunol. 1970, 104, 1276– 1282.