Time Series Analysis of Taiwanese Catch Data of Japanese Glass Eels
Anguilla japonica: Possible Effects of the Reproductive Cycle and El
Niño Events
Yu-San Han1,*, Wann-Nian Tzeng1, and I-Chiu Liao2
1Department of Life Science and Institute of Fisheries Science, College of Life Science, National Taiwan University, Taipei 106, Taiwan 2Department of Aquaculture, College of Life and Resource Sciences, National Taiwan Ocean University, 2 Pei-Ning Road, Keelung 202,
Taiwan
(Accepted January 9, 2009)
Yu-San Han, Wann-Nian Tzeng, and I-Chiu Liao (2009) Time series analysis of Taiwanese catch data of
Japanese glass eels Anguilla japonica: possible effects of the reproductive cycle and El Niño events. Zoological
Studies 48(5): 632-639. The annual catch of glass eels of the Japanese eel Anguilla japonica highly fluctuates
in East Asia, which is a great risk to the eel aquaculture industry and makes resource management difficult. An analysis of data of the catch of glass eels from 1972 to 2008 in Taiwan indicated that the glass eel catch mainly fluctuates in a cycle of 5 and 6 yr, which matches the dominant reproductive cycle of this species. The peak catch percentage of silver eels in the estuary of the Kaoping River in southwestern Taiwan occurred 1 yr before a glass eel peak catch, implying a possible spawner-recruit relationship. Burst catches of glass eels every 11 yr match periods of maximum solar activity. The annual glass eel catch was not statistically correlated with the El Niño-Southern Oscillation (ENSO) index, although strong El Niño events seemed to correspond to years of poor catches. Thus, fluctuations in the annual glass eel catch are likely shaped by both the reproductive cycle of the eel and environmental variations such as sunspot cycles and strong El Niño events.
http://zoolstud.sinica.edu.tw/Journals/48.5/632.pdf
Key words: Japanese eel, Glass eel Catch, Time series analysis, Reproductive cycle, ENSO.
* To whom correspondence and reprint requests should be addressed. Tel: 886-2-33663726. Fax: 886-2-33663726. E-mail:[email protected]
T
he Japanese eel (Anguilla japonica Temminck and Schlegel) is a temperate zone catadromous fish with a complex life cycle (Tsukamoto 1992 2006, Tesch 2003). Before spawning migration, yellow-stage eels metamorphose into silver-stage eels (Han et al. 2003, Tesch 2003). The silver eels leave conti-nental rivers and may migrate more than 2000 km for about 6 mo to west of the Mariana Is. to spawn and then die (Tsukamoto 1992 2006). After hatching, the larvae (leptocephali) drift from their spawning grounds with the North Equatorial Current (NEC) and then the Kuroshio Current (KC) for 4-6 mo to reach the coasts of East Asia. They then metamorphose into glass eels and becomepigmented elvers when they enter river/estuarine habitats in the Philippines, Taiwan, China, Korea, and Japan (Cheng and Tzeng 1996, Tesch 2003, Kim et al. 2007). Elvers grow to yellow-stage eels in rivers, lagoons, and coastal waters (Tsukamoto et al. 1998, Tsukamoto and Arai 2001, Tzeng et al. 2002 2003).
The Japanese eel is an important aquaculture species in China, Japan, Korea, and Taiwan. The artificial reproduction of eels has not been successful on a commercial scale (Tanaka 2003), and all of the eel fry needed for aquaculture depends on the catch of glass eels harvested in estuarine/coastal waters during their upstream migration (Cheng and Tzeng 1996, Liao 2001,
Tzeng 2003). A sustainable eel aquaculture industry thus depends on a stable supply of glass eels. However, glass eels have declined in recent decades (Tzeng 1984 1996, Tatsukawa 2003), and the annual glass eel catch highly fluctuates in Taiwan (Fig. 1A) and other East Asian countries (pers. comm. from the Taiwan Eel Farming Industry Development Foundation and local eel traders). Accordingly, an understanding of the population dynamics of the Japanese eel is very important for resource assessment and the eel aquaculture industry. However, the processes involved in fluctuations in glass eel recruitment are not yet fully understood (Dekker 2003, Tzeng
2003, Friedland et al. 2007, Kettle et al. 2008). Both density-dependent factors, such as spawner numbers and the larval survival rate, and density-independent factors, such as temperature, oceanic currents, and climate change, may have potential impacts on the recruitment success of glass eels.
The annual production of Peruvian anchoveta (Engraulis ringens) may vary more than 100 fold, with much of the variability resulting from changes in the El Niño-Southern Oscillation (ENSO) (Jacobson et al. 2001). For the European eel, migration patterns of glass eels may be related to the North Atlantic Oscillation (Kettle et al. 2008). In Japan, the ENSO plays some role in determining
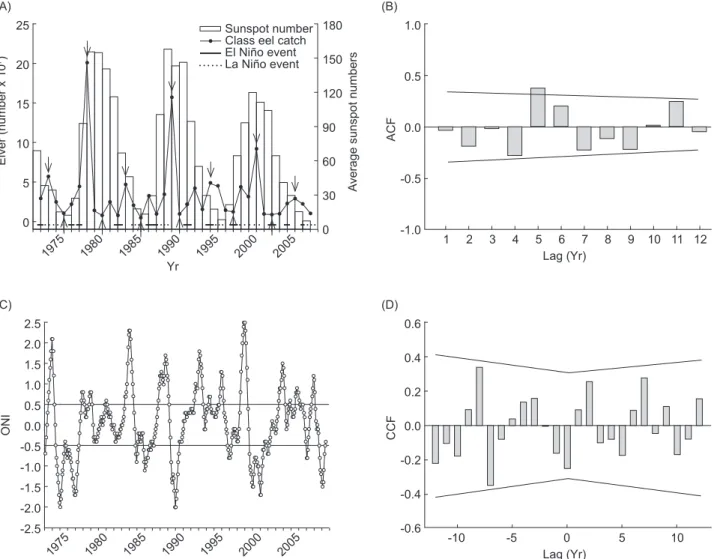
Fig. 1. (A) The annual catch of Anguilla japonica glass eels in Taiwan in relation to El Niño/La Niña events and solar activity during the
period of 1972 to 2008. Arrows indicate years of peak and poor glass eel catches. (B) Autocorrelation plot for a time series analysis of glass eel catch data between 1972 and 2008. The lines beside the bars indicate the 95% confidence intervals. ACF, autocorrelation function. (C) Monthly values of the Oceanic Niño Index (ONI) during 1972-2008. A threshold of ± 0.5°C for the ONI was indicated. (D) Cross-correlation plot of the average annual ONI and the annual catch of glass eels in Taiwan from 1972 to 2008. The lines beside the bars indicate 95% confidence intervals. CCF, cross-correlation function.
25 20 15 10 5 0 Elver (number x 10 7) Yr 1975 1980 1985 1990 1995 2000 2005 180 150 120 90 60 0 30 Average sunspot numbers Sunspot number Class eel catch El Niño event La Niño event (A) 1.0 0.5 0.0 -0.5 -1.0 ACF Lag (Yr) 1 (B) 2 3 4 5 6 7 8 9 10 11 12 2.5 1.5 0.5 -0.5 -1.5 -2.5 ONI Yr 1975 1980 1985 1990 1995 2000 2005 (C) 2.0 1.0 0.0 -1.0 -2.0 0.6 0.2 0.0 -0.2 -0.6 CCF Lag (Yr) -10 (D) -5 0 5 10 0.4 -0.4
the abundance of glass eel recruits of the Japanese eel (Kimura et al. 2001, Kim et al. 2007). The population genetic structure of the Japanese eel is divided into southern and northern groups in East Asia (Tseng et al. 2006), thus the possible impacts of ENSO events on glass eel recruitment in Taiwan, in the southern region of East Asia, are still unknown. Historical catch data and biological characteristics of fish species may provide valuable information on population dynamics (Myers et al. 1995, Dekker 2004). In semelparous species such as salmon, a spawner-recruit relationship that is constant over time provides a basis for predicting the range of recruitment from the reproductive cycle. For example, the Alaska Department of Fish and Game (ADF&G) has forecast the commercial harvest for major salmon fisheries since 1969. Projections are based mainly on average historical catches and the escapement magnitudes of parental stocks (Eggers 2007). In contrast to salmon, which spawn in rivers and have a strong homing behavior, the spawning and larval drifting of the Japanese eel occurs in the open ocean far from land, making surveillance of parental stocks and larvae much more difficult.
The eel aquaculture industry in Taiwan was established during the 1960s and has since grown rapidly (Liao 2001). To meet the demand for glass eels for eel aquaculture, the numbers of glass eel fishermen also rapidly increased (Tzeng 2001). Even with increasing fishing efforts, however, the annual glass eel catch has shown no increasing trend but exhibits great fluctuations (Fig. 1A). Thus, this study attempted to understand, by correlation analyses, fluctuations in the catch of Japanese glass eels in relation to the eel’s life history and environmental variations.
MATERIALS AND METHODS Eel catch
Data on silver and yellow Japanese eels were from our own research survey catches; animals were collected by eel traps or fyke nets in the estuary of the Kaoping River, southwestern Taiwan (120°50'E, 22°40'N) from Nov. 1998 to Feb. 2008 (Table 1). The Kaoping River produces most of the wild Japanese eels caught in Taiwan. The eel traps or fyke nets were set at the riverside of the estuary, which is influenced by a tidal cycle with a salinity from 0 ppt at the ebb tide to 30 ppt at the flood tide. The eel traps or fyke nets were
set during the ebb tide, and eels were collected in the next ebb tide over approximately 12 h. The number of traps or fyke nets was not fixed between years. Since more than 90% of downstream migrating silver eels occur from Sept. to Jan. in Taiwan (Han 2003), eels caught in this interval were used for spawning stock assessment. The eels collected ranged 25-75 cm in total length. The developmental stages between yellow and silver eels were determined by body coloration and gonadal development based on the method of Han et al. (2003). In total, 62 silver eels (20 males and 42 females) were selected for otolith age analysis from samples collected from 1998 to 2003. Sagittal otoliths were used to determine the fish age following the procedures of Tzeng et al. (1994).
Glass eel recruitment in Taiwan occurs between Oct. and Apr. (Han et al. 2008). Accord-ingly, the annual glass eel catch was summed over the fishing season. Annual glass eel catches in the entire Taiwan area were compiled from 1972 to 2008 based on monthly catch data from the Taiwan Fisheries Yearbook (Fisheries Agency, Council of Agriculture, Executive Yuan) and from the Taiwan Eel Farming Industry Development Foundation (Taipei, Taiwan).
Data source of ENSO events and solar activity
The El Niño/La Niña events were identified from data collected by the Climate Prediction Center of the National Oceanic and Atmospheric Administration (NOAA, Washington DC, USA)
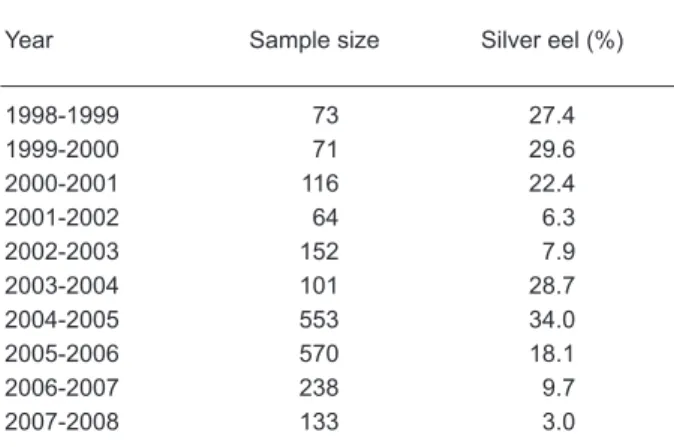
Table 1. Annual fluctuation in the percentage of
silver eels in the total catch of eels in the Kaoping River between 1998 and 2008. Eels caught between Sept. and Jan. were analyzed
Year Sample size Silver eel (%)
1998-1999 73 27.4 1999-2000 71 29.6 2000-2001 116 22.4 2001-2002 64 6.3 2002-2003 152 7.9 2003-2004 101 28.7 2004-2005 553 34.0 2005-2006 570 18.1 2006-2007 238 9.7 2007-2008 133 3.0
(http://www.cpc.ncep.noaa.gov/products/ analysis_monitoring/ensostuff/ensoyears.shtml). Monthly values during 1972-2008 were based on the Oceanic Niño Index (ONI) (of 3 mo running means of ERSSTv3 sea surface temperature (SST) anomalies in the Niño 3.4 region at 5°N -5°S, 120°-170°W) (Fig. 1B). El Niño events were defined when a threshold of + 0.5°C for the ONI was met for a minimum of 5 consecutive overlapping months. La Niña events were defined when a threshold of -0.5°C for the ONI was met for a minimum of 5 consecutive overlapping months. Average annual sunspot numbers were based on NOAA, US Department of Commerce (Washington DC, USA; http://www.ngdc.noaa.gov/stp/SOLAR/ ftpsunspotnumber.html#american).
Data analysis
The time series analysis of glass eel catch fluctuations and ONI was performed with 1972 to 2008 data by autocorrelations using SPSS ver. 12 (SPSS Inc., Illinois, USA). A cross-correlation was performed between the glass eel catch and ONI. Catch data were natural log-transformed to fit the homogeneity of variance (homosedasticity) before running the correlation analysis. For the ONI data, which fitted homogeneity, no log transformation was performed before running the autocorrelation or cross-correlation. Differences in silvering age between male and female eels were tested with the Mann-Whitney U-test. Differences in the mean annual catch of glass eels among normal, El Niño, and La Niña years were performed with the Kruskal-Wallis test followed by the Mann-Whitney U-test. Annual glass eel recruitment was defined as catches of an El Niño or La Niña year when the El Niño or La Niña periods covered at least 5 mo between June and Feb., the drifting period of eel larvae that are recruited to Taiwan. Annual recruitment numbers from other years were regarded as normal-year catches. The annual ONI was the average of the monthly ONI values, which were also calculated by period between June and Feb.
RESULTS
Autocorrelation and cross-correlation analysis of glass eel catches and ENSO events
The recorded peak catch of glass eels in Taiwan occurred around 1978-1979 (Fig. 1A). A
time-series analysis of the long-term catch data indicated a positive autocorrelation at a time lag of 5 yr with significance, and positive autocorrelations were also found with time lags of 6 and 11 yr, although without significance (Fig. 1B). This matched the recurring wave peaks or wave bottoms in glass eel catches which have occurred at intervals of around 5 or 6 yr over the past 35 yr (Fig. 1A).
The monthly average ONI values during 1972-2008 are shown in figure 1C. The 2 strongest El Niño events occurred in 1982-1983 and 1997-1998, which corresponded to poor glass eel catches (Fig. 1A). The time-series analysis of the long-term ENSO data indicated positive autocorrelations at time lags of around 56 and 124 mo, and negative autocorrelations at time lags of around 25, 78, and 102 mo with significance (data not shown). However, cross-correlations between the average annual ONI values and the annual catch of glass eels in Taiwan from 1972 to 2008 showed no significant correlation in any lag year (Fig. 1D).
Reproductive cycle of eels in relation to glass eel catches
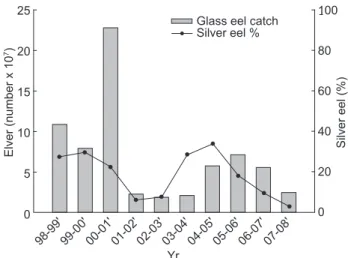
The percentage of silver eels in the total catch of eels was calculated yearly from 1998 to 2007 (Table 1, Fig. 2). The pattern of changes in percentages of silver eels occurred 1 yr before that of the glass eel catch. The correlation between the
25 20 15 10 5 0 Elver (number x 10 7) Yr 98-99' 100 80 60 40 20 0 Silver eel (%)
Glass eel catch Silver eel %
99-00' 00-01' 01-02' 02-03' 03-04' 04-05' 05-06' 06-07' 07-08'
Fig. 2. Annual glass eel catch in relation to the relative
abundances of silver stage eels from 1998-1999 to 2007-2008. The annual glass eel catch includes the entire Taiwan area. Silver/yellow eel data are our own research survey catches in the Kaoping River of southwestern Taiwan.
relative abundances of migrating silver eels and subsequent annual catches of glass eels showed a significant positive correlation (r = 0.78, p = 0.01). Glass eel catches in other lagged years showed no significant correlation with the relative abundances of silver eels (p > 0.5).
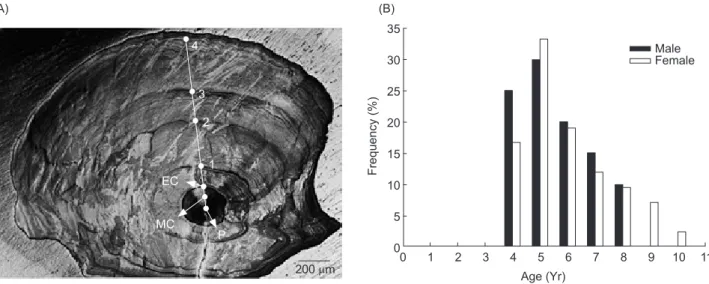
To identify eel maturation ages, otolith annuli were counted (Fig. 3A). The mean silvering ages of male and female eels were 5.55 ± 1.32 and 5.95 ± 1.61 yr, respectively, without a significant difference between sexes (p = 0.42). For both male and female silver eels, > 50% of silver eels were of aged 4 to 5 yr (Fig. 3B).
ENSO, solar activity, and the glass eel catch
Annual recruits were divided into 3 groups: normal, El Niño, and La Niña year catches. Average glass eel catch amounts in normal, La Niña, and El Niño years were (4.1 ± 6.0) × 107,
(3.7 ± 2.5) × 107, and (2.3 ± 1.3) × 107 glass eels,
respectively. Although the mean annual glass eel catch was lowest during El Niño years, no significant differences in catch abundances occurred among the 3 groups (p = 0.33). However, during stronger El Niño years with a mean ONI of > 1.0 (Fig. 1B), as during 1982-1983, 1987-1988, 1991-1992, 1997-1998, and 2002-2003, the mean glass eel catch of (1.2 ± 0.6) × 107 was significantly
poorer than that during La Niña years (p = 0.02). A burst in production of glass eels recurred every 11 yr (Fig. 1A), in the years of 1978-1979, 1989-1990, and 2000-2001. This 11 yr cycle is
twice the period of the 5-6 yr periodicity and matched the maxima solar activity with a sunspot cycle of 11 yr (Fig. 1A).
DISCUSSION AND CONCLUSIONS
Friedland et al. (2007) speculated that there might be an 8 yr periodicity in European eel catches that is related to the average reproductive time span. In the present study, the recurring 5-6 yr cycle in glass eel catches over recent decades in Taiwan is likely explained by the spawning cycle of the Japanese eel. As indicated by the maturation age of silver eels, > 50% of individuals spend 4 or 5 yr at the yellow stage before silvering. After silvering, it takes about 6 mo to reach the spawning area. Eel larvae then spend another 6 mo drifting before entering coastal waters. Thus, most Japanese eels have a 5 or 6 yr life cycle. In addition, the percentage of silver eels harvested each year from the Kaoping River also periodically cycled to synchronize with the glass eel catch of the following year. This 1 yr delayed correlation might imply a spawner-recruit relationship. The abundant glass eel cohort would dominate the entire stock after 4 or 5 yr of growth, thus increasing the percentage of silver eels in the total stock. Since no biomass information on silver eel stocks from other areas is available, determining the link between spawners and recruits thus requires further studies.
The cyclically high production of glass eels
Fig. 3. (A) A representative eel otolith showing annuli for a silver female Japanese eel (total length, 510 mm; body weight, 192.6 g). P,
primodium; MC, a metamorphosis check; EC, an elver check; numerals 1-4, annuli. (B) Frequency distribution of the age at silvering for male (n = 20) and female (n = 42) eels collected in the Kaoping River between 1998 and 2003.
35 20 15 10 5 0 Frequency (%) Age (Yr) 0 30 25 1 2 3 4 5 6 7 8 9 10 11 Male Female 200 µm P MC 1 EC 2 3 4 (A) (B)
every 11 yr is a unique phenomenon. Although this cycle is twice the period of the 5 or 6 yr periodicity, other factors may contribute to these unusual recruitment events. Interestingly, each peak catch event exactly matches the maximum solar activity which also has a cycle of 11 yr (Tzeng 1996). Many atmospheric and oceanic phenomena that exhibit decadal variations on both regional and global scales may directly or indirectly be correlated with solar activity, which in turn causes dynamic population rhythms in some organisms (Rind 2002). For example, cyclic outbreaks of forest moths in Norway exhibit a strong negative relationship with sunspot numbers (Selås et al. 2004). North American porcupine populations have fluctuated regularly with superimposed periodicities of 11 yr solar activity cycles (Klvana et al. 2004). It is unclear how solar activity can affect glass eel recruitment. More evidence is needed to clarify the cause of fluctuations in the glass eel catch.
The movement of a salinity front in the spawning ground, which is associated with the ENSO, may control the success of larval transport from the NEC to East Asia, thereby affecting glass eel recruitment success (Kimura et al. 2001, Kim et al. 2007). In addition, the number of Japanese eel larvae transported to the Kuroshio Current was much smaller than that to the Mindanao Current in an El Niño year, and recruitment decreased in those years in Japan. In non-El Niño years, the number transported to the Kuroshio Current was twice as high, and recruitment increased (Kim et al. 2007). In this study, average numbers of the glass eel catch in El Niño years in Taiwan were lower but did not significantly differ from those in normal or La Niña years. This implies that ENSO events might not play a major role in shaping glass eel recruitment in Taiwan. However, during stronger El Niño years, the mean glass eel catch was significantly lower than the mean glass eel catch during La Niña years. This indicates that stronger El Niño events seem to be able to modify the recruitment pattern of glass eels in Taiwan to some extent. The different effects of oceanic currents on glass eel recruitment between Taiwan and Japan might be due to different effects at both ends of the Kuroshio Current, as Taiwan is located near the start site of the Kuroshio Current while Japan is at its terminal end. The analysis of interactions between biotic and abiotic factors on shaping the pattern of glass eel recruitment would greatly benefit if glass eel catch data from other regions could be obtained.
The population genetic structure of the Japanese eel is supposedly spatially differentiated in East Asia into southern and northern groups with the Yangtze River as the boundary (Tseng et al. 2006). Stable oceanographic features are likely responsible for the spatial population structure of the eel (Sinclair 1988, Kettle and Haines 2006, Tseng et al. 2006). The glass eel catch in the area around Taiwan relative to that in southern China is around 1/10, and fluctuations in the glass eel catch in Taiwan are approximately consistent with those in China (pers. comm. from the Taiwan Eel Farming Industry Development Foundation and local eel traders). Thus, the pattern of glass eel catches in Taiwan might at least represent the population dynamics of the southern eel group. This 5 or 6 yr periodicity, however, might not apply to the northern eel group because of a possible different maturation pattern (Kotake et al. 2005).
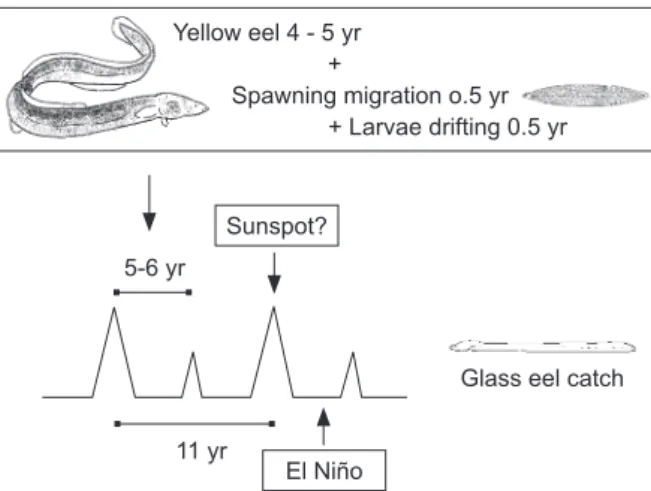
In Asia, the cost of glass eels comprises 30%-60% of the total production cost of eel aquaculture (Liao 2001). Therefore, understanding the dynamics of glass eel production is not only very important for eel resource conservation but also for programming production by the eel industry. The eel life cycle, solar activity, and El Niño events seem to affect the annual production of glass eels. We hypothesize that fluctuations in glass eel recruitment may be determined by the eel’s reproductive cycle. Glass eel production is synchronized and amplified by maximum solar activity every 11 yr and is diminished by strong El Niño events. These interactions are not mutually exclusive (Fig. 4). The abundant glass eel catch every 5-6 yr might be integrated with the sunspot cycle (11 yr). Strong El Niño events, which usually
Fig. 4. Plot showing the effects of the eel reproductive cycle,
solar activity, and El Niño events on glass eel recruitment. Yellow eel 4 - 5 yr
+
Spawning migration o.5 yr + Larvae drifting 0.5 yr Sunspot?
El Niño 11 yr
5-6 yr
occurred between peak catches of glass eels in past decades, might help strengthen cyclic fluctuations. Therefore, by surveying historical catch data, changes in silver eel abundances, sunspot cycles, and El Niño events, a forecast of glass eel recruitment is possible. Based on the low silver eel percentage in 2007-2008 (Table 1) and poor catch records in the years 2002-2004 (Fig. 1A), it is predicted that the glass eel harvest will be poor in Taiwan during the 2008-2009 fishing season. The possible spawner-recruit relationship indicates that river/estuary habitats are vitally important to eel resource management and conservation. On entering estuaries, rivers, and lakes, elvers face serious overexploitation and degraded habitats, and most might not survive to become adults. Accordingly, regulations should be implemented to prevent further declines in this valuable resource.
Acknowledgments: Research funding was
obtained from National Taiwan University and the National Science Council of the Executive Yuan, Taiwan (NSC96-2313-B-002-038). The authors thank Mr. B.M. Jessop for revising the draft, and previous students and assistants of the Department of Life Science and Institute of Fisheries Science, National Taiwan Univ. for help with eel sampling fieldwork. The experiments complied with the current laws of Taiwan in which the experiments were performed.
REFERENCES
Cheng PW, WN Tzeng. 1996. Timing of metamorphosis and estuarine arrival across the dispersal range of the Japanese eel Anguilla japonica. Mar. Ecol.-Prog. Ser.
131: 87-96.
Dekker W. 2003. Did lack of spawners cause the collapse of the European eel, Anguilla anguilla? Fish. Manag. Ecol.
10: 365-376.
Dekker W. 2004. Slipping through our hand. Population dynamics of the European eel. PhD dissertation. Institute for Biodiversity and Ecosystem Dynamics, Univ. of Amsterdam.
Eggers D. 2007. Run forecasts and harvest projections for 2007 Alaska salmon fisheries and review of the 2006 season. Alaska Department of Fish and Game, Division of Sport Fish, Research and Technical Services. Special Publication no. 07-01, pp. 52-75.
Friedland KD, MJ Miller, B Knights. 2007. Oceanic changes in the Sargasso Sea and declines in recruitment of the European eel. ICES J. Mar. Sci. 64: 519-530.
Han YS. 2003. The studies of the changes on the morphology, physiology and endocrinology during silvering process of the Japanese eel Anguilla japonica. PhD dissertation,
Institute of Zoology, National Taiwan Univ., Taipei, Taiwan. Han YS, IC Liao, YS Huang, JT He, CW Chang, WN Tzeng.
2003. Synchronous changes of morphology and gonadal development of silvering Japanese eel Anguilla japonica. Aquaculture 219: 783-796.
Han YS, YL Sun, YF Liao, KN Shen, IC Liao, WN Tzeng. 2008. Temporal analysis of population genetic composition in the overexploited Japanese eel Anguilla japonica. Mar. Biol. 155: 613-621.
Jacobson LD, JAA De Oliveira, M Barange, MA Cisneros-Mata, R Félix-Uraga, JR Hunter et al. 2001. Surplus production, variability, and climate change in the great sardine and anchovy fisheries. Can. J. Fish. Aquat. Sci.
58: 1891-1903.
Kettle AJ, DCE Bakker, K Haines. 2008. Impact of the North Atlantic oscillation on the trans-Atlantic migrations of the European eel (Anguilla anguilla). J. Geophys. Res. 113:
G03004.
Kettle AJ, K Haines. 2006. How does the European eel (Anguilla anguilla) retain its population structure during its larval migration across the North Atlantic Ocean? Can. J. Fish. Aquat. Sci. 63: 90-106.
Kim H, S Kimura, A Shinoda, T Kitagawa, Y Sasai, H Sasaki. 2007. Effect of El Niño on migration and larval transport of the Japanese eel (Anguilla japonica). ICES J. Mar. Sci.
64: 1387-1395.
Kimura S, T Inoue, T Sugimoto. 2001. Fluctuation in the distribution of low-salinity water in the North Equatorial Current and its effect on the larval transport of the Japanese eel. Fish Oceanog. 10: 51-60.
Klvana I, D Berteaux, B Cazelles. 2004. Porcupine feeding scars and climatic data show ecosystem effects of the solar cycle. Am. Nat. 164: 283-297.
Kotake A, A Okamura, Y Yamada, T Utoh, T Arai, MJ Miller, HP Oka, K Tsukamoto. 2005. Seasonal variation in the migratory history of the Japanese eel Anguilla japonica in Mikawa Bay, Japan. Mar. Ecol.-Prog. Ser. 293: 213-221.
Liao IC. 2001. A general review on aquaculture in Asia: a focus on anguillid eel. In IC Liao, ed. The 5th and 6th Asian Fisheries Forums. Asian Fisheries Society, AFS Special Publication no. 11, pp. 39-54.
Myers RA, NJ Barrowman, JA Hutchings, AA Rosenberg. 1995. Population dynamics of exploited fish stocks at low population levels. Science 269: 1106-1108.
Rind D. 2002. The sun’s role in climate variations. Science
296: 673-677.
Selås V, O Hogstad, S Kobro, T Rafoss. 2004. Can sunspot activity and ultraviolet-B radiation explain cyclic outbreaks of forest moth pest species? Proc. R. Soc. Lond. B 271:
1897-1901.
Sinclair M. 1988. Marine populations: an assay on population regulation and speciation. Books in Recruitment Fishery Oceanography. Seattle, WA: Univ. of Washington Press. Tanaka H, H Kagawa, H Ohta, T Unuma, K Nomura. 2003.
The first production of elver in captivity: fish reproductive physiology facilitates great progress in aquaculture. Fish Physiol. Biochem. 28: 493-497.
Tatsukawa K. 2003. Eel resources in East Asia. In K Aida, K Tsukamoto, K Yamauchi, eds. Eel biology. Tokyo: Springer Press, pp. 293-298.
Tesch FW. 2003. The eel. Oxford, UK: Blackwell Science, pp. 100-103.
Tseng MC, WN Tzeng, SC Lee. 2006. Population genetic structure of the Japanese eel Anguilla japonica in the
northwest Pacific Ocean: evidence of non-panmictic populations. Mar. Ecol.-Prog. Ser. 308: 221-230.
Tsukamoto K. 1992. Discovery of the spawning area for Japanese eel. Nature 356: 789-791.
Tsukamoto K. 2006. Spawning of eels near a seamount. Nature 439: 929.
Tsukamoto K, T Arai. 2001. Facultative catadromy of the eel Anguilla japonica between freshwater and seawater habitats. Mar. Ecol.-Prog. Ser. 220: 265-276.
Tsukamoto K, I Nak, WV Tesch. 1998. Do all fresh water eels migrate? Nature 396: 635-636.
Tzeng WN. 1984. An estimate of the exploitation rate of
Anguilla japonica elvers immigrating into the coastal
waters off Shuang-Chi River, Taiwan. Bull. Inst. Zool. Acad. Sin. 23: 173-180.
Tzeng WN. 1996. Short- and long-term fluctuations in catches of elvers of the Japanese eel Anguilla japonica in Taiwan.
In DA Hancock, DC Smith, A Grant, JP Bumer, eds.
Developing and sustaining world fisheries resources: the state of science and management. 2nd World Fisheries Congress Proceedings. Victoria, Australia: CSIRO, pp. 85-89.
Tzeng WN. 2001. Resource and ecology of elvers of the Japanese eel Anguilla japonica in Taiwan. In IC Liao, J Baker, eds. Aquaculture and fisheries resources management: Proceedings of the Joint Taiwan-Australia Aquaculture and Fisheries Resources and Management Forum. TFRI Conference Proceeding 4. Keelung, Taiwan: Taiwan Fisheries Research Institute, pp. 85-90. Tzeng WN. 2003. The processes of onshore migration of the
Japanese eel Anguilla japonica as revealed by otolith microstructure. In K Aida, K Tsukamoto, K Yamauchi, eds. Eel biology. Tokyo: Springer Press, pp. 181-190. Tzeng WN, Y Iizuka, JC Shiao, Y Yamada, H Oka. 2003.
Identification and growth rates comparison of divergent migratory contingents of Japanese eel (Anguilla japonica). Aquaculture 216: 77-86.
Tzeng WN, JC Shiao, Y Iizuka. 2002. Use of otolith Sr: Ca ratios to study the riverine migratory behaviors of Japanese eel Anguilla japonica. Mar. Ecol.-Prog. Ser.
245: 213-221.
Tzeng WN, HF Wu, H Wickström. 1994. Scanning electron microscopic analysis of annulus microstructure in otolith of European eel, Anguilla anguilla. J. Fish Biol. 45: 479-492.