Towards an Asian Vision of Library
and Information Research
[1]
圖書資訊學研究之亞洲視野
Christopher S.G. Khoo
Programme Director, MSc (Information Studies) and Associate Professor,
Division of Information Studies, Wee Kim Wee School of Communication & Information,
Nanyang Technological University, Singapore
E-mail: [email protected]
Keywords(關鍵詞): Library and Information Science Research(圖書館學與資訊科學
研究)
;
Asian Vision(亞洲視野)
;
Library and Information Science
(圖書館學與資訊科學)
【
Abstract】
The LIS profession and LIS researchers in
Asia have been looking to the West for
leadership, ideas and technology. Is it
possible to develop an Asian vision and
perspective of LIS? What is needed for an
Asian brand of LIS to develop? The paper
discusses these issues as well as reports an
analysis of LIS journal articles written by
Asian authors, to identify areas of strength in
Asian LIS research. It was found that Asian
LIS authors publish mainly in the areas of
bibliometrics, information retrieval, automatic
text analysis, information and Web
technologies, scholarly publications,
education and knowledge management.
【摘要】
亞洲地區的圖書資訊學研究人員不斷追尋
西方之領導能力、理念和科技,然而這是否能
發展出圖書資訊學的亞洲視野與觀點?而發
展此種亞洲品牌又需要什麼呢?本文探討上
述相關議題,並透過分析亞洲地區研究者所撰
寫之期刊文獻,以了解亞洲地區圖書資訊學之
研究實力。本文發現亞洲地區作者對於圖書資
訊學研究主要集中在書目計量學、資訊檢索、
自動文本分析、資訊與網路技術、學術傳播、
教育與知識管理多項領域。
Introduction
The LIS profession and LIS researchers in Asia have been looking to the West, particularly the U.S. and Britain, for leadership, ideas and technology. Aside from the many librarians and information professionals who obtained their professional education in the West, a substantial proportion of the current faculty of LIS schools have obtained their PhD from schools in the U.S. and the U.K. LIS schools in Asia are maturing, and the quantity and quality of research have been rising, with increasing numbers of research publications in top journals and conferences.
Mukherjee (2010) found a two-fold increase in the number of articles by Asian authors in LIS journals
indexed in Social Science Citation Index in the period 2001 to 2007. Sin (2011) carried out a bibliometric analysis of papers published in seven top LIS journals in the period 1980-2008, and found that the proportion of papers involving Asian authors grew from 4.5% in 1980 to 18.2% in 2008. For the last four years of the study period (2005-2008), three Asian countries (China, Taiwan and Singapore) were among the top 10 contributing countries.
However, LIS researchers in Asia continue to look to the West for research ideas and research collaborations. Mukherjee analyzed the co-authorship patterns and found that most collaborations occurred among authors in the same country or with authors in non-Asian countries! There are few collaborations across countries in Asia. Sin found that in 2008, 36.6% of papers by an Asian author involved international collaboration. But it was not reported what proportion of the collaborators were from another Asian country. In another study of authorship patterns in the top 20 LIS journals indexed in the Web of Science in the period 1967-2005, Park (2008) found that authors in the Asia and Pacific region were more likely to collaborate with authors in the U.S. than with authors in another country in the Asia and Pacific region. 15.7% of the articles by an author in the Asia/Pacific region had a co-author in the U.S., and another 13.1% had collaborators from countries outside the region.
Is it possible for an Asian vision or brand of LIS and LIS research to emerge? Will the body of LIS research in Asia eventually develop its own “Asian” characteristics and perspectives?
Or has the LIS field become so globalized and internationalized that it is no longer possible for a subculture or sub-community of scholars to emerge?
It is certainly desirable to develop information services and technologies that serve our communities better, that address our national problems, and that are more suited to our cultural, historical, socio-economic and political
environments. In attempting to do this, a national or Asian brand of LIS may emerge, that draws on Asian conceptions, symbols, thought patterns and frameworks. In any case, it is desirable for more dialog and collaboration among Asian scholars, which can give rise to new ideas, solutions and paradigms with an Asian flavor.
How can LIS schools encourage this development? What are the prerequisites for this development? I think the prerequisites for developing an Asian brand of LIS research are:
1. A critical mass of well-trained and talented LIS researchers
2. A conducive academic environment for them to do their best work
3. Resources to support research and good students to work with
4. Collaboration with libraries and industry to ground their research in the local contexts.
These prerequisites are, to a large extent, satisfied. Asian LIS schools have an increasing proportion of faculty with PhDs. Some schools are sponsoring faculty members to go overseas to obtain their PhD. Many universities have become research-intensive universities where faculty are expected to focus on research. Because of the growing economic prosperity in Asia, there is increasing government and commercial funding for R&D. There is also growing appreciation for lifelong learning among the people, and people are increasingly enrolling in higher degree programs thus boosting the graduate student population.
These conditions are necessary but not sufficient for evolving an Asian LIS. A conscious effort needs to be made to promote interaction, dialog and collaboration among LIS researchers in Asia. To develop an Asian brand of LIS, there is a need to build
• Communities of researchers in different sub-areas of LIS
• Who carry out high quality, rigorous research • Working on common problems
• Building on each other’s work/ideas, and citing each other’s work
• Developing areas of excellence and strengths in particular aspects of LIS
• Addressing problems in the context of Asian culture, language, and socio-political-economic environments, and
• Drawing inspiration from their culture and society.
In recent years, several initiatives have been started to promote dialog and collaboration among LIS researchers and educators in Asia, including:
• The Consortium of iSchools Asia-Pacific (CiSAP, http://www.cisap.asia/)
• The Asia-Pacific Conference on Library & Information Education & Practice (A-LIEP)—the fourth conference was held in Malaysia June 2011 (http://fim.uitm.edu.my/a-liep2011/)
• The International Conference on Asia Digital Libraries (ICADL) (http://www.icadl.org)
• Taiwan-Singapore-Thailand Workshop on Library & Information Research—the third workshop was held in Singapore in Jan. 2011 (http://www. ideapolis.sg/index.php/3rd-tst-cfp-archived). Research and writing can have different intended audience and scope of relevance. Some research studies are of local relevance—the research findings are of local or national relevance. An example is a descriptive study that documents and describes a service or system, or a local practice. The report, if it
describes local innovations and developments, can contribute to an Asian perspective in LIS. Action research, where research and practice are intertwined, can highlight local cultural, linguistic and socio-economic contexts. However, this research approach does not seem to be much practiced in the LIS field.
Other research studies are of international relevance in the sense that the research is not contextualized or based on the local situation, and can be carried out anywhere. Extreme examples are research in mathematics and computer science (e.g. developing algorithms) that are abstract and theoretical. In the LIS field, much of the research is related indirectly or directly to the generalized user. The research is carried out in specific geographic locations, but with the intention of generalizing the results to all or most human populations and geographic locations. I propose a third kind of research—internationalized local research. This kind of research explicitly takes into consideration the local context, culture and practices, and then seeks to derive principles for applying the results to other contexts and locations.
The rest of the paper presents the results of the first part of a study to identify some characteristics of Asian LIS research, and the areas of strength in LIS research in different Asian countries. Sub-areas of LIS that have sizable numbers of publications by Asian authors should be good candidates for developing an Asian perspective. The analysis distinguishes between articles published in local journals, possibly reporting research that are of local relevance, and articles published in foreign journals that may report research of international relevance.
Table 1 Number of journal papers indexed in the LISA database for publication year 2005-2009 Country No. Japan 715 China* 584 India 565 Taiwan+ 428 S. Korea 170 Singapore 152 Hong Kong 136 Iran 129 Turkey 122 Israel 98 Malaysia 77 Pakistan 59 Russia 42 Thailand 23 Kuwait 18 Saudi Arabia 14
* People’s Republic of China, including Hong Kong (“China, Mainland” in LISA) + Republic of China
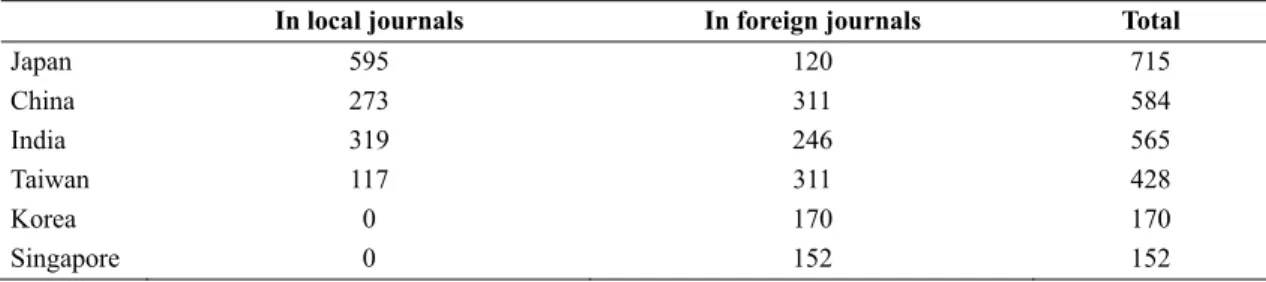
Table 2 Number of journal papers published in local versus foreign journals for 2005-2009
In local journals In foreign journals Total
Japan 595 120 715 China 273 311 584 India 319 246 565 Taiwan 117 311 428 Korea 0 170 170 Singapore 0 152 152
Data Collection
The Library and Information Science Abstracts (LISA) database was used to retrieve bibliographic records of journal articles by authors from different Asian countries. The AF (author affiliation) field was searched with the name of the country and the capital city. For Taiwan, the terms “Taiwan” and “Taipei” were used. For China, “China AND Mainland”, “Beijing”, “Shanghai” and “Hong Kong” were used [2]. Articles published in the five year period 2005-2009 were retrieved, and a simple cross-tabulation was performed to obtain the frequencies of each descriptor term in the Descriptor field and each classification
code in the Classification field.
Mukherjee (2010) had identified the 15 Asian countries with the biggest LIS publication output. Table 1 lists the number of articles found in the LISA database for these countries. The top six countries with more than 150 journal articles in the five-year period are selected for more detailed content analysis of the Descriptor and Classification fields. It was noticed that some countries had a disproportionate number of articles published in local journals and in the local language, and this might give misleading results. For example, for Japan, out of the 715 articles, 595 were published in Japanese journals mostly in the Japanese language.
So, the journal article records retrieved were divided into those published in local journals and foreign journals, and the two sets of records were analyzed separately. The Country of Publication field was used to identify the publication country of the journal. Unfortunately, the Country of Publication field is not filled for some records. For countries which are non-English speaking, the language of the article provides another way to identify articles published in local journals. It was verified that for Taiwan authors, all the Chinese language articles were published in Taiwan journals. It was assumed that Japanese articles were published in Japanese journals, and Chinese articles by China authors were published in mainland China. As India and Singapore are English-speaking countries, the language field could not be used to identify local articles. Hence, the grouping of articles into local and foreign journals should be less accurate for these countries. The number of articles published in local versus foreign journals for the six most prolific countries are given in Table 2.
Findings
The most frequent descriptors and categories (classification code and class) for Taiwan are listed in Tables 3 and 4. The data for the other five countries are given in Tables 5 to 14 in the Appendix. The tables list the top 20 descriptors and categories that have a frequency of at least 5. In the LISA database, each bibliographic record is assigned one or more descriptors, but exactly one category (classification code).
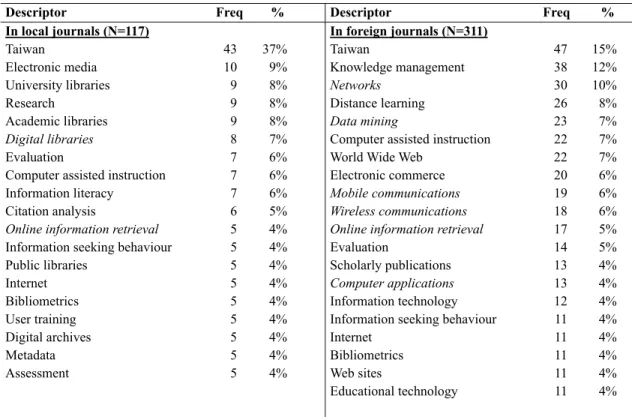
Table 3 lists the most frequent descriptor terms for Taiwan, divided into local (i.e. Taiwanese journals) and foreign journals. The most common descriptor term is
Taiwan, indicating that the articles described the situation
in Taiwan. It accounted for 37% of local articles, compared to 15% of articles published in foreign journals. This pattern holds for the other countries:
• Japan: 48% for local journals, 27% for foreign
journals (i.e. 48% of articles in local journals have “Japan” as one of the descriptor terms) • China: 17% for local journals, 19% for foreign
journals
• India: 53% for local journals, 42% for foreign journals
• Korea: 22% articles in foreign journals have “South Korea” as a descriptor, 6% have “Korea” as a descriptor
• Singapore: 18% for foreign journals
It can be seen that the list of descriptor terms from local journals is quite different from the descriptor terms from foreign journals. The most frequent descriptor terms for local journals, aside from Taiwan, are:
• electronic media,
• university/academic libraries, • research.
Clearly, local journals covered in LISA are library science oriented, whereas foreign journals include IT-oriented journals. This holds also for the other ten countries. One can learn much about libraries and library science in Asian countries from the local journals of the country.
On the other hand, descriptor terms from foreign journals are more IT-oriented. In Table 3, IT-oriented descriptors are italicized. IT-oriented articles refer to technical papers that give details of the technology or describe system development. It includes the descriptor terms networks, data mining, mobile communications,
wireless communications, online information retrieval
and computer applications. Surveys, user studies and applications of technology are excluded and not considered IT-oriented. It is not easy to tell just from the descriptor term whether it refers to IT-oriented papers. IT-oriented descriptors are identified by scanning sample titles that the descriptor has been assigned to. A descriptor is considered IT-oriented if a
majority of the articles are technical.
In the foreign journal’s list in Table 3, the descriptor terms with high frequencies are:
• knowledge management, • distance learning,
• computer-assisted instruction.
Table 3 Taiwan: Most frequent descriptors assigned to journal papers
Descriptor Freq % Descriptor Freq %
In local journals (N=117) In foreign journals (N=311)
Taiwan 43 37% Taiwan 47 15%
Electronic media 10 9% Knowledge management 38 12%
University libraries 9 8% Networks 30 10%
Research 9 8% Distance learning 26 8%
Academic libraries 9 8% Data mining 23 7%
Digital libraries 8 7% Computer assisted instruction 22 7%
Evaluation 7 6% World Wide Web 22 7%
Computer assisted instruction 7 6% Electronic commerce 20 6% Information literacy 7 6% Mobile communications 19 6% Citation analysis 6 5% Wireless communications 18 6%
Online information retrieval 5 4% Online information retrieval 17 5% Information seeking behaviour 5 4% Evaluation 14 5% Public libraries 5 4% Scholarly publications 13 4%
Internet 5 4% Computer applications 13 4%
Bibliometrics 5 4% Information technology 12 4%
User training 5 4% Information seeking behaviour 11 4%
Digital archives 5 4% Internet 11 4%
Metadata 5 4% Bibliometrics 11 4%
Assessment 5 4% Web sites 11 4%
Educational technology 11 4%
Note: Italics indicate IT-oriented descriptors.
Table 4 lists the most frequent categories (classification code) for local and foreign journals. Class codes beginning with 13.xx and 14.xx are considered IT-oriented categories and indicated in italics. The data suggest that local journals carry articles on:
• networks • bibliometrics • education • user training.
The top categories associated with foreign journals are: • networks • education • information retrieval • computer applications • bibliometrics.
The high percentage for networks is because it is assigned to technical papers on computer networking by authors from computer science and electronic engineering departments. Clearly Taiwan has particular strength in the areas of education, knowledge management, networks, information technology and information retrieval.
Table 4 Taiwan: Most frequent categories assigned to journal papers
Category Freq %
In local journals (N=117)
14.11 COMMUNICATIONS AND INFORMATION TECHNOLOGY - NETWORKS 11 9% 5.24 BIBLIOMETRICS, SCIENTOMETRICS, INFORMETRICS 11 9%
17.11 EDUCATION 10 9%
4.16 USER TRAINING 9 8%
3.2 ARCHIVES 6 5%
13.14 INFORMATION STORAGE AND RETRIEVAL - SEARCHING 5 4%
6.11 LIBRARY MANAGEMENT (OTHER THAN PERSONNEL MANAGEMENT) 5 4%
In foreign journals (N=311)
14.11 COMMUNICATIONS AND INFORMATION TECHNOLOGY - NETWORKS 65 21%
17.11 EDUCATION 43 14%
13.14 INFORMATION STORAGE AND RETRIEVAL - SEARCHING 34 11%
14.19 COMPUTER APPLICATIONS 31 10%
5.24 BIBLIOMETRICS, SCIENTOMETRICS, INFORMETRICS 27 9%
10.1 INFORMATION WORK 20 6%
10.11 INFORMATION COMMUNICATION - SOCIAL SCIENCES, BUSINESS
INFORMATION 10 3%
13.13 AUTOMATIC TEXT ANALYSIS, AUTOMATIC INDEXING, MACHINE TRANSLATION 9 3%
14.14 COMMUNICATIONS AND INFORMATION TECHNOLOGY - SOFTWARE 7 2%
10.0 INFORMATION COMMUNICATION 5 2%
Examining the lists of frequent descriptors and categories for the other ten countries in the Appendix, it is observed that Asia has particular strength in the following areas:
• bibliometrics
• information retrieval and automatic text analysis • information technology and Web technologies. Most of the countries have at least 5% of their foreign journal publications in these areas. Generally, about 8% to 11% of articles from each country are on bibliometrics. India has a particularly high proportion of articles on the subject (14% of local and foreign articles). On the other hand, Singapore has shown little interest in bibliometrics!
In additional to the overall top three research areas above, some countries have a fairly high proportion of publications in the following areas:
• education: Taiwan and Japan
• knowledge management: Taiwan and Singapore
Conclusion and Future Work
The small analysis that I have carried out suggest the following areas of strength for Asian LIS research: bibliometrics, information retrieval, automatic text analysis, information and Web technologies, scholarly publications, education and knowledge management. However, this result is based on the descriptor terms and classification used in the LISA database. I plan to apply text mining and automatic text analysis methods to the abstracts of the articles to identify common concepts and common techniques used by the authors.
A substantial proportion of the articles published in foreign journals (18% to 59%) have the country name as a descriptor, indicating that the article describes the local context with perhaps international relevance or
interest. Content analysis of the articles will be carried out to investigate whether there are Asian elements in the content of the articles.
Since non-library science researchers (e.g. from computer science, information systems, and management departments) also contribute papers to LIS journals, the data might not accurately reflect what is happening in LIS schools. Some method needs to be used to limit the data to LIS authors.
Finally, bibliometric and citation analysis techniques will be applied to find out to what extent Asian authors are cited in each area, and to what extent Asian authors are cited by other Asian authors.
Notes
[1] Revised version of paper presented at the 2010 International Symposium on the Transformation & Innovation of Library and Information Science,
National Taiwan Normal University, November 16-17, 2010.
[2] China was the only country for which major cities other than the capital city were used in the search.
References
Mukherjee, B. (2010). Assessing Asian scholarly research in library and information science: A quantitative view as reflected in Web of Knowledge. Journal of Academic Librarianship, 36(1), 90-101. Park, T.K. (2008). Asian and Pacific region authorship
characteristics in leading library and information science journals. Serials Review, 34(4), 243-251. Sin, S.-C.J. (2011). Longitudinal trends in
internationalisation, collaboration types, and citation impact: A bibliometric analysis of seven LIS journals (1980-2008). Journal of Library and Information Studies, 9(1), 27-49.
Appendix
DATA FOR JAPAN
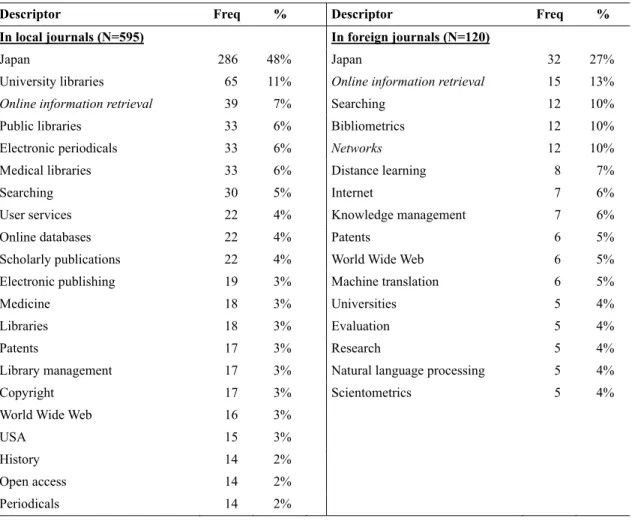
Table 5 Japan: Most frequent descriptors in journal papers
Descriptor Freq % Descriptor Freq %
In local journals (N=595) In foreign journals (N=120)
Japan 286 48% Japan 32 27%
University libraries 65 11% Online information retrieval 15 13%
Online information retrieval 39 7% Searching 12 10%
Public libraries 33 6% Bibliometrics 12 10%
Electronic periodicals 33 6% Networks 12 10%
Medical libraries 33 6% Distance learning 8 7%
Searching 30 5% Internet 7 6%
User services 22 4% Knowledge management 7 6%
Online databases 22 4% Patents 6 5%
Scholarly publications 22 4% World Wide Web 6 5% Electronic publishing 19 3% Machine translation 6 5%
Medicine 18 3% Universities 5 4%
Libraries 18 3% Evaluation 5 4%
Patents 17 3% Research 5 4%
Library management 17 3% Natural language processing 5 4%
Copyright 17 3% Scientometrics 5 4%
World Wide Web 16 3%
USA 15 3%
History 14 2%
Open access 14 2%
Periodicals 14 2%
Observations:
y Local journals: mainly library science
y Foreign journals: information retrieval and Web-oriented topics. Fewer IT-oriented topics than expected.
Table 6 Japan: Most frequent categories in journal papers
Category Freq %
In local journals (N=595)
13.14 INFORMATION STORAGE AND RETRIEVAL - SEARCHING 49 8%
5.24 BIBLIOMETRICS, SCIENTOMETRICS, INFORMETRICS 19 3%
16.1 COPYRIGHT 19 3%
4.15 USER SERVICES 19 3%
2.12 EDUCATION AND TRAINING 17 3%
16.18 ELECTRONIC PUBLISHING 17 3%
5.18 ELECTRONIC MEDIA 16 3%
4.16 USER TRAINING 15 3%
10.15 REFERENCE WORK 15 3%
14.11 COMMUNICATIONS AND INFORMATION TECHNOLOGY - NETWORKS 14 2%
3.2 ARCHIVES 12 2%
6.11 LIBRARY MANAGEMENT (OTHER THAN PERSONNEL MANAGEMENT) 12 2% 13.17 NON BIBLIOGRAPHIC DATABASES, DATA BANKS 12 2%
18.0 RECORDS MANAGEMENT 11 2%
10.0 INFORMATION COMMUNICATION 11 2%
13.23 ONLINE DATABASES 11 2%
13.11 INFORMATION STORAGE AND RETRIEVAL - NETWORKS 10 2% 10.13 INFORMATION COMMUNICATION - SCIENCE, TECHNOLOGY, MEDICINE 10 2%
6.1 COOPERATION 10 2%
14.19 COMPUTER APPLICATIONS 9 2%
9.15 TECHNICAL SERVICES - PRESERVATION 9 2%
In foreign journals (N=120)
13.14 INFORMATION STORAGE AND RETRIEVAL - SEARCHING 16 13% 5.24 BIBLIOMETRICS, SCIENTOMETRICS, INFORMETRICS 16 13%
14.11 COMMUNICATIONS AND INFORMATION TECHNOLOGY - NETWORKS 12 10%
17.11 EDUCATION 11 9%
13.13 AUTOMATIC TEXT ANALYSIS, AUTOMATIC INDEXING, MACHINE TRANSLATION 10 8%
14.19 COMPUTER APPLICATIONS 6 5%
Observations:
y High frequency of articles in information retrieval in both local and foreign journals y Bibliometrics: 13% of foreign articles
DATA FOR CHINA
Table 7 China: Most frequent descriptors in journal papers
Descriptor Freq % Descriptor Freq %
In local journals (N=273) In foreign journals (N=311)
China 47 17% China 59 19%
Online information retrieval 31 11% Chinese People's Republic 33 11%
Searching 27 10% Scholarly publications 29 9%
Automatic text analysis 18 7% Bibliometrics 26 8%
Bibliometrics 17 6% Data mining 24 8%
Competitive intelligence 17 6% Online information retrieval 22 7%
Citation analysis 16 6% Networks 19 6%
World Wide Web 16 6% Citation analysis 17 5%
Digital libraries 15 5% World Wide Web 17 5%
Medicine 14 5% Distance learning 17 5%
Data mining 13 5% Scholarly publishing 15 5%
Scholarly publications 13 5% Searching 13 4%
Ontologies 13 5% Web sites 13 4%
Business information 13 5% Computer applications 13 4%
Libraries 11 4% Scientometrics 13 4%
Chinese materials 11 4% Periodicals 12 4%
Information science 11 4% Evaluation 12 3%
Knowledge management 10 4% Libraries 10 3%
Computerized information storage
and retrieval 10 4% Algorithms 10 3%
Search engines 10 4% University libraries 10 3%
Chinese People's Republic 10 4%
Observations:
y Similar to Japan, China has high frequency in information retrieval y Also strong in IT-oriented topics and Web technologies.
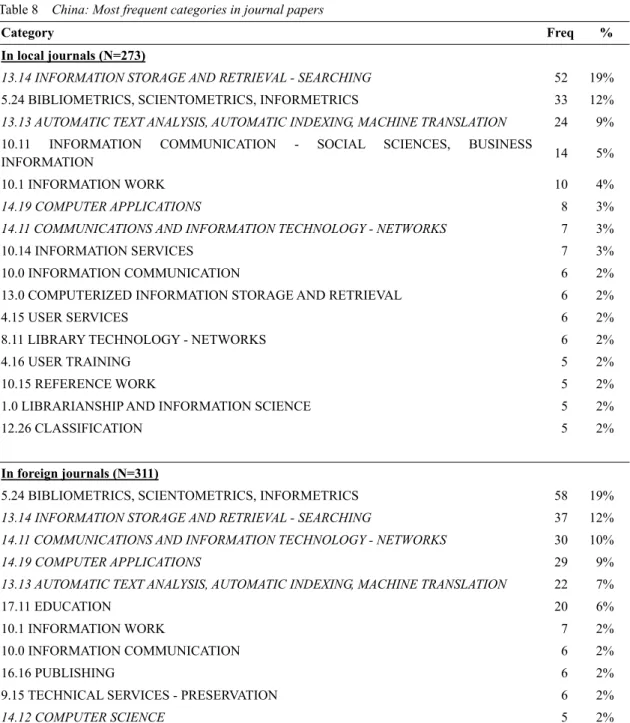
Table 8 China: Most frequent categories in journal papers
Category Freq %
In local journals (N=273)
13.14 INFORMATION STORAGE AND RETRIEVAL - SEARCHING 52 19% 5.24 BIBLIOMETRICS, SCIENTOMETRICS, INFORMETRICS 33 12%
13.13 AUTOMATIC TEXT ANALYSIS, AUTOMATIC INDEXING, MACHINE TRANSLATION 24 9% 10.11 INFORMATION COMMUNICATION - SOCIAL SCIENCES, BUSINESS
INFORMATION 14 5%
10.1 INFORMATION WORK 10 4%
14.19 COMPUTER APPLICATIONS 8 3%
14.11 COMMUNICATIONS AND INFORMATION TECHNOLOGY - NETWORKS 7 3%
10.14 INFORMATION SERVICES 7 3%
10.0 INFORMATION COMMUNICATION 6 2%
13.0 COMPUTERIZED INFORMATION STORAGE AND RETRIEVAL 6 2%
4.15 USER SERVICES 6 2%
8.11 LIBRARY TECHNOLOGY - NETWORKS 6 2%
4.16 USER TRAINING 5 2%
10.15 REFERENCE WORK 5 2%
1.0 LIBRARIANSHIP AND INFORMATION SCIENCE 5 2%
12.26 CLASSIFICATION 5 2%
In foreign journals (N=311)
5.24 BIBLIOMETRICS, SCIENTOMETRICS, INFORMETRICS 58 19%
13.14 INFORMATION STORAGE AND RETRIEVAL - SEARCHING 37 12%
14.11 COMMUNICATIONS AND INFORMATION TECHNOLOGY - NETWORKS 30 10%
14.19 COMPUTER APPLICATIONS 29 9%
13.13 AUTOMATIC TEXT ANALYSIS, AUTOMATIC INDEXING, MACHINE TRANSLATION 22 7%
17.11 EDUCATION 20 6%
10.1 INFORMATION WORK 7 2%
10.0 INFORMATION COMMUNICATION 6 2%
16.16 PUBLISHING 6 2%
9.15 TECHNICAL SERVICES - PRESERVATION 6 2%
14.12 COMPUTER SCIENCE 5 2%
Observations:
y Bibliometrics: 12% of local articles, 19% of foreign articles y Strong in information retrieval and automatic text analysis
DATA FOR INDIA
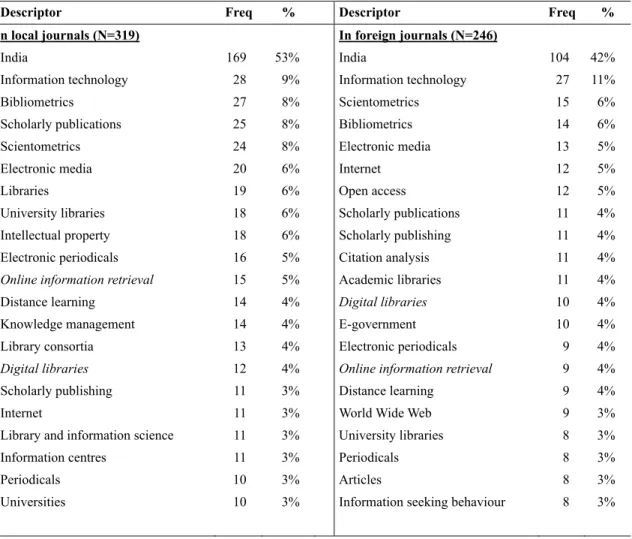
Table 9 India: Most frequent descriptors in journal papers
Descriptor Freq % Descriptor Freq %
n local journals (N=319) In foreign journals (N=246)
India 169 53% India 104 42%
Information technology 28 9% Information technology 27 11%
Bibliometrics 27 8% Scientometrics 15 6%
Scholarly publications 25 8% Bibliometrics 14 6%
Scientometrics 24 8% Electronic media 13 5%
Electronic media 20 6% Internet 12 5%
Libraries 19 6% Open access 12 5%
University libraries 18 6% Scholarly publications 11 4% Intellectual property 18 6% Scholarly publishing 11 4% Electronic periodicals 16 5% Citation analysis 11 4%
Online information retrieval 15 5% Academic libraries 11 4% Distance learning 14 4% Digital libraries 10 4%
Knowledge management 14 4% E-government 10 4%
Library consortia 13 4% Electronic periodicals 9 4%
Digital libraries 12 4% Online information retrieval 9 4% Scholarly publishing 11 3% Distance learning 9 4%
Internet 11 3% World Wide Web 9 3%
Library and information science 11 3% University libraries 8 3%
Information centres 11 3% Periodicals 8 3%
Periodicals 10 3% Articles 8 3%
Universities 10 3% Information seeking behaviour 8 3%
Observations:
y Bibliometrics and scientometrics together account for 80 (14%) of local and foreign articles. y Information technology ranks high on both local and foreign journals list.
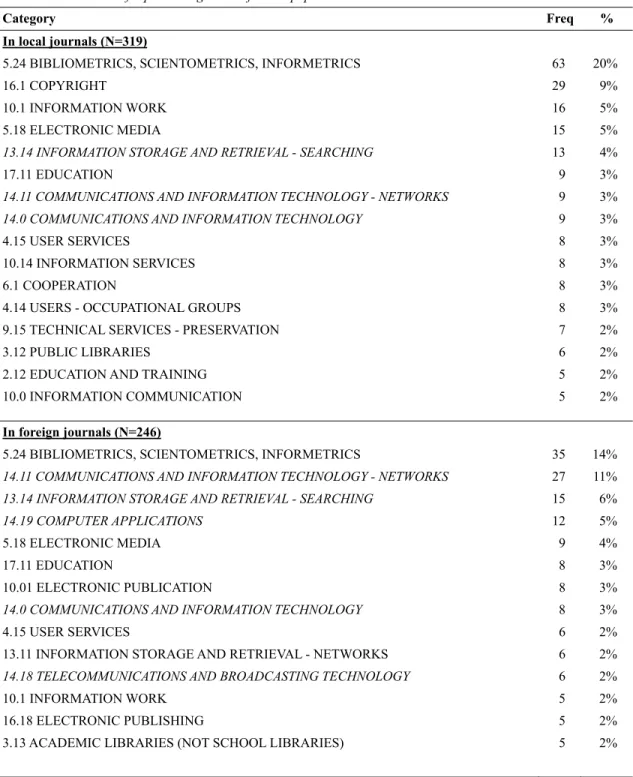
Table 10 India: Most frequent categories in journal papers
Category Freq %
In local journals (N=319)
5.24 BIBLIOMETRICS, SCIENTOMETRICS, INFORMETRICS 63 20%
16.1 COPYRIGHT 29 9%
10.1 INFORMATION WORK 16 5%
5.18 ELECTRONIC MEDIA 15 5%
13.14 INFORMATION STORAGE AND RETRIEVAL - SEARCHING 13 4%
17.11 EDUCATION 9 3%
14.11 COMMUNICATIONS AND INFORMATION TECHNOLOGY - NETWORKS 9 3%
14.0 COMMUNICATIONS AND INFORMATION TECHNOLOGY 9 3%
4.15 USER SERVICES 8 3%
10.14 INFORMATION SERVICES 8 3%
6.1 COOPERATION 8 3%
4.14 USERS - OCCUPATIONAL GROUPS 8 3%
9.15 TECHNICAL SERVICES - PRESERVATION 7 2%
3.12 PUBLIC LIBRARIES 6 2%
2.12 EDUCATION AND TRAINING 5 2%
10.0 INFORMATION COMMUNICATION 5 2%
In foreign journals (N=246)
5.24 BIBLIOMETRICS, SCIENTOMETRICS, INFORMETRICS 35 14%
14.11 COMMUNICATIONS AND INFORMATION TECHNOLOGY - NETWORKS 27 11%
13.14 INFORMATION STORAGE AND RETRIEVAL - SEARCHING 15 6%
14.19 COMPUTER APPLICATIONS 12 5%
5.18 ELECTRONIC MEDIA 9 4%
17.11 EDUCATION 8 3%
10.01 ELECTRONIC PUBLICATION 8 3%
14.0 COMMUNICATIONS AND INFORMATION TECHNOLOGY 8 3%
4.15 USER SERVICES 6 2%
13.11 INFORMATION STORAGE AND RETRIEVAL - NETWORKS 6 2%
14.18 TELECOMMUNICATIONS AND BROADCASTING TECHNOLOGY 6 2%
10.1 INFORMATION WORK 5 2%
16.18 ELECTRONIC PUBLISHING 5 2%
3.13 ACADEMIC LIBRARIES (NOT SCHOOL LIBRARIES) 5 2%
Observations:
y Bibliometrics: 20% for local journals, 14% for foreign journals y IT-oriented topics dominate the foreign journals list
DATA FOR SOUTH KOREA
Table 11 Korea: Most frequent descriptors in journal papers
Descriptor Freq %
In foreign journals (N=170)
South Korea 38 22%
Networks 17 10%
Online information retrieval 13 8%
Mobile communications 13 8% Information technology 12 7% Searching 11 6% Wireless communications 11 6% Korea 11 6% Internet 10 6% Patents 9 5% Scientometrics 9 5% Bibliometrics 8 5%
World Wide Web 8 5%
Scholarly publications 8 5% Evaluation 7 4% Classification 7 4% Knowledge management 6 4% Information communication 6 4% Text categorization 6 4% Data mining 6 4% Computer applications 5 3%
Observations:
y Korea is clearly strong in IT-oriented topics y Bibliometrics and scientometrics: 10%
Table 12 Korea: Most frequent categories in journal papers
Category Freq %
In foreign journals (N=170)
14.11 COMMUNICATIONS AND INFORMATION TECHNOLOGY - NETWORKS 27 16% 5.24 BIBLIOMETRICS, SCIENTOMETRICS, INFORMETRICS 21 12%
13.14 INFORMATION STORAGE AND RETRIEVAL - SEARCHING 19 11%
14.19 COMPUTER APPLICATIONS 14 8%
14.0 COMMUNICATIONS AND INFORMATION TECHNOLOGY 11 6%
13.13 AUTOMATIC TEXT ANALYSIS, AUTOMATIC INDEXING, MACHINE TRANSLATION 10 6%
17.11 EDUCATION 5 3%
10.11 INFORMATION COMMUNICATION - SOCIAL SCIENCES, BUSINESS
INFORMATION 5 3%
Observations:
y Bibliometrics: 12%
DATA FOR SINGAPORE
Table 13 Singapore: Most frequent descriptors in journal papers
Descriptor Freq %
In foreign journals (N=152)
Singapore 27 18%
Networks 20 13%
Online information retrieval 14 9% Knowledge management 13 9%
Searching 12 8%
World Wide Web 9 6%
Information communication 9 6% Information technology 8 5%
Evaluation 8 5%
Computer assisted instruction 7 5%
Routing 7 5%
Information seeking behaviour 6 4%
Education 6 4% Performance measures 6 4% Public libraries 6 4% Computer security 6 4% Mobile communications 6 4% Wireless communications 6 4% Communications technology 5 3% E-government 5 3%
Observations:
y A strength in information retrieval, IT-oriented topics and knowledge management. y Bibliometrics and scientometrics: 2% (not in the table)
Table 14 Singapore: Most frequent categories in journal papers
Category Freq %
In foreign journals (N=152)
14.11 COMMUNICATIONS AND INFORMATION TECHNOLOGY - NETWORKS 37 24%
13.14 INFORMATION STORAGE AND RETRIEVAL - SEARCHING 18 12%
10.1 INFORMATION WORK 10 7%
14.19 COMPUTER APPLICATIONS 8 5%
13.13 AUTOMATIC TEXT ANALYSIS, AUTOMATIC INDEXING, MACHINE TRANSLATION 7 5%
17.11 EDUCATION 6 4%
10.0 INFORMATION COMMUNICATION 5 3%
Observations:
y Strength in information retrieval and knowledge management (information work)