Asian Survey, Vol. 48, Issue 5, pp. 773–793, ISSN 0004-4687, electronic ISSN 1533-838X. © 2008
by The Regents of the University of California. All rights reserved. Please direct all requests for permis- sion to photocopy or reproduce article content through the University of California Press’s Rights and Permissions website, at http://www.ucpressjournals.com/reprintInfo.asp. DOI: AS.2008.48.5.773.
773
Jinn-guey lay is Professor of geography at national Taiwan Uni-versity, Taipei, Taiwan. Ko-Hua yap is a Ph.D. candidate and research assistant in geography at national Taiwan University. yu-Wen Chen is a Ph.D. candidate in Politics and management at the University of Konstanz, Konstanz, germany. Emails: <[email protected]>, <r90241301@ ntu.edu.tw>, <[email protected]>.
THE TRANSITION OF TAIWAN’S
POLITICAL GEOGRAPHY
JinnGuey Lay, KoHua Yap,
and YuWen Chen
Abstract
This article reveals that the panblue camp has traditionally enjoyed a stable regional stronghold in eastern and certain parts of northern Taiwan. The pan green camp was scattered but grew to form a considerable southern bloc from 1998 to 2000. Ethnic distribution can partially explain this geographical variation.
Keywords: geographical variation, partisan support, ethnic identity, Taiwan, spatial analysis
Introduction
Party competition in Taiwan has turned fierce in re-cent years. This struggle does not solely occur at the national level but also at various regional levels, triggering us to explore the regional differentia-tion of party alignment and voting preference in Taiwan in this research.
We begin with an overview of the development of party politics from 1949, when the exiled government of the Republic of China (RoC) relocated to Taiwan, to the present. During the early days, the political apparatus of Taiwan was essentially controlled by a single party—the Kuomintang (na-tionalist Party, KmT). This in fact contradicted the democratic ideals and multiple party system that the RoC Constitution adhered to. The RoC government headed by the KmT, however, postponed implementation of
both these goals and instead issued an emergency degree that froze the formation of new political parties from 1949 to 1987.1 many political ob-servers have noted the authoritarian, quasi-leninist nature of the KmT regime.2
Even so, as Rigger observes, the authoritarian rule of the KmT was “not unmitigated.”3 The regime faced an extremely difficult environment both at home and abroad. Knowing that it was not possible to fully sub-due the Taiwanese people to the new regime’s dominance, the KmT em-ployed a political strategy, election mobilization, to cultivate a Taiwanese support base.4 Elections at the level of local government were opened up to implement the KmT’s plan.5 While on the one hand permitting non-KmT members to run in elections, the party strove to ensure that electoral prospects favored the ruling party and were incapable of posing threats to the regime.6 With tactful manipulation of elections, the KmT covertly “integrated the Taiwanese into the state without relinquishing the KmT’s policy-making monopoly.”7
In 1986, the Democratic Progressive Party (DPP) came into being, born out of opposition forces.8 The DPP was founded along a distinct ethnic and political fault line, aiming to challenge the KmT’s doctrines and pro-mote self-determination for Taiwan.9 As Taiwan marched into the 1990s, the pace of political transformation accelerated. In 1993, internal rifts in the KmT led some members to establish the new Party (nP).10 mean-while, opposition forces, mostly mobilized by ethnic Taiwanese, continued to mount. The then “reform-minded” president of the KmT, lee Teng-hui, 1. Shelly Rigger, Politics in Taiwan: Voting for Democracy (new york: Routledge, 1999), pp. 63–66.
2. linda Chao and Ramon H. myers, The First Chinese Democracy: Political Life in the
Republic of China on Taiwan (baltimore, md.: Johns Hopkins University Press, 1998), pp. 8–9;
David Dahua yang, “The basis of Political legitimacy in late-Authoritarian Taiwan,” in
Legitimacy: Ambiguities of Political Success or Failure in East and Southeast Asia, ed. lynn T.
White (Singapore: World Scientific Press, 2005), pp. 67–112; Shelly Rigger, “The Democratic Progressive Party in 2000: obstacles and opportunities,” China Quarterly 168 (December 2001), pp. 944 –59.
3. Rigger, Politics in Taiwan, p. 81. 4. Ibid.
5. Rigger, “The Democratic Progressive Party in 2000,” p. 945.
6. Rigger, Politics in Taiwan, p. 82; yunhan Chu and Jihwen lin, “Political Development in 20th-century Taiwan: State-building, Regime Transformation, and the Construction of national Identity,” China Quarterly 165 (march 2001), pp. 102–29.
7. Rigger, Politics in Taiwan, p. 81. 8. Ibid., p. 148.
9. Ibid.
10. Chinghsin yu, “The Evolving Party System in Taiwan, 1995–2004,” Journal of Asian
JInn-gUEy lAy, Ko-HUA yAP, AnD yU-WEn CHEn 775
was himself a Taiwanese, and secretly endeavored to empower Taiwanese in the political landscape.11
In 1996, Taiwan held its first popular presidential election. Although the then-incumbent President lee Teng-hui won the election to sustain the KmT’s dominance, the election itself signified a result of decades of democ-ratization, which finally opened up electoral competition at the national level. During the second popular presidential election in 2000, Taiwan for the first time experienced party alternation, with the opposition DPP re-placing the KmT as the ruling party.
This stunning defeat in the 2000 presidential election deepened the in-ternal split within the KmT and led to the creation of the People First Party (PFP) the same year.12 Since then, the PFP, nP, and KmT have main-tained an intriguingly cooperative yet competing relationship. The three are often termed the “pan-blue coalition” in Taiwan’s political scene. They share similar positions on a conciliatory approach toward cross-strait rela-tions and negation of Taiwan’s de jure independence.
In the same year, the Taiwan Solidarity Union (TSU) was founded by supporters of former President lee Teng-hui as a part of the so-called pan-green force, which also includes the DPP and the minor Taiwan Indepen-dence Party (TAIP). lee left the KmT because the party attributed the 2000 fiasco to his longtime harboring of Taiwanese independence forces that undermined the survival of the party. meanwhile, within the DPP, some staunch proponents of Taiwan independence were discontented with newly elected President Chen Shui-bian’s moderate approach toward the issue. The configuration of these factors stimulated the establishment of the TSU to openly advance Taiwan’s de jure statehood.13 The TSU and DPP repre-sent the leading forces of the “pan-green coalition” contending against the blue team to govern the country. Party competition between the pan-blue and the pan-green camps has turned into a heated scene in Taiwan’s contemporary political arena. This is further demonstrated in the most recent legislative and presidential elections in 2008, where the DPP was re-placed by the KmT after eight years in office. This is the second rotation of ruling power in Taiwan.
Such competition, interestingly, exists at both the national and regional levels. An expression widely used in recent years sums this up: “beilan, nanlü” 11. For more information on lee Teng-hui’s democratic reform and conflicts with the KmT, see Tsemin lin, yunhan Chu, and melvin J. Hinich, “Conflict Displacement and Re-gime Transition in Taiwan: A Spatial Analysis,” World Politics 48:4 (July 1996), pp. 453–81.
12. yu, “The Evolving Party System in Taiwan,” p. 106.
13. yushan Wu, “Taiwan in 2001: Stalemated on All Fronts,” Asian Survey 42:1 (January/ February 2002), pp. 29–38.
(north blue, south green), indicating that the pan-blue force receives more electoral support in northern Taiwan while the pan-green coalition gains more popularity in the south.
As a matter of fact, regional differentiation of voting behavior occurs not only in Taiwan. In the U.S., the so-called “Solid South” referred to southerners’ electoral loyalties to the Democrats for almost a century after the Civil War. Although the typology of U.S. electoral geography has changed tremendously over time, regional variation of party alignment still exists in different forms.14
Similarly, in Italy there has traditionally been a political dichotomy be-tween the white and red zones. From World War Two to 1992, the north-east was often labeled the white zone; its inhabitants inclined politically toward the party Democrazia Cristiana (Christian Democracy, DC). Cen-tral Italy was termed the red zone because of widespread support there for the Partito Comunista Italiano (Italian Communist Party, PCI). As in the American case, the Italian electoral map has experienced considerable changes since 1992. Region-based political division, nevertheless, is still manifested in various ways.15
In this paper, we seek to capture how regional partisan support evolved over time in Taiwan. A comparison of the outcomes of presidential and legislative elections can be useful for answering our research question. be-fore 2008, the RoC Constitution stipulated that the president be elected every four years and legislators every three years. An amendment to the Constitution has synchronized the legislative and presidential elections to a four-year term. The first set of legislators to serve a four-year term came into office after the seventh legislative election in early 2008. Some might doubt whether presidential elections are appropriate cases for gauging par-tisan support, because these elections are usually understood as being more influenced by non-partisan factors than parliamentary elections. We believe that a comparison of these two types of elections can help us clarify this issue.
Employing spatial analysis techniques, we present the electoral results of three recent presidential elections (1996, 2000, and 2004) and four legisla-tive elections (1995, 1998, 2001, and 2004) at the township level. The 1996, 2000, and 2004 presidential elections were chosen because they were the first three direct presidential contests held in Taiwan as of the date this re-search was conducted. As for legislative elections, the first took place in
14. Jeongdai Kim et al., “A Spatial Analysis of County-level outcomes in U.S. Presiden-tial Elections: 1988–2000,” Electoral Studies 22 (December 2003), pp. 741–61.
15. michael E. Shin and John Agnew, “The geography of Party Replacement in Italy, 1987–1996,” Political Geography 21 (February 2002), pp. 221–42.
JInn-gUEy lAy, Ko-HUA yAP, AnD yU-WEn CHEn 777
1947; the elected representatives held legislative seats indefinitely until a new regulation was promulgated in the early 1990s to reshuffle the old seats. The second legislative election was subsequently held in 1992. However, the website of the Central Election Commission does not document the out-come of the 1992 election. We hence can only analyze the accessible data of the third, fourth, fifth, and sixth legislative elections, which took place in 1995, 1998, 2001, and 2004, respectively.
Section two will present how partisan support differed across regions in Taiwan. We will first examine how the geographical variation of partisan support evolved from the 1996 to the 2004 presidential elections and then similarly observe the evolution of legislative electoral outcomes from 1995 to 2004. The third section of the paper will explore the factors that con-tributed to regional differentiation of voting behaviors in these elections. Section four will discuss the implications of our findings for electoral stud-ies on Taiwan.
The Transition of Political Geography
In this section, we first look into the regional distribution of votes in Tai-wan’s 1996, 2000, and 2004 presidential elections separately. next, we ex-amine Taiwan’s 1995, 1998, 2001, and 2004 legislative elections, respectively. And then we compare the outcomes of these elections to see how pan-blue and pan-green territories changed over time.
methodologically, we introduce spatial analysis techniques that have gradually been adopted for electoral studies in various countries in recent years. Spatial analysis techniques allow us to capture not only electoral re-sults in each township but also, and more importantly, the relationships among electoral outcomes for neighboring townships (i.e., the existence of spatial autocorrelation).16 For instance, if a party obtains high support levels in Town A, it might see a similar good performance in neighboring towns—or the opposite. In the former case, Town A would then be consid-ered part of this party’s turf. In the latter case, Town A is an outlier; this party performs well only in this town but not nearby. Spatial analysis tech-niques enable the precise detection and measurement of such relationships, demonstrating whether they reach statistical significance or not. This differs from conventional techniques, which basically map out the electoral result of each township but do not permit the detection of statistical significance of spatial association for these results.
16. According to Cliff and ord’s definition, “If the presence of some quality in a county of a country makes its presence in neighboring counties more or less likely, we say that the phenomenon exhibits spatial autocorrelation.” See A. D. Cliff, and J. K. ord, Spatial
To name a few examples of the application of spatial analysis techniques in electoral studies, Kim, Elliott, and Wang have used them to study Dem-ocrats’ and Republicans’ geographical clusters in American presidential elections. Darmofal examines the spatial structuring of macro turnout in American history. In addition, some researchers have used spatial analysis to investigate the importance of neighborhoods and of diffusion. This is evident in Cho’s 2003 study on the distribution of donation networks for political campaigns by Asian Americans, as well as vilalta y Perdomo’s 2004 research on the geographical diffusion of party competition in urban mex-ico. below, we will demonstrate how such techniques can contribute to our research on Taiwan’s electoral politics.17
Regional Differentiation in Taiwan’s 1996,
2000, and 2004 Presidential Elections
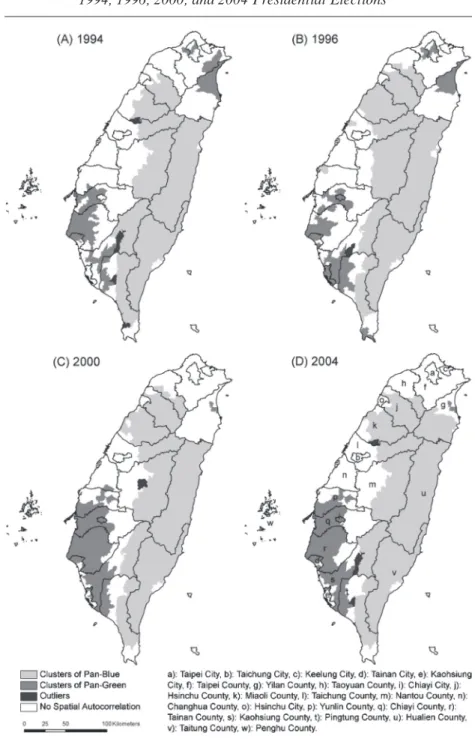
The first direct presidential election was held in 1996, during which then-incumbent KmT president lee Teng-hui was challenged by Peng ming-min of the DPP, lin yang-kang (under the endorsement of the nP), and “KmT-politician turned independent” Chen lü-an. As a simple categori-zation, Peng ming-min represented the pan-green forces while the rest of the candidates belonged to the pan-blue camp. The result of the election was that the KmT won by 54% of the vote;18 the DPP came in second with around 21%. With the assistance of spatial analysis techniques, we discover that a large part of eastern Taiwan (e.g., Hualien County, Taitung County, and indigenous regions of other counties); certain regions in the north (e.g., Hsinchu County, miaoli County); and some fragmentary areas besides the counties above were the pan-blues’ stronghold (see Figure 1 [b]).
The pan-green turf, on the other hand, was clustered in parts of southern and northern Taiwan. In the south, certain parts of the counties of Chiayi, Tainan, Kaohsiung, and Pingtung were filled with pan-green supporters. northern Taiwan, particularly Taipei metropolitan Area and yilan County, 17. Kim et al. “A Spatial Analysis,” pp. 741–61; David Darmofal, “The Political geog-raphy of macro-level Turnout in American Political Development,” Political Geoggeog-raphy 25 (February 2006), pp. 123–50; Wendy K. Tam Cho, “Contagion Effects and Ethnic Contribu-tion networks,” American Journal of Political Science 47:2 (April 2003), pp. 368–87; Carlos Javier vilalta y Perdomo, “The local Context and the Spatial Diffusion of multiparty Com-petition in Urban mexico, 1994 –2000,” Political Geography 23 (may 2004), pp. 403–23.
18. Peng ming-min captured 21.13%, lin yang-kang 14.9%, and Chen lü-an 9.98% of the vote. This information is obtained from the government of the Republic of China, Central Election Commission, <http://www.cec.gov.tw>, accessed April 12, 2007 (hereafter, RoC CEC database). For more detail, see <http://210.69.23.140/cec/cechead.asp>. For more information on the 1996 presidential election, see Rigger, Politics in Taiwan, pp. 174 –77.
figure 1 Regional Differentiation of Electoral Behavior in Taiwan’s
1994, 1996, 2000, and 2004 Presidential Elections
SoURCE: by Ko-Hua yap, based on data from the RoC CEC database, at <http://210.69.23. 140/cec/cechead.asp>.
also were largely pan-green (see Figure 1 [b]). Interestingly, central Taiwan was a transitional zone: voting behavior was less spatially clustered there. As Figure 1 (b) illustrates, the overall partisan schism between north and south was not as obvious as the one between western and eastern Taiwan. Some observers point to the so-called lee Teng-hui effect in the 1996 presidential election. The KmT’s lee shared some political positions with the rival DPP. This helped lee to garner a large number of votes from traditional pan-green supporters while losing some support from conven-tional pan-blues. Furthermore, Chinese military threats to Taiwan prior to the election induced many pan-green supporters to switch their votes to lee Teng-hui.
In a nutshell, the factor of swing voters played a role in the outcome of the 1996 presidential election. This begs the question of whether the 1996 election can be seen as genuinely reflecting the distribution of partisan sup-port in Taiwan. lee and Hsu have tried to tackle the issue of swing voters in their 2002 study;19 readers can refer to their work for further information. In this paper, we take an alternative and indirect approach by comparing the geographical pattern of partisan support in the 1996 presidential elec-tion with that of the 1994 provincial, gubernatorial, and mayoral elecelec-tions to examine the influence of swing voters or the lee Teng-hui effect.20
Prior to the 1996 presidential election, in 1994 major elections were held nationwide for Taiwan’s top-level executive posts. Although in 1994 three electoral districts existed, Taiwan Province, Taipei City, and Kaohsiung City, their demarcation essentially resembles that of a single nationwide dis-trict. Taiwan Province, for instance, covered 98% of the territory of Taiwan and 85% of the eligible voters. This makes the comparison of the 1994 and 1996 elections justifiable.
As our result indicates, the pattern of political geography of the 1996 election was virtually similar to the pattern shown in the 1994 election. The pan-greens had scattered strongholds throughout southern Taiwan, while 19. Peishan lee and yungming Hsu, “Southern Politics? Regional Trajectories of Party Development,” Issues and Studies 38:2 (June 2002), pp. 29–38.
20. The three elections were conducted on December 3, 1994. In the provincial gubernato-rial election, James Soong (of the KmT) won the election by 56.22% of the vote. Chen Ding-nan (of the DPP) garnered 38.72%, Chu Kao-cheng (of the nP) 4.31%, independent Tsai Cheng-chi 0.44%, and independent Wu Hsin 0.3% of the vote. In the Taipei mayoral election, Chen Shui-bian (of the DPP) won the election by 43.67% of the vote, while Jaw Shaw-kong (of the nP) obtained 30.17%, Huang Da-chou (of the KmT) 25.89%, and independent Ji Rong-chi 0.28% of the vote. In the Kaohsiung mayoral election, Wu Den-yih (of the KmT) won the election by 54.46% of the vote, while Chang Chun-hsiung (of the DPP) obtained 39.29%, Tan A-gen (of the nP) 3.45%, independent Shih Chung-hsiang 1.78%, and Cheng De-yao 1.02% of the votes. See RoC CEC database.
JInn-gUEy lAy, Ko-HUA yAP, AnD yU-WEn CHEn 781
their northern turf was clustered in the Taipei metropolitan area and yilan County. This study supports the premise that even if the lee Teng-hui ef-fect played an important role in the 1996 election, it did not significantly alter the spatial distribution of the pan-blue and pan-green strongholds at that time (see Figure 1 [A]).
The second popular presidential election took place in 2000. There were five candidates: lien Chan of the KmT, Chen Shui-bian of the DPP, li Ao of the nP, the “KmT-politician turned independent” James Soong,21 and independent Hsu Hsin-liang. Since Hsu Hsin-liang and li Ao together garnered less than 1% of the vote, we deliberately exclude them from our analysis. Rather, we center on how the votes for pan-blue (lien Chan and James Soong) and pan-green (Chen Shui-bian) were distributed locally in this election.
The DPP’s Chen won the election with 39.3% of the vote, ending the KmT’s 50-year grip on the presidency.22 With spatial analysis, we discover no significant changes in the pan-blue stronghold from 1996 to 2000. In the 2000 presidential election, pan-blue still enjoyed strong support bases in most of eastern Taiwan and certain parts of the north (see Figure 1 [C]). Strikingly, there was an apparent growth in the pan-green support base in southern Taiwan. Electorates in the counties of yunlin, Chiayi, Tainan, Kaohsiung, and Pingtung were able to form a huge bloc to support the pan-greens. In addition, as with the 1996 election, central Taiwan was a transition zone (see Figure 1 [C]).
before proceeding to the 2004 election, we would like to make a brief remark on the disappearance of the pan-green clustering in Taipei metrop-olis and yilan County in the 2000 presidential election, as shown in Figure 1 (C). In fact, this illustration does not imply a decrease of vote share for the greens in these northern regions. What it does tell is that pan-green strongholds became more clustered in southern Taiwan.
The 2004 election was the third direct presidential election in Taiwan. Then-incumbent President Chen Shui-bian (of the pan-green) was chal-lenged by a joint force led by lien Chan and James Soong (of the pan-blue).23 This election was marred by a failed assassination attempt on the DPP candidates on the eve of the election, which led many political ob-servers to believe that the incident had boosted the pan-green victory by
21. Rigger, “The Democratic Progressive Party in 2000,” p. 946.
22. Among other candidates, James Soong won 36.84%, lien Chan 23.1%, Hsu Hsin-liang 0.63%, and li Ao 0.13% of the vote. See the RoC CEC database.
23. Steven Chan, “Taiwan in 2004: Electoral Contests and Political Stasis,” Asian Survey 45:1 (January/February 2005), pp. 54 –58.
harvesting sympathy votes.24 The pan-green force captured 50.11% of the vote, barely edging out the pan-blue camp, which garnered 49.89%.25
Steven Chan’s review of Taiwan’s 2004 electoral competition touched upon how voting preferences varied across regions. His observation is in line with the taken-for-granted notion of the “north-south divide,” that is, the pan-green force won more votes from the south while the pan-blue team fared better in the north and in large metropolitan areas (e.g., Taipei).26
nonetheless, as our spatial analysis of the previous two presidential elec-tions and this 2004 election consistently reveals, the conventional belief in the north-south split was never as remarkable as the east-west divide. The pan-green parties were indeed more capable of capturing electoral sup-port in southern Taiwan, such as in the counties of yunlin, Chiayi, Tainan, Kaohsiung, and Pingtung, except for the indigenous people’s regions (i.e., the eastern part of these counties). The pan-blue coalition, however, did not necessarily gain more popularity in northern Taiwan, except in Hsin-chu County, miaoli County, and some other fragmentary strongholds (see Figure 1 [D]).
Spatial patterns contrast starkly between the east and the west of Tai-wan. Eastern Taiwan was widely dominated by pan-blue supporters, whereas western Taiwan was not necessarily pan-blue territory. As noted earlier, the south of western Taiwan was largely occupied by pan-green supporters. lastly, as with the previous two elections, central Taiwan was a transition zone (see Figure 1[D]).
Regional Differentiation in 1995, 1998, 2001, and 2004 Legislative Elections
The subjects of analysis in this section are the 1995, 1998, 2001, and 2004 legislative elections. The pan-blue strongholds exhibited rather similar pat-terns of geographic distribution in these four elections. That is, they were clustered in eastern Taiwan, Hsinchu County, miaoli County and some other fragmentary areas. To avoid repetition, we will not illustrate this pat-tern again in the following analysis, but rather focus on the distribution of pan-green strongholds.
24. Cal Clark, “The Paradox of the national Identity Issue in Chen Shui-bian’s 2004 Presidential Campaign: base Constituencies vs. the moderate middle,” Issues and Studies 41:1 (march 2005), pp. 53–86; Jacques delisle, “The Aftermath of Taiwan’s Presidential Election: A Symposium Report,” Philadelphia: Foreign Policy Research Institute, June 18, 2004, <http:// www.fpri.org/enotes/20040618.asia.delisle.aftermathtaiwanelection.html>, accessed April 12, 2007.
25. See RoC CEC database. 26. Chan, “Taiwan in 2004,” p. 56.
JInn-gUEy lAy, Ko-HUA yAP, AnD yU-WEn CHEn 783
During the 1995 legislative election,27 the support base of the DPP (pan-green) was rather dispersed. The strongholds were located in certain parts of northern, central, and southern Taiwan (see Figure 2 [A]). Similar to what we have found during the presidential elections, the partisan schism between north and south was not evident.
next was the 1998 legislative election;28 the DPP (pan-green) expanded its stronghold in southern Taiwan. The north-south divide was still less remarkable (see Figure 2 [b]). The result of the 2001 legislative election engendered a contentious situation in which the pan-blue camp captured only a thin majority over the pan-green coalition.29 The support base of the DPP and the TSU (pan-green) continued to expand in the south (see Figure 2 [C]).
The last election under analysis is the 2004 legislative election.30 The northern Taiwan stronghold of the DPP and the TSU (pan-green) dimin-ished, while their southern redoubt expanded northward (see Figure 2 [D]).
Evolution of the Pan-Blue and Pan-Green Strongholds
A comparison of electoral maps in Figure 1 and Figure 2 yields several findings. With regard to the presidential elections, we discover that the pan-blue forces had already shown significant geographical clustering in eastern Taiwan, Hsinchu County, and miaoli County since the 1996 elec-tion. The pan-blue support base did not vary much over time.
The pan-green turf, however, has changed. In the 1996 presidential elec-tion, the pan-green forces were significantly clustered in certain parts of northern and southern Taiwan. From 1996 to 2000, pan-green’s influence crystallized into the southern bloc, as shown in the 2000 presidential elec-tion. meanwhile, however, geographical clustering of the pan-green forces in northern Taiwan became relatively less significant in the 2000 presiden-tial election. The southern bloc continued to support the pan-green camp in the 2004 presidential election. Inferring from this, we conclude that the “solid south” for the pan-green team took shape from 1996 to 2000. lastly, 27. The KmT garnered 46.1%, DPP 33.2%, nP 13.0%, and other smaller parties or inde-pendent candidates obtained the remaining 7.7% of votes. See RoC CEC database.
28. The KmT captured 46.4%, DPP 29.6%, nP 7.1%, and other smaller parties or inde-pendent candidates obtained the remaining 16.9% of votes.
29. The KmT garnered 28.6%, DPP 33.4%, nP 2.6%, the newly founded PFP captured 18.6%, and the TSU 7.8% of votes. other smaller parties or independent candidates obtained the remaining 9.0% of the votes.
30. The KmT obtained 32.8%, DPP 35.7%, PFP 13.9%, TSU 7.8%, and other smaller parties or independent candidates obtained the remaining 9.8% of votes.
1995, 1998, 2001, and 2004 Legislative Elections
JInn-gUEy lAy, Ko-HUA yAP, AnD yU-WEn CHEn 785
central Taiwan had always been a transition zone, displaying no obvious geographical clustering for any partisan groups.
We find the geographical transformation of partisan support bases re-vealed by the four legislative elections resembles the pattern exhibited in presidential elections. The pan-blue strongholds did not change much over the years. The pan-green support base was initially rather dispersed and not stable. During the period 1998–2001, interestingly, the pan-greens started to consolidate their strongholds in southern Taiwan.
Explanations
This section aims to explore the causes of the observed spatial pattern. Through secondary literature review, we first address the linkage between ethnic identity and partisan support in Taiwan. Then we posit that geo-graphical distribution of different ethnic groups has contributed to the ob-served regional variation of partisan support.
Ethnic Identity and Partisan Support
Taiwan’s electoral mosaic is a product of a long history of social, eco-nomic, political, and cultural processes. Scholars have discovered that sup-porters of the two major political forces in Taiwan are separated from one another by three social cleavages, and they cross-cut one another: (1) Tai-wanese vs. Chinese national identities, (2) democratic vs. authoritarian ideologies, and (3) Taiwanese ethnic consciousness vs. Chinese ethnic con-sciousness.31 national identity, in particular, is a much contested issue and is highly associated with voters’ partisan affiliation in Taiwan.
Furthermore, various studies have pointed out the existence of a signifi-cant correlation between national identity and ethnic identity in Taiwan. overall, people who identify themselves as Hoklo or/and Hakka are more likely to have a Taiwanese national identity, while those with mainlander identity are most likely to have a Chinese national identity.32 Accordingly, quite a number of studies have directly used ethnic identity to analyze par-tisan competition in Taiwan.
31. naiteh Wu, “Shehui Fenshi Han Zhengdang Jingzheng: Jieshi guomindang Weihe Jixü Zhizheng” [Social cleavages and political competition: Why is there no “stunt election” in Taiwan?], in Zhongyangyanjiuyuan Minzuxüe Yanjiusuo Jikan [bulletin of the Institute of Ethnology, Academia Sinica] 78 (June 1995), pp. 101–30.
32. naiteh Wu, “gujia Rentong yu Zhengdang Zhichi: Taiwan Zhengdang Jingzheng De Shehui Jichu” [Party support and national identities: Social cleavages and party competition in Taiwan], in ibid., 74 (november 1993), pp. 33–61; naiteh Wu, “Rentong Chongtu Han Zhengzhi xinren: xianjieduan Taiwan Zuqün Zhengzhi De Hexin nanti” [The identity con-flict and political trust: Core dilemmas of current ethnic politics in Taiwan], in Taiwan
Wang in his series of studies indicates that the KmT’s authoritarian rule in the early days was largely built upon ethnic fault lines, thus gener-ating a dominant-subordinate relationship between the mainlanders and Hoklo/Hakka. The opposition movement “Dangwai” (outside the Party), born out of an anti-KmT sentiment, was similarly mobilized along ethnic lines. The pan-green alliance under discussion here actually had its origin in these early opposition movements. Dangwai activists not only advocated democratizing the regime but also pushed forward the emergence of a Tai-wanese nationalism. The latter political discourse was constructed mainly upon the early inhabitants’ (particularly Hoklo) historical experiences with the island of Taiwan, in distinction from the mainlanders’ connections with the Chinese mainland. Through the mobilization of ethnic groups and the consolidation of their ethnic consciousness, a distinct Taiwanese national identity came into being and has constantly contested the main-landers’ Chinese national identity in various political scenes thereafter.33
Principally but not exclusively, mainlanders are more prone to support reunification with China or an accommodating approach toward cross-strait relations. Politically, they lean toward the pan-blue alliance. Hoklo, in con-trast, are more supportive of a distinct Taiwan nationalism or de jure Tai-wan independence, and thus politically lean toward the pan-green camp.34 The partisan orientation of the Hakka is somewhere in between.35
We argue that the factor of “national identity” played a pivotal role in generating the spatial patterns observed during presidential and legislative 33. Fuchang Wang, “Zuqün Tonghua yu Dongyuan: Taiwan minzhong Zhengdang Zhichi Zhi Fenxi” [Ethnic assimilation and mobilization: An analysis of party support in Taiwan], in Zhongyangyanjiuyuan Minzuxüe Yanjiusuo Jikan 77 (June 1994), pp. 1–34; Fuchang Wang, “Zuqün yishi, minzu Zhuyi yu Zhengdang Zhichi: 1990 niandai Taiwan De Zuqün Zheng-zhi” [Ethnic consciousness, nationalism, and party support], in Taiwan Shehuixüe Yanjiu [Tai-wan Sociological Review] 2 (July 1998), pp. 1– 45; Fuchang Wang, Dangdai Tai[Tai-wan Shehui De
Zuqün Xiangxiang [Ethnic imagination in contemporary Taiwan] (Taipei: Social Publishing
Co., ltd., 2003).
34. John Fusheng Hsieh, “The 2000 Presidential Election,” p. 13; Shingyuan Sheng and yiyan Chen, “Zhengzhi Fenqi yu Zhengdang Jingzheng: 2001 nian lifaweiyuan xüanjü De Fenxi” [Political cleavage and party competition: An analysis of the 2001 legislative yuan election], in Xüanjü Yanjiu [Journal of Electoral Studies] 10:1 (may 2003), pp. 7– 40; Fuchang Wang, “Zuqün Jiechu Jihui? Haishi Zuqün Jingzheng? bensheng minnanren Zuqün yishi nei-han yu Diqü Chayi moshi Zhi Jieshi” [Ethnic contact or ethnic competition? Explaining re-gional differences in ethnic consciousness among Hoklos in Taiwan], in Taiwan Shehuixüe 4 (December 2002), pp. 11–74.
35. John Fusheng Hsieh, “The 2000 Presidential Election,” p. 13. Hakka are less support-ive of the pan-green than Hoklo because the Hakka feel that the pan-green represents pre-dominantly Hoklo interests. This can be evidenced in the composition of members in the pan-green parties: most of them are Hoklo, they tend to speak in Hoklo, and stress chiefly the Hoklo values and interests in their conduct of political activities. For more information, see Wang, Dangdai Taiwan Shehui, pp. 137– 40.
JInn-gUEy lAy, Ko-HUA yAP, AnD yU-WEn CHEn 787
elections. However, no appropriate database has existed of the regional distribution of citizens with different national identities to aid in analysis. Fortunately, because ethnic identity and national identity are highly corre-lated and because we do have proper data on the geographic distribution of ethnic identity, we decided to use this data to explain regional differen-tiation of partisan support.
In Taiwan, ethnic groups differentiate significantly across space. This phe-nomenon arises from three crucial historical phases of development. The first phase was when Taiwan was under the control of the Qing empire in the 17th century, during which a large Han population emigrated from mainland China. The authorities then maintained strict policies to restrict Han people from entering mountainous areas where the indigenous people of Taiwan resided. As a consequence, the settlements of Han and indige-nous people were segregated geographically.
The second stage of development happened when emigrants from differ-ent parts of mainland China settled in places that resembled their original living environment on the mainland. Schisms among people with different geographical origins, such as Hoklo and Hakka, gradually took shape. both Hoklo and Hakka were considered sub-ethnic branches of the Han people. There was constant fighting between them, further reinforcing their exist-ing geographical demarcation.36
After World War Two, new waves of emigrants from mainland China set-tled in northern Taiwan and various urban regions, where they easily found employment opportunities and residences.37 Hence, a new division between the so-called mainlanders and the older habitants of Taiwan was created.38 Even today, a large part of the latter group tends to identify themselves as “Taiwanese” in distinction from the mainlanders.
To the extent that these ethnic (or to be more precise, sub-ethnic) groups are segregated, geographic clustering of voting behavior may emerge. In an election, if a political party or candidate is particularly popular among a specific ethnic or sub-ethnic group, the electoral result may exhibit spa-tial patterns, even though the mechanisms generating these patterns are not necessarily a spatial process per se but rather are related to the distri-bution of a specific ethnic population.
36. Tienfu Shih, Qingdai Zaitai Hanren De Zujifenbu Han Yuanxiang Shenghuo Fangshi [Han Chinese settlement in Taiwan during the Qing Dynasty and their original life style] (Taipei: national Taiwan normal University, Department of geography, 1987).
37. John Fusheng Hsieh, “The 2000 Presidential Election and Its Implications for Tai-wan’s Domestic Politics,” Issues & Studies 37:1 (January/February 2001), pp. 1–19.
38. The KmT’s purge of local inhabitants, particularly elites, as evidenced in the 2–28 In-cident of 1947, also sharpened the schism between the mainlanders and older residents of Taiwan.
Regression Analysis
In this section, regression analyses are conducted to test the ethnic ex-planation. We treat the vote share of the pan-green as a dependent vari-able and the ethnic composition of each township as independent varivari-ables. The data on ethnic composition are harvested from the 2004 survey of the Council of Hakka Affairs. note that we are aware of the limitation of this survey. There is a possible bias inflating the size of Hakka communities, because the proportion reported is much larger than that in the 1966 cen-sus. After that census, no other comprehensive effort was made to docu-ment the Hakka population except for the 2004 survey. We hence have to rely on this data source.
This Council of Hakka Affairs survey used self-reporting of ethnic iden-tity rather than primordial attributes per se to define ethnic groups in Tai-wan. It was conducted on the basis of random sampling of 100 interviewees in each township. The survey found that in Taiwan, 78.6%, 19.5%, 16%, and 5.3% of respondents identify themselves as Hoklo, Hakka, mainland-ers, and indigenous peoples, respectively. The sum of these percentages ex-ceeds 100% because the survey allowed respondents to report multiple identities. For instance, one person could simultaneously identify himself or herself as being Hoklo and Hakka.
Respective percentages of Hakka, mainlander, or indigenous identities were taken into regression models. When respondents identify themselves with more than one ethnic group besides Hoklo, they fall into the three in-dependent variables. Therefore, the remainder of ethnic composition in each township approximates to the percentage of respondents identifying themselves solely as Hoklo. This is treated as a reference category.
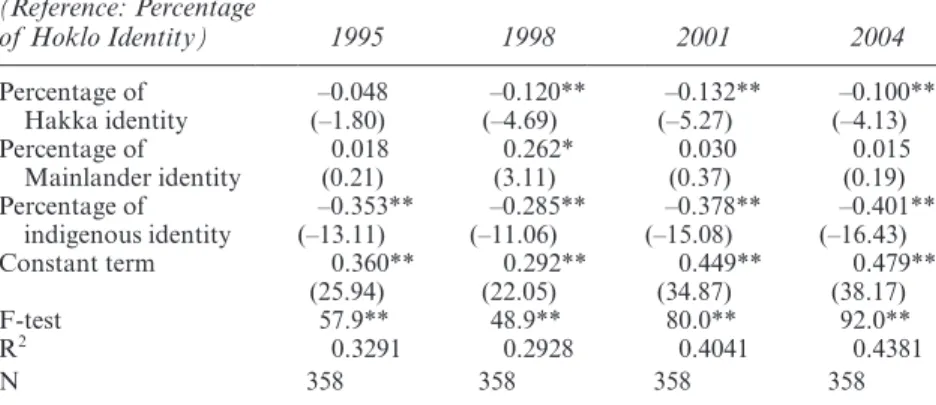
The results of the regression analyses yield several findings. First of all, the higher the percentage of residents identifying themselves as Hakka or indigenous peoples in a township (compared to those who identify them-selves solely as Hoklo), the more unfavorable the township was for the pan-green. because mainlanders were minorities in all townships, their in-fluence on electoral outcomes was less stable. However, in the 2000 and 2004 presidential elections, townships with more mainlanders were also shown to be disadvantageous for the pan-greens (see Tables 1 and 2). This supports our argument that ethnic distribution played a role in the re-gional variation of partisan support in Taiwan.
In addition, we find out that the factor of ethnic distribution was much more influential in the outcomes of presidential elections (Table 1) than of legislative elections (Table 2). This was particularly notable in the 2000 and 2004 presidential elections, during which the explanatory ability of ethnic distribution exceeded 60%.
table 1 Ethnic Distribution and the Regional Variation of Partisan
Support in Presidential Elections
Ethnic Distribution (Reference: Percentage
of Sole Hoklo Identity)(Gubernatorial)1994 1996 2000 2004
Percentage of Hakka identity (–6.28) –0.123** (–9.31)–0.130** (–11.52)–0.243** (–10.36) 0.226** Percentage of mainlander identity (–0.80) –0.052 0.121*(2.64) (–3.48)–0.241** (–5.81)–0.417** Percentage of indigenous identity (–19.63) –0.385** (–14.10)–0.198** (–21.88)–0.462** (–24.78)–0.543** Constant term 0.448** 0.222** 0.514** 0.659** (44.49) (30.71) (47.26) (58.54) F-test 133.3** 88.0** 187.8** 229.3** R2 0.530 0.427 0.614 0.660 n 358 358 358 358
SoURCES: by Ko-Hua yap, based on data from ibid., Figure 2; 2004 survey of the Council of Hakka Affairs, <http://www.hakka.gov.tw/mp.asp?mp=1>.
noTE: numbers shown in the table are unstandardized regression coefficients; numbers in parentheses are the t-value.
* Significant at the 0.01 level (two-tailed test). ** Significant at the 0.001 level (two-tailed test).
table 2 Ethnic Distributions and the Regional Variation of Partisan
Support in Legislative Elections
Ethnic Distribution (Reference: Percentage of Hoklo Identity) 1995 1998 2001 2004 Percentage of Hakka identity (–1.80)–0.048 (–4.69)–0.120** (–5.27)–0.132** (–4.13)–0.100** Percentage of mainlander identity 0.018(0.21) 0.262*(3.11) 0.030(0.37) 0.015(0.19) Percentage of indigenous identity (–13.11)–0.353** (–11.06)–0.285** (–15.08)–0.378** (–16.43)–0.401** Constant term 0.360** 0.292** 0.449** 0.479** (25.94) (22.05) (34.87) (38.17) F-test 57.9** 48.9** 80.0** 92.0** R2 0.3291 0.2928 0.4041 0.4381 n 358 358 358 358
SoURCE: by Ko-Hua yap, from RoC CEC database; 2004 survey of the Council of Hakka Affairs.
noTE: numbers shown in the table are unstandardized regression coefficients; numbers in the parentheses are the t-value.
* Significant at the 0.01 level (two-tailed test). ** Significant at the 0.001 level (two-tailed test).
After the year 2000, the influence of ethnic distribution on both the presidential and the legislative elections has increased notably. This might be one of the reasons why the political landscape of Taiwan exhibited sig-nificant changes after 2000. However, there is so far insufficient empirical evidence to buttress this speculation; it awaits future research efforts.39
From the constant terms of regression models, we can see that although Hoklo are more likely to support pan-green, this inclination is not over-whelming. Take the 2004 presidential election for example. The constant term is 0.659. This implies that even in townships where only Hoklo reside in (i.e., the percentages of Hakka, mainlanders, and indigenous residents are zero), green does not obtain the support of all residents. The pan-green vote share is only predicted to be 65.9%. Also, this suggests that even ethnic identity cannot be equated with national identity; as long as there exists a high correlation between ethnic identity and national iden-tity, partisan support will exhibit regional variation.
before concluding this paper, we would like to bring attention to a few important issues pertaining to our research. First, this paper focuses on the aggregate level of geographic distribution, not the individual level of parti-san forces in Taiwan. At the individual level, we can easily spot exceptions, such as mainlanders who support the pan-green parties or Hoklo who are on the side of pan-blue forces. The individual level is not our concern in this research. It is crucial to distinguish these two types of studies so that we will not be misled to make false conclusions. Second, the use of ethnic iden-tity as an independent variable faces constraints. Although our regression analyses confirm that ethnic identity has a certain explanatory utility (es-pecially regarding two-thirds of the regional variation of partisan support in the 2004 presidential election), we should not ignore the fact that ethnic identity does have its limitations in explaining the elections studied.
Apart from ethnic distribution, contextual effects like the operation of local factions can also exert an impact on electoral outcomes. This might 39. The only exception might lie in Wang’s comments on the 1998 Taipei mayoral election. In this election, incumbent mayor Chen Shui-bian of the DPP was defeated by KmT chal-lenger ma ying-jeou. In the eyes of many political observers, Chen’s defeat came as a surprise as he had won recognition for his contributions to Taipei City in his term. According to the exit polls released by the press and media immediately after the election, more than 80% of main-landers voted for ma. by contrast, the Hoklo electorate did not unite to vote for any particu-lar candidate. Wang argues that this particu-largely explains ma’s victory in this election. He also surmises that the 1998 election might have taught a lesson to Hoklo electorates with a pan-green inclination. When Chen ran for the presidential election in 2000, Hoklo electorates in southern Taiwan united to vote for Chen, giving him a high percentage of votes in the south. Inferring from Wang’s observation, one can postulate that with the boost of political mobili-zation, ethnic distribution could have played a role in the 1998 election and further affected the subsequent 2000 election. This hypothesis, however, awaits testing in future research.
JInn-gUEy lAy, Ko-HUA yAP, AnD yU-WEn CHEn 791
explain why although Hoklo communities were dominant ethnic groups both in central and southern Taiwan, the political geographies of these two regions differ. bearing these constraints in mind, we cautiously conclude that ethnic distribution can partially explain the studied spatial patterns but its explanatory ability is not sufficient.40
Conclusion
Complicated factors inherent in the development of Taiwan’s history have prompted geographical clustering of voting behavior in contemporary pres-idential and legislative elections. In legislative elections, the “solid south” took form from 1998 to 2001. In presidential elections, the “solid south” took shape from 1996 to 2000. Combining the observations drawn from legisla-tive and presidential elections, we can say that the “solid south” essentially took shape from 1998 to 2000 and continued to express its loyalty to the pan-green camp in the 2004 presidential and legislative elections. The po-litical map of northern Taiwan contains more diversity. It has traditionally encompassed both pan-blue and pan-green strongholds as well as some transition zones. Eastern Taiwan has historically been a pan-blue strong-hold and continued to be so in the presidential election in 2004. Central Tai-wan, interestingly, has always been the transition zone between the pan-blue and the pan-green heartlands. generally speaking, it is difficult to predict electoral outcomes in transition zones. In order to secure an electoral vic-tory in this kind of area, both political alliances must put forth more ef-fort, thus exacerbating partisan competition there.
The significance of this article lies in pointing out that partisan support in Taiwan exhibits significant regional differences. Party competition is fierce at the regional level, with each political force being dominant in cer-tain regions. Having a firm grasp of regional distribution of partisan sup-port is crucial for the survival of political parties. both in Taiwan and in other countries, we have seen examples of how such spatial analysis helps politicians understand the art of redrawing electoral districts to improve their prospects. In light of the recent reform to redraw electoral districts and modify the legislative election format, this is certainly an issue of im-portance for prospective candidates.41 For instance, in areas with a distinct and stable partisan orientation, there would not be a huge difference in electoral outcomes even if the constituencies are redivided. Accordingly, it 40. We also examine the impact of socioeconomic variables, such as educational level, employment, and income. We find that the explanatory ability of these variables is fairly low and cannot be compared with that of the variable of ethnic identity.
41. The new legislative reform halved the total number of legislative seats from 225 to 113 in the 2008 legislative election. The old “single-vote, multiple-member district” system is re-placed by a “two-vote, single-member district” system.
is not useful for parties to consider employing redistricting strategies to affect an electoral outcome in favor of their interests. In such case, parties might as well consider encouraging electorates in these areas to move to regions where the election result is more unsettled, in order to guarantee victory on these uncertain battlefields.
The present paucity of surveys and databases has limited our explora-tion into the factors that gave birth to the studied spatial patterns. This study would be ameliorated if we could further differentiate how the elec-torates’ national identities and ethnic identities vary across regions, as well as examine the role of any diffusion mechanism that might have influenced (and harmonized) adjacent regions’ partisan preferences. Future research should be dedicated to exploring these themes.
* * *
Appendix: Methodology
In this paper, we are interested in detecting the existence of spatial auto-correlation, that is, the degree of relationship between neighborhoods, in Taiwan’s presidential and legislative elections. luc Anselin proposes a “local Indicators of Spatial Association,” or lISA, to help detect spatial autocorrelation at the local level.42 The local moran’s I statistic is
Ii = (xi – ¯x)
∑
n j=1Wij (xj – ¯x) ————– n∑
i=1(xi – ¯x) 2Wij is a spatial weights matrix that records whether there exists a neighbor-ing relationship between area unit i and area unit j. After normalization,43 if the z-score of the area units’ Ii is larger than 1.96, there is significant spatial clustering. This implies that an area’s attribute is similar to its neighboring areas. Two scenarios are both counted as spatial clustering. The first is referred to as the “hot spot” phenomenon; it occurs when the values of the observed area itself as well as the surrounding areas are high. The second is the “cold spot” phenomenon, referring to the situation when the values of the observed area and its neighboring areas are all low. In 42. For more information, see luc Anselin, “local Indicators of Spatial Association-lisa,” Geographical Analysis 27 (January 1995), pp. 91–115.
43. The expected value and standard deviation of Ii are obtained on the basis of 999 per-mutations. In other words, we randomly redistribute the x value of every township and re-calculate Ii. This procedure is performed 999 times.
JInn-gUEy lAy, Ko-HUA yAP, AnD yU-WEn CHEn 793
this research, we use the moran Scatter Plot developed by Anselin to iden-tify hot spots and cold spots.44
If the z-score of the area units’ Ii is under –1.96, there is significant spa-tial outlier. This indicates that the attribute of an area is dissimilar to its neighboring areas. If it falls between 1.96 and –1.96, there is no significant spatial autocorrelation.
moreover, we should note that the electoral outcome of every township was obtained from the online database of the Central Election Commis-sion.45 We then use geoDa46 developed by luc Anselin to detect spatial autocorrelation.
44. luc Anselin, “The moran Scatter Plot as an ESDA Tool to Assess local Instability in Spatial Association,” in Spatial Analytical Perspectives on GIS, ed. manfred m. Fischer, Hank J. Scholten and David Unwin (london: Taylor & Francis, 1996), pp. 111–25.
45. As Kinmen County and lienchiang County are distant from the Taiwan island, we exclude these two areas in our analysis and focus on electoral results on the main island of Taiwan.
46. geoDa can be obtained from the Center for Spatially Integrated Social Science (CSISS), <http://www.csiss.org/clearinghouse/geoDa/>, accessed September 23, 2007.