Sensor Data Aggregation for Resource Inventory
Applications
Tsung-Han Lin
†Department of Electrical Engineering National Taiwan University
Taipei, Taiwan [email protected]
Polly Huang
Department of Electrical Engineering National Taiwan University
Taipei, Taiwan [email protected] Abstract—With the creative use of sensors, the sensor networks
could impact a wide variety of applications from national security to consumer electronics in the future. Sharing the vision and emphasizing the energy efficiency of data dissemination for the resource inventory applications, we propose a novel data aggregation strategy and algorithms to obtain the population of the objects (i.e., the resource) to be sensed in the networks. With a set of cautiously validated simulations, we show that the energy consumption applying our solution is only one third of the original case and scalable to the object population. The experimental results also show that we are able to obtain consistent lower and upper bounds at the 70% and 180% of the exact population. While we show the solution works effectively for the resource inventory applications, this work suggests more profoundly that there is yet design space to explore in application-specific data aggregation for energy conservation.
Keywords- sensor network; data aggregation; aggregate computation; resource inventory
I. INTRODUCTION
Technological advances have enlightened a future of intelligent and pervasive computing and communication. In that, miniature and robust sensor nodes would be able to generate, process, and communicate metrics about the environment, for instance, the temperature of a room. The role of the sensor network is critical in that it automates the collection of environmental metrics at the data sink(s) for application-level processing. The emergence of the sensors and sensor networks can impact a wide variety of applications from national security to consumer electronics. More specifically, desert mission coordinating, eco-physiological system mapping, flood relief system tracking, energy flow engineering, and elderly care in place.
The sensor nodes are small in form factor and communicate wirelessly. They also run on limited battery power. That makes energy efficiency a major design challenge for sensor networks. From the architecture, operating system, communication suite, to the application, the energy factor is often the primary design consideration.
Focusing on the communication aspect in particular, much of the research attention is on the design of data dissemination mechanisms. The data-centric diffusion mechanisms [1], unlike the address-centric ad hoc routing mechanisms [2][3], promise configuration-free deployment. This is a necessary property given that the deployment environment is often hostile and infrastructure-less. However, the transmission cost per data is higher in data-centric diffusion. A data packet is often duplicated and transmitted through multiple paths to the destination.
To optimize the energy efficiency of data diffusion mechanisms, it is critical to suppress duplicates or, more generally, to aggregate data as they meet up being propagated through the network. Previous work has explored the energy conservation due to greedy early [4], sub-optimal [5], or optimal [6] duplicate suppression. Motivated to keep the sensor networks configuration free and in the meantime communication efficient, we explore the benefit and limit of data aggregation.
We focus on optimizing the energy efficiency for the resource inventory problems. By resource inventory, we meant a general class of applications involving population estimation of a specific specie or object type. For instance, the specie survey problem in habitat monitoring [7][8], the parts stocking problem in manufacturing, and the goods tracking problem in consumer electronics. The functional objective is to obtain the total number of the specific animal specie, manufactured part, or on-the-shelf merchandize. Current solutions to the population estimation problem are primarily statistical. The inferred results are known [9] sensitive to the sampling methodology. Another major drawback is that when the actual population is small, the results are inheritedly unreliable.
By exploiting the common functional objective, we can further reduce the energy consumption for the resource inventory applications. This is achieved by sending one report on the number of objects sensed along with the sensing region, instead of one report for each object sensed. In other words, the system aggregates reports of individual objects right at the point of data source and sends the already-aggregated object counts. We assume the individual objects can be distinguished at the sensor by the physical locations, voice signatures [14], visual features, or even pre-implanted artificial identifications (RFID for example). To estimate the population from the †Also with the Institute of Information Science, Academia Sinica, Nankang,
object counts at the data sink, we devise a set of algorithms for the lower and upper bound. This is remarkable in that the lower and upper bounds of the population are physical and reliable in comparison to the statistically inferred results.
With a set of carefully validated simulations, we show that applying our aggregation strategy could save up to 65% of the total energy, and the energy consumption is scalable to the population of the objects in observation. When the population is high, the energy conservation could be 2.43 times better than applying just the duplicate suppression techniques. The evaluation of the population estimation algorithms show that even though the lower and upper bounds span the –30% to +80% range relative to the exact population, the margin is consistent throughout simulations of random populations – a good indication to the predictability of the exact population from the lower and upper bounds.
Our contribution is four-fold. 1) We extend the notion of data aggregation one step further by exploiting common application objectives. 2) We identify a class of real-world applications, resource inventory, that share the same functional objective – obtaining the population of the objects. 3) We propose a concrete solution combining a data aggregation scheme and population estimation algorithms for the resource inventory problem. 4) We show with supporting data that the solution could be times better than the well-known techniques in energy conservation and consistent in bounding the population. The combined solution offers a more robust alternative to the existing statistical approximation techniques used for the resource inventory problems.
The remainder of the paper is organized as follows. We will first summarize the literature in sensor data aggregation. Following that, we detail the aggregation strategy and population estimation algorithms proposed to tackle the resource inventory applications. In the evaluation section, we provide evidences that our approach is effective in saving the energy and feasible with promising solutions to real-world applications.
II. RELATED WORK
This work is related to a number of spatial and temporal data aggregation techniques for sensor networks. The population estimation component in particular is related to the aggregate computation problem.
Spatial Aggregation. The mechanisms and analysis
presented in [10][4][5][6] focus on the construction of aggregation trees, in which the root is the data sink and the sensor data starting from the leaves are aggregated at the branching points as they traverse up the tree. The characteristics of the aggregation tree construction mechanisms impact the communication and energy efficiency of the sensor networks. In particular, [10] proposes and implements a simple distributed aggregation tree forming mechanism, [4] evaluates the efficiency of greedy aggregation, [5] analyzes theoretically the cost of sub-optimal aggregation, [6] is able to construct optimal solution given the location of the sensor nodes. These mechanisms emphasize in-network duplicate suppression and
simple aggregate computations. Our mechanism of sending object counts is to aggregate the individual object reports all at once and right at the data source, and our object counts aggregation is a much more complicated computational problem.
Our work is inspired by [4] and [5]. In [4], the authors propose to aggregate data in a greedy incremental tree. Due to the opportunistic nature of the original directed diffusion mechanism, multiple copies of data tend to be forwarded to the data sink through different low-latency paths. This implies a lower probability of identical data copies to be aggregated. Instead, the authors propose to connect the sources by a greedy tree (i.e., each source is connected to the closest point of an existing tree) to the data sink. This way the data could be aggregated as early as possible on the way to the data sink. The experimental results show that the greedy aggregation can achieve energy savings that is better than the original opportunistic aggregation.
In [5], the authors model the impact of energy savings due to data aggregation both theoretically and experimentally. They are the first to identify the formation of an optimal aggregation tree is an NP-hard problem, and suggest useful polynomial-time sub-optimal aggregation. The authors propose three different sub-optimal aggregation mechanisms. Their results show that the sub-optimal aggregation mechanisms significantly reduce energy consumption in a number of experimental settings. The tradeoff for such energy savings is the prolonged data latency.
Temporal Aggregation. Even though our work is more
relevant in spirit to spatial data aggregation, the temporal aggregation techniques are complementary and useful in further reducing the energy consumption for periodic or long-term sensor data communication. The long-term of periodic aggregation is first formulated in [11]. In that, the data aggregation for periodic aggregation applications is equivalent of a distributed estimation problem. We share the notion of energy-accuracy tradeoff, although our mechanism applies to the different, spatial aggregation space. The authors of [12][13] exploit also the time domain for long-term data aggregation. Instead of trading off accuracy for energy, they discuss a variety of mechanisms to determine the time to wait for data to be aggregated, i.e., trading off latency for energy.
Aggregate Computation. The population estimation is a
significant part of this work. It is related to the aggregate computation. Most application-dependent aggregation mechanisms, for example [11][13], apply to exemplary aggregates, for example MAX and MIN. The computation of exemplary aggregates is not sensitive to duplicates and the computation complexity is generally low. The aggregates such as COUNT and SUM fall into the summary aggregate category. These are sensitive to duplicates. Assuming the individual data to add up are mutually independent, i.e., non-overlapping regions, [10] addresses the reliable computation of the SUM aggregate. The population estimation algorithms in this work are in essence to compute the SUM aggregate for overlapping sensing regions. As far as we know, the algorithms are the first
A
(a) Overlapping of sensing regions (b) Graph equivalence
Figure 1: Estimate the Lower Bound of Population
viable solution to approximate the SUM aggregate for overlapping sensing regions.
III. AGGREGATION STRATEGY
In this section, we begin by introducing Directed Diffusion, the data-centric diffusion mechanism adopted for the design and evaluation of this work. This explains how in data-centric diffusion mechanisms, each data packet is repeatedly duplicated and transmitted through multiple paths to the destination. Then, we elaborate the data aggregation strategy that we propose to improve the communication efficiency.
Directed Diffusion. Directed diffusion, detailed in [1], is a
data-centric data dissemination mechanism for wireless sensor networks. The diffusion mechanism starts by the data sink that intends to receive certain data. The data sink sends an interest through the entire network to request for the data periodically. The sink first broadcasts the interest to its neighbors. After the neighbors receive a new interest, they would further broadcast the interest to all their neighbors and set up gradients toward the previous node. This process would continue until every node in the network receives the interest. The data source, which has the data matching the interest, then sends the data through the gradients, i.e., diffusing data through the network to the sink. Inevitably, the gradients would be set up in both directions between every two nodes and result in multiple copies of data being propagated throughout the network.
Data aggregation. Data aggregation is a term coined to
refer techniques that would reduce the amount of bits transmitted while conveying individual data from the sensor to the data sink. Because the aggregation decisions are made as the data being dissemination in the network, this is also referred to as in-network processing. Duplicate suppression is a well-studied data aggregation technique. For instance in [4], Intanagonwiwat et. al. has investigated the energy conservation due to greedy vs. opportunistic duplicate suppression. We think that, in addition to duplicate suppression, there is space of improvement by exploiting application information.
Consider two applications in eco-system monitoring: animal location and population surveillance. In the animal location surveillance case, the duplicate location data can be suppressed for the reason that which copy of the animal location reaches the data sink is not important as long as there is at least one getting to the data sink. In the animal population surveillance case, the application objective is the total count of the animal. We could calculate easily the populations by counting the number of distinct location reports received at the data sink. Or alternatively, we could have each sensor reporting only the animal count and the sensing region. At the data sink, we could employ a number of algorithms as described in Section IV, to estimate the population.
The second approach has a constant communication cost given a fixed number of sensors in the network, whereas the communication overhead in the first approach is proportional to the number of the animals, i.e., one observation one report. When the number of observed animals is higher than the number of sensors, the second approach will be more energy
efficient and scalable in general. The “count report” approach is application dependent and particularly suitable for the resource inventory class of problems. In Section V, we simulate and compare the communication cost of the two approaches and validate the scalability of the count report approach.
IV. POPULATION ESTIMATION
In the previous section, we have elaborated our energy efficient strategy for data aggregation and discussed how it can be applied to the resource inventory problems. The idea is to send the object count instead of the object location data. However, there still remains the problem of estimating the population from the aggregated data, i.e., the object counts.
To get the population, one simple heuristic is to add the counts up, and take this number as the population. However, due to the nature of sensor networks, the deployment and the topology of sensor nodes might not be easily controllable that the sensing regions of different sensors may overlap with each other, which means one animal might be detected by several sensors at one time. The reported counts cannot just be summed up to do the estimation. Figure 1(a) shows the possible overlap of different sensors’ sensing regions. In this figure, if we just calculate the total counts, the animal A depicted will be accounted for three times.
Estimation Algorithms. With the limited information
provided by the aggregated data, we will not be able to obtain the exact quantity. We could however approximate the population by finding the proper lower and upper bounds. Our algorithm of estimating lower and upper bounds is to find the two extreme cases. The lower bound is to get the population of all the objects falling into the non-overlapping sensing regions. The upper bound is to account only the regions that cannot be replaced by other sensing regions. In other words, in these regions, there are spots that are covered by only one sensor node.
For the lower bound, to avoid counting the same object more than twice, we first find the sets of disjoint regions. With the sensing regions included also in the count reports, we could compute the sets of sensor nodes whose sensing regions does not overlap with each other. Having the sets of disjoint regions, we then sum the reported counts from the regions in each set and pick the maximal sum as the lower bound. The lower bound will be the exact population if all the objects are located in the intersected area of the sensing regions.
The algorithm for the lower bound computation above is equivalent to the well-known maximal independent set problem (MIS) in graph theory. The solutions apply on a graph converted from the original problem. In the resource inventory problem case, the vertices in the graph are the sensing regions, and an edge is added between two overlapping sensing regions. Figure 1(b) shows the graph converted from Figure 1(a). The maximal independent set problem is NP-hard and there are well-known solutions [15] to improve the time or space complexity. Having primary goal being to demonstrate the feasibility of our aggregation strategy, we employ a simple heuristic with search space reduction that walks through all possible combinations of disjoint regions and find the optimal lower bounds by comparing the total counts in these combinations.
The search algorithm to obtain the upper bounds is similar to that of the lower bounds. The main difference is at the criteria of valid region combinations. In this case, a valid combination includes solely the regions that cannot be replaced by combinations of other regions. This is because there could be objects in these irreplaceable regions and they need to be accounted for the upper bound for at least once. Some objects in the intersection of these irreplaceable regions will be accounted inevitably for more than once.
On the other hand, the objects falling into regions that are covered by some combinations of other regions will be redundant and should not be accounted for a tight upper bound. As a result, the upper bound computation is also a search problem. The algorithm finds all possible combinations of regions in which there is no any region that can be covered by the rest of regions in the set and we take the minimal total count as the upper bound.
V. EVALUATION
In this section, we provide evidences to support that 1) the aggregation strategy are efficient in reducing the communication and energy cost and 2) the lower and upper bound algorithms are effective in estimating the population. The overall results reveal also the trade-off between energy efficiency and accuracy. In that, our aggregation strategy achieves in conserving energy but in the meantime complicates the process of obtaining the exact population.
In essence, we are suggesting that when energy efficiency is a more critical requirement than accuracy, the resource inventory applications could apply the proposed data aggregation strategy and yet obtain the population estimation. Furthermore, we show that the data-centric diffusion mechanisms are indeed promising solutions to the data dissemination problem in sensor networks. They are not only configuration free but also of potential in energy reduction by exploring the design space of data aggregation.
A. Experimental Design
Assuming directed diffusion to be the data dissemination mechanism running in the sensor networks, we base our experiments and modifications on the latest implementation of directed diffusion [16] in the ns-2 simulator [17]. The goals of the experiments are firstly, to compare the energy conserved due to count aggregation and duplicate suppression, and secondly, to evaluate the performance of the proposed estimation algorithms.
In all of the simulations, we use a 500x500m grid with random placement of 25 sensor nodes. The communication range is set to 250m for all nodes. The transmission power of each sensor is 660mW, receiving power 395mW, and the idle power is 35mW. The simulation time is 400 seconds. To avoid the initial transient state of the simulations, the data used in the evaluation are only those collected in the duration of time 100 to 400 seconds. We select the top right sensor node to be the data sink. The above setting is based on that in [1] with the intention of being able to validate our simulation results.
To simulate the objects to detect by the sensor nodes, we enhance the scenario generation utility in ns-2 to generate also random objects on the 500x500m grid. If an object is within one sensor’s sensing range, the sensor would send the location of the object to the sink.
Our experiment is designed to understand the impact of data aggregation, when the density of objects within one sensor’s sensing range changes. The first set of simulations is to vary the sensing radius from 110m to 190m with an interval of 20m, and fix the number of sources to 25. The point of the set is to observe the performance of diffusion when the amount of duplicate data is high. The second set is to change the
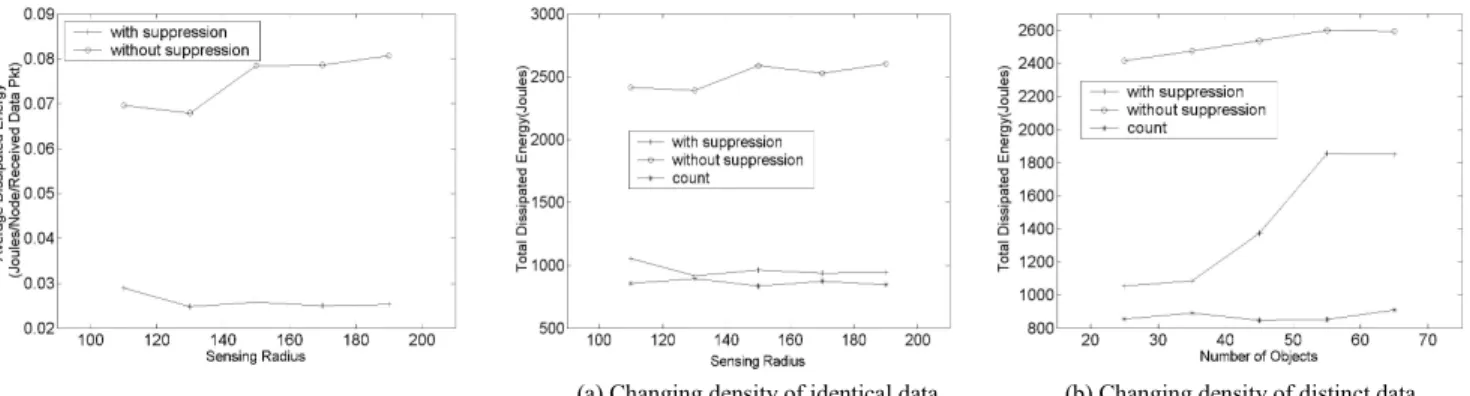
(a) Changing density of identical data (b) Changing density of distinct data
number of sensor nodes, i.e., data sources, from 25 to 65, with an interval of 10, and fix the sensing radius to 110m. This set is to observe the performance of diffusion when the amount of distinctive objects is high. For each simulation, the result is the average over three different random placements of sensors and objects.
The simulations run on the basic directed diffusion mechanism (the without suppression case) as well as the directed diffusion with data aggregation. We apply two different data aggregation strategies. One is to suppress the identical location data from different sources (the with suppression case), and the other is to aggregate the location data at the earliest possible time, i.e., sending object counts at the sensor nodes (the count case).
B. Energy Efficiency
For the credibility of our simulations, we first evaluate the average dissipated energy for the without aggregation and duplicate suppression cases. The average dissipated energy measures the ratio of total dissipated energy per node to the distinct objects seen by the sink, and can be viewed as the energy consumed by each sensor for the sink to receive a useful object report. Figure 2 shows that the without aggregation case uses much more energy than the with duplicate suppression case. This result echoes that from the original directed diffusion paper [1].
Figure 3(a) depicts the total dissipated energy versus sensing radius. The duplicate suppression curve remains steady because when we increase sensing radius, we only increase the amount of duplicate location reports, and these duplicates are all suppressed on the way to the sink. However, if we increase the amount of distinct objects, as indicated in Figure 3(b), the duplicate suppression case demands an increasing amount of energy because the distinct location reports cannot be suppressed.
We now add the third curve to compare to the results of the count aggregation case. As shown in Figure 3(a) and (b), sending counts conserves more energy than duplicate suppression, especially when the density of distinct data with each sensing region is high, and no matter whether we change
the sensing radius or object population, the total dissipated energy remains steady.
C. Population Estimation
For the population estimation, we use the same scenarios, 25 sensor nodes with sensing radius fixed on 110m, and change the object population from 25 to 65. Each result of different population is the average of five different sensors and objects placements. In Figure 4(a), the X axis is the exact population of objects while the Y axis is the lower and upper bound of the object counts estimated from the algorithm. Figure 4(b) shows the estimation range. These are the ratios of upper bound and lower bound margins relative to the exact population.
Depicted in Figure 4(b), the lower bound is consistently 30% lower than the exact population. As for the upper bound, although much looser, it is consistently 70-80% higher than the exact population. The consistent estimation range is a good indication that one might be able to predict the actual population from the empirical results. Additionally, unique to the methods in the resource inventory literature, the upper and lower bounds we obtain are not sensitive to bias in data sampling or statistical inference techniques. That is, our estimation finds a strict range among all possible populations indicated by the individual counts.
The computation time of our algorithms are not yet optimized. In fact, we have not yet exhausted the search space for the upper bound at this point. This is an urgent task item on the future work list. Further on the upper bound computation, we use an approximation method to determine whether the removal of a region affects the coverage. The idea is check densely the pixels in the region being removed and see if they fall into the remaining regions. For the results shown here, we coarsely represent the 500x500 grid by 500x500 pixels. We expect to bring closer the upper bound margin by doing finer-grain pixel approximation to the continuous space.
VI. CONCLUTIONS AND OUTLOOK
In this paper, we describe a sensor data aggregation strategy for energy efficiency. The empirical results show that the data aggregation could save up to 65% of the total energy, and the energy consumption is scalable to the population of the objects
(a) Estimated Counts (b) Estimation Range Relative to Total Population
in observation. In addition, we also describe the algorithm to estimate the population by finding the upper and lower bounds from the aggregated data. The bounding range spans the –30% to +80% range relative to the exact population, and the margin is consistent throughout simulations of random populations.
In the future, we expect the object count to be further aggregated through the in-network processing as they propagate. This would require efficient aggregate computation models to be feasible to employ on the low computation power sensor nodes. For population estimation, we expect to get a tighter upper bound by doing finer-grain coverage check and reduce the estimation range of lower bound by proper deployment of sensor nodes. To help estimate the exact population, statistical techniques must be included. In addition, in our experiments, we assume that the sensor nodes and objects are distributed in uniform random, but in real life the objects tend to cluster. In the future, we would take into consideration a more realistic random placement model for the extended evaluation.
ACKNOWLEDGMENT
Many thanks to Shu-Ting Chiang of the Graduate Institute of Zoology in National Taiwan University for many insights to the resource inventory problem.
REFERENCES
[1] C. Intanagonwiwat, R. Govindan, and D. Estrin. Directed Diffusion: A Scalable and Robust Communication Paradigm for Sensor Networks. In
Proceedings of the Sixth Annual International Conference on Mobile Computing and Networks (MobiCOM 2000), August 2000, Boston, Massachusetts
[2] C. Perkins, E. Belding-Royer, S. Das. Ad hoc On-Demand Distance Vector (AODV) Routing. RFC 3561, IETF MANET Working Group, July 2003
[3] D. B. Johnson, D. A. Maltz, Y. C. Hu. The Dynamic Source Routing Protocol for Mobile Ad Hoc Networks (DSR). Internet Draft, IETF
MANET Working Group, July 2004
[4] C. Intanagonwiwat, D. Estrin, R. Govindan, and J. Heidemann. Impact of Network Density on Data Aggregation in Wireless Sensor Networks.
In Proceedings of International Conference on Distributed Computing Systems (ICDCS), Vienna, Austria, July 2002.
[5] B. Krishanamachari, D. Estrin and S. Wicker. The Impact of Data Aggregation in Wireless Sensor Networks. In International Workshop of
Distributed Event Based Systems (DEBS), Vienna, Austria, July 2002
[6] K. Kalpakis, K. Dasgupta, P.Namjoshi. Efficient Algorithms for Maximum Lifetime Data Gathering and Aggregation in Wireless Sensor Networks. The International Journal of Computer and Telecommunications Networking, August 2002.
[7] National Park Service, US Department of the Interior. Natural resource inventories in the national parks: Revealing America's remarkable natural heritage. Natural Resource Challenge Brochures. http://www.nature.nps.gov/Challenge/brochures/Inventories_MAR_2004 _screen.pdf
[8] G. Williams. Inventory and Prototype Monitoring of Natural Resources in Selected National Park System Units. Nature and Science, National
Park Service, 1999-2000
http://www.nature.nps.gov/publications/TR2001-1/TitlePage.htm [9] L. D. Brown, M. L. Eaton, D. A. Freedman, S. P. Klein, R. A. Olshen,
K. W. Wachter, M. T. Wells, and D. Ylvisaker. Statistical Controversies in Census 2000. Jurimetrics, 39, 347-375, May 1999
[10] S. Madden, M. J. Franklin, J. M. Hellerstein, W. Hong. Tag: a Tiny Aggregation Service for Ad-Hoc Sensor Networks. In Proceedings of
the 5th Symposium on Operating Systems Design and Implementation,
2002.
[11] A. Boulis, S. Ganeriwal, and M.B. Srivastava. Aggregation in Sensor Networks: An Energy-Accuracy Trade-off. In Proceedings of the First
IEEE International Workshop on Sensor Network Protocols and Applications (SNPA'03), 11 May 2003.
[12] T. He, M. Blum, J. A Stankovic, T. Abdelzaher. AIDA: Adaptive Application Independent Data Aggregation in Wireless Sensor Networks. ACM Transaction on Embedded Computing System, 2003 [13] W. Yuan, S. Krishnamurthy, S. K. Tripathi. Synchronization of Multiple
Levels of Data Fusion in Wireless Sensor Networks. IEEE Global
Communications Conference (GLOBECOM'03), December 2003
[14] H. Wang, J. Elson, L. Girod, D. Estrin, and K. Yao. Target Classification and Localization in Habitat Monitoring. In Proceedings of IEEE
International Conference on Acoustics, Speech, and Signal Processing (ICASSP 2003), Hong Kong, China. April 2003.
[15] E. L. Lawler, J. K. Lenstra, A. H. G. Rinnooy Kan. Generating all maximal independent sets: NP-hardness and polynomial-time algorithms. SIAM J. Comput. 9 (1980), no. 3, 558--565.
[16] L. Breslau; D. Estrin; K. Fall; S. Floyd; J. Heidemann; A. Helmy; P. Huang; S. McCanne; K. Varadhan; Y. Xu; H. Yu; The VINT Project. Advances in Network Simulation. IEEE Computer, May 2000
[17] F. Silva, J. Heidemann, R. Govindan. Network Routing Application Programmer’s Interface (API) and Walk Through 0.9. Diffusion 3.1.2 Documentation. USC/ISI, May 2002