國
立
交
通
大
學
電信工程研究所
碩
士
論
文
在 WiMAX 802.16e 的系統下做具有服務品質保證的資源分配
QoS-Aware Resource Allocation in WiMAX 802.16e System
研 究 生:蘇運良
指導教授:李程輝 教授
在 WiMAX 802.16e 的系統下做具有服務品質保證的資源分配
QoS-Aware Resource Allocation in WiMAX 802.16e System
研 究 生:蘇運良
Student:Yun-Liang Su
指導教授:李程輝
Advisor:Tsern-Huei Lee
國 立 交 通 大 學
電信工程研究所
碩士論文
A ThesisSubmitted to Institute of Communications Engineering College of Electrical and Computer Engineering
National Chiao Tung University
In partial Fulfillment of the Requirements for the Degree of Master
in
Communications Engineering
June 2011
Hsinchu, Taiwan, Republic of China
i
在 WiMAX 802.16 的系統下做具有服務品質的資源分配
學生: 蘇運良
指導教授:李程輝 教授
國立交通大學
電信工程研究所
摘要
無線通訊在現今社會中已越來越重要,人們對行動通訊的依賴也
比從前來的高。在無線通道中,通道的狀況對使用者具有時變性和頻
率選擇性,正交分頻多工的技術因應而生,也已經被使用在一些無線
通訊的規格當中,像是 WiMAX 802.16e。而在頻寬及時間都是有限的
情況下,如何將這些有限的資源做最佳的分配成為今日重要的課題。
在本篇論文裡,我們提供了一個在 802.16e 規格下設計的演算法,其
最終目的是希望在盡量滿足所有使用者的服務品質需求的情況下,提
高整個頻寬和時間的使用效率, 達到資源的最佳利用。
關鍵字:無線通訊,正交分頻多工,服務品質
ii
QoS-Aware Resource Allocation in
WiMAX 802.16e System
Student: Yun-Liang Su Advisor: Prof. Tsern-Huei Lee
Institute of Communications Engineering
National Chiao Tung University
ABSTRACT
Wireless communication has become increasingly important in the nowadays society, and people have more dependence on mobile communication than before. In wireless channels, the channel state changes over time and frequency for users so that the orthogonal frequency division multiple access (OFDMA) technology is coming up and being used in current wireless broadband access standards, for example, 802.16e WiMAX. In the case of time and bandwidth are limited, how to allocate the limited resource in the best way has become an important issue. In this thesis, we provide an algorithm designed under the 802.16e standard, the ultimate goal is to try to satisfy all users’ Quality of Service (QoS) requirements, raising the efficiency of using time and bandwidth to achieve optimal utilization of resources.
Keywords: Wireless communication, orthogonal frequency division multiple access (OFDMA), Quality of Service (QoS)
iii
誌
謝
感謝交通大學電信工程研究所 NTL 實驗室的各位,郁文學長、孟諭
學長、啟賢學長、梓洋學長、迺倫學姐、謙和、建男、佳心、家俊、
亞蕾、承潔、順閔、孟哲、信宏、筠翰、琮揚、國書、煜傑、晴嬅,
還有已經畢業的鈞傑學長和學弟們,感謝在研究所的兩年時間有你們
的陪伴,提供給我的意見和想法也讓我在各方面都能順順利利。
特別感謝我的指導教授 李 程輝 博士,在我的學業、研究方面的指
導讓我在研究所兩年中獲益匪淺,在生活方面也提供經驗分享讓我受
益良多。感謝郁文學長和啟賢學長在研究方面給予我的幫助和討論,
讓我的研究能順利進行至此
最後感謝我的家人和女朋友對我的付出與支持,我才能走到今天。
謹將此論文獻給所有幫助過我的人
2011/06
iv
目
錄
中文摘要
i
英文摘要
ii
誌謝
iii
目錄
iv
圖目錄
v
一、
Introduction
1
二、
System Model & Related Work
6
2.1
System Model
6
2.2
Related Work
8
三、
Proposed Algorithm
12
3.1
Problem definition
13
3.2
The priority function and profit function
16
3.2.1
The priority function φ()
16
3.2.2
The profit function θ()
17
3.3
The sorting procedure
17
3.4
The prediction algorithm
18
3.4.1
The prediction algorithm 1
18
3.4.2
The prediction algorithm 2
19
3.4.3
The pros and cons of the two algorithms
20
3.5
The mapping algorithm
21
四、
Simulation Results
24
五、
Conclusions
38
v
圖 目 錄
Figure 1.The example of OFDMA signal ... 2
Figure 2.The example of OFDMA frame ... 3
Figure 3.The whole process of resource allocation ... 6
Figure 4.The flow chart of our algorithm ... 15
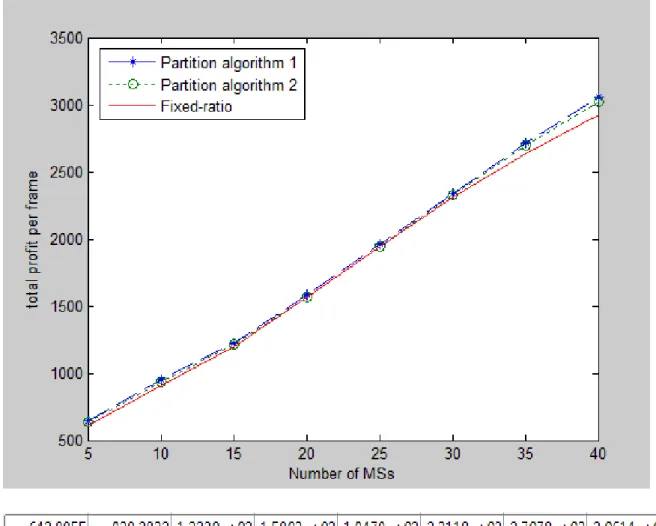
Figure 5.The total profits with two prediction algorithms and fixed frame-ratio... 25
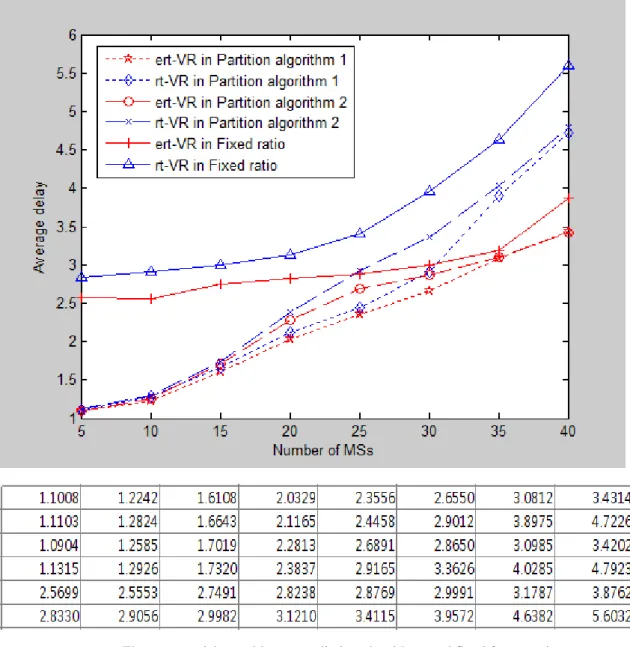
Figure 6.The average delays with two prediction algorithms and fixed frame-ratio... 26
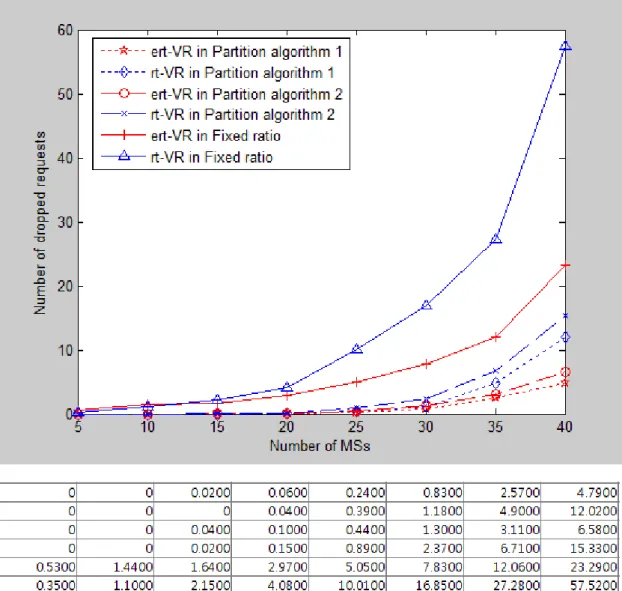
Figure 7.The numbers of dropped requests in three methods ... 27
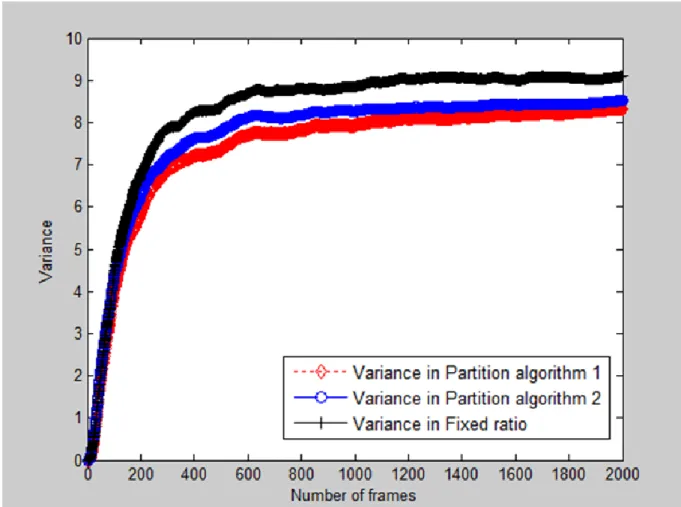
Figure 8.The variance of ert-VR service when the number of MSs is 40 ... 28
Figure 9.The guaranteed rate of three types of QoS services when the number of MSs is 40 ... 29
Figure 10.The total profits with three different mapping schemes ... 30
Figure 11.The average delays with three different mapping schemes ... 31
Figure 12.The numbers of dropped requests in three mapping schemes ... 32
Figure 13.The variance of ert-VR service when the number of MSs is 40 ... 32
Figure 14.The guaranteed rate of three types of QoS services when the number of MSs is 40 ... 33
Figure 15.The total profits with and without sorting algorithm ... 34
Figure 16.The average delays with and without sorting algorithm ... 35
Figure 17.The numbers of dropped requests with and without sorting algorithm ... 36
Figure 18.The variance of ert-VR service when the number of MSs is 40 ... 36
Figure 19.The guaranteed rate of three types of QoS services when the number of MSs is 40 ... 37
vi
表 目 錄
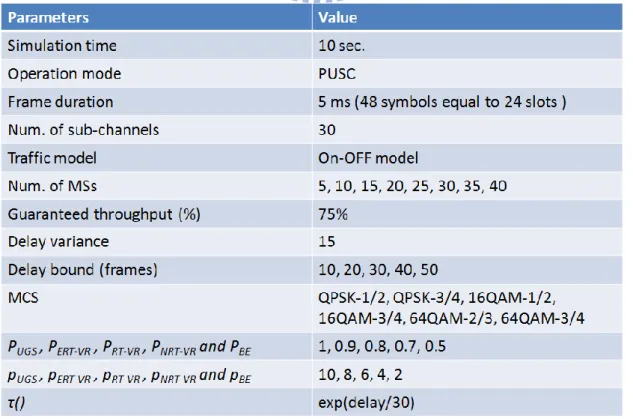
Table 1.The notations used in this thesis ... 11 Table 2.All the parameters used in the simulation experiments ... 24
1
Chapter 1.
Introduction
In recent years, the highly developed wireless communication techniques bring much convenience to our daily life. It not only provides the mobility to personal computers so that eliminate the restriction of cable line, but also can apply in many embedded devices such as PDA, digital camera, cell phone and etc. Meanwhile, the multimedia applications with real-time and high volume traffic such as VoIP, video streaming, grow continually. Therefore, broadband wireless access technology which provides multimedia services has become the highly anticipated industries in our society.
Since wireless channels have the characters of Time-varying and Frequency-selective, it means that the channel state changes over time and frequency for users. The resource allocation technology having time-division and frequency-division multiple access is necessary so that the OFDMA (Orthogonal Frequency Division Multiple Access) technology is coming up and being used in current wireless broadband access standards, for example, 802.16e (WiMAX) [1].
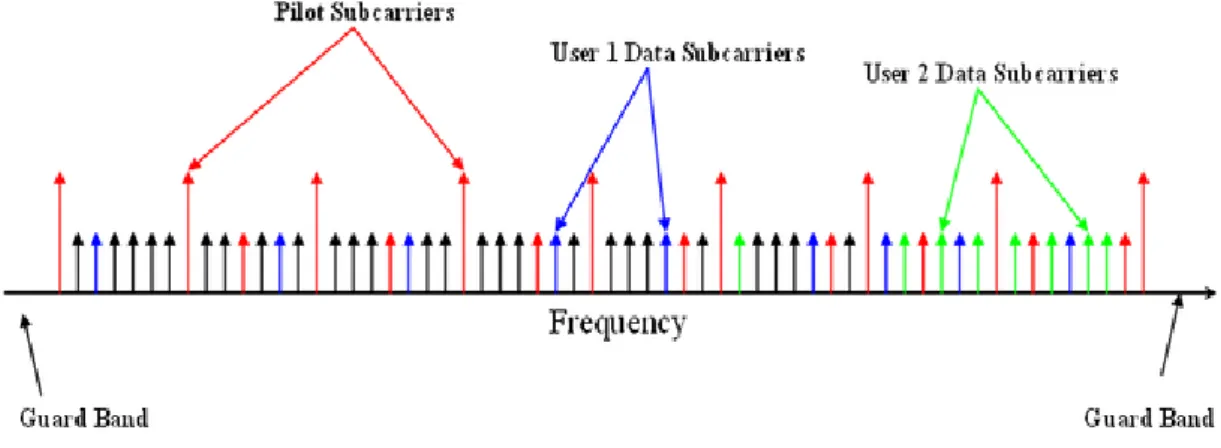
OFDMA is the extension of OFDM (Orthogonal Frequency division multiplexing). OFDM is design for single signal. If the single OFDM signal can be formed by multiple signals to achieve the purpose of multiple access, this technology is named OFDMA. It is achieved by assigning subsets of subcarriers to individual users as shown in the figure 1.
2
Figure 1.The example of OFDMA signal
The communication process, based on the WiMAX standard, consists of a base station (BS) and a number of mobile stations (MSs), where the participants exchange data within specific time periods. Time is organized into fixed frame periods, while the frame is divided into downlink and uplink sub-frames. In the frequency band, sub-carriers are grouped into logical sub-channels. A slot, the basic resource allocation unit, is the combination of a sub-channel and one, two or three symbols depending on sub-carrier permutation type. Here we only consider Partial Usage of Sub-Channelization (PUSC) mode where the sub-channel is composed by distributed sub-carriers and a slot is combined by one sub-channel and two continuous symbols. All sub-channels are equally adequate for all transmitters because each sub-channel is composed of sub-carriers scattered over the entire frequency band in PUSC mode. At the beginning of every frame the maps are broadcasted to inform the users which part of time and frequency they can use for the current frame. Such an in-band signaling creates a trade-off, since transmitting more user data requires more signaling data, which however reduces the space available for users’ data. This kind of signaling data is called “Information Element” (IE), which records all the related information of user data in current frame. Paper [2] proposed a method to reduce the needed bits in IE so that increasing the available capacity for user data.
3
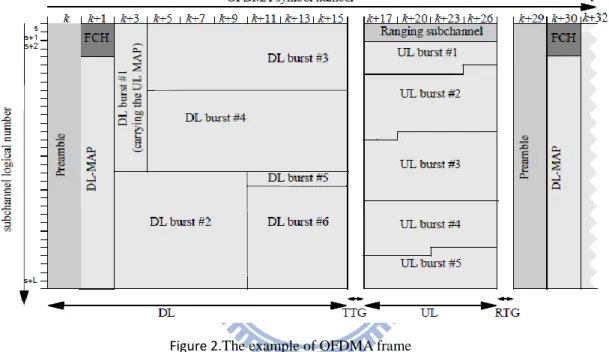
In the downlink sub-frame, a request, the requirement for slots of a service flow, is necessary to be allocated as rectangular shapes, called “burst”, therefore mapping all the requests into the sub-frame is becoming a two-dimensional bin packing problem, where the bin is an abstraction of downlink sub-frame. In the uplink part, there is no rectangle-shaped restriction; it means the bursts in uplink sub-frame are not necessary to be rectangles. The following figure is an example of OFDMA frame.
Figure 2.The example of OFDMA frame
A complete algorithm for resource allocation must take both the QoS requirements and frame efficiency into account. In the first half, design an algorithm for scheduler to select the packets to be transmitted first so that satisfying the QoS requirements for every service flow, then based on the reported channel states, the scheduler transform the selected packets into requests and put them in the downlink or uplink mapping queue. In the second half, design an efficient algorithm for data mapper by solving the bin packing problem to achieve the higher efficiency. After mapping the requests into the frame, turn back the unmapped requests to scheduler and report the channel states then do next round from the beginning.
4
In work [3] and [4], the authors proposed two heuristic mapping schemes, aiming to keep the mapping operational complexity low but caused lower efficiency. The scheme presented in [5] introduced full-research mapping tries, until the optimized one can found. A simple mapping algorithm proposed in [6], its computational complexity is low but caused lower efficiency because it allows one request to be mapped in multiple rectangles; more signaling data is needed and less available capacity to user data. The authors in [7] proposed an algorithm better than that in [6], even it also allows the multiple rectangles. It first mapped the part of the request which can fill the whole columns, then if there were enough space, allocated them to the remaining part of the request. All the works mentioned above are not taking the QoS requirements into consideration; they served the requests based on the order of their size. If the capacity is not enough in the current time, the data mapper in works [3 4 5 6 7] prefer the bigger request than smaller one, ignoring their QoS requirements. In the work [8], the author brought up the “profit” concept, the information scheduler gave to the data mapper, making the decision which request should be served first. Since the authors in [8] just considered two types of requests --- real-time and non-real time, we have the opportunity to improve this part based on the WiMAX standard [1], which provides five QoS types for users.
Sometimes the traffic load is not that much in downlink or uplink part, sharing the unused space to another part is a kind of way to increase the overall efficiency. The common drawback of recent efforts lies in the consideration of the fixed downlink and uplink sub-frames, which result in degrading the allocation scheme’s performance, since the capacity of the available bandwidth space remains fixed, independent of the MS’s requests amount. A prediction mechanism is introduced by [9], which is able to adjust the capacity of the downlink. The authors’ prediction module is implemented via a hidden Markov Chain (HMC) model. In other words, the author used all the past information to be the prediction principle instead of incoming traffic. In the case of knowing the incoming traffic by BS, the ratio
5
between the downlink and uplink sub-frames must be decided by the downlink and uplink queue status in order to satisfy the QoS requirements and increase overall frame utilization.
All we mentioned above inspire us to design a complete algorithm for resource allocation, not only for the satisfaction of QoS requirements but also achieving the higher utilization of the frame. A split approach has been proposed in the thesis, where the scheduler gives the priority and profit value to every request in the first step, then in the second step sorts all the requests based on the two parameters and puts them into downlink/uplink mapping queue. After that, in the third step BS makes the decision of the ratio between the downlink and uplink sub-frame by the queue status. In the last step, data mapper solves the bin packing problem, after which data can be actually transmitted. To solve the bin packing problem, we improve the work in [9] to get the higher efficiency under the same traffic load. We use the priority and profit for every incoming request and the sorting algorithm decides the order to be served so that ensuring the MSs’ QoS demand can be satisfied and the prediction algorithm can achieve higher utilization of frames.
The rest of this thesis is organized as follows. We introduce our system model and review some related works in Chapter 2. In Chapter 3 we describe the definition of our problem in detail, for which we propose an algorithm there. Then simulation results and comparisons are given in Chapter 4, which are followed by the conclusions in Chapter 5.
6
Chapter 2.
System Model & Related Works
2.1 System Model
We consider an OFDMA system based on WiMAX standard [1] consisted of a Base Station (BS) and a group of Mobile Stations (MSs). The time-division duplex (TDD) is considered, and each frame is divided into a downlink sub-frame and an uplink sub-frame as shown in figure 2. A sub-channel is composed by a group of sub-carriers in frequency band and fixed-duration OFDMA symbols in time axis. The basic unit for resource allocation in a frame is slot, which is a combination of one sub-channel and several OFDMA symbols, depend on the operation mode in the frame. Here we consider the PUSC mode, which is under the distributed sub-carrier permutation. It means the set of sub-carriers, which group into a sub-channel, are scattered over the entire frequency band so that all sub-channels are equally adequate for all transmitters. Under PUSC mode, a slot, which is a combination of one sub-channel and two OFDMA symbols, is becoming our basic resource unit.
7
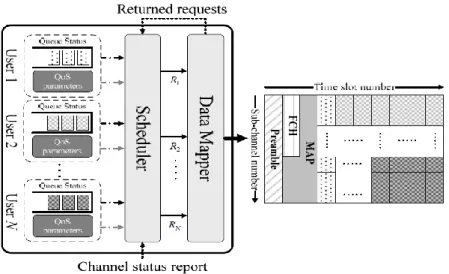
Figure 3 shows our system model, including a scheduler and a data mapper. The scheduler first defines the priority and profit value for all incoming packets based on their QoS demands and instantaneous channel quality. Then scheduler transforms the packets into requests according to their instantaneous SNR value and puts them into the downlink queue or unlink queue in a specific order, makes the decision of the ratio between downlink sub-frame and uplink sub-frame depending on the queue status. After that, data mapper uses available space in downlink sun-frame and the algorithm by solving the bin packing problem to map the requests in the downlink request queue. There is no rectangle-shape restriction in uplink part so that the requests just need to be mapped slot by slot. After the mapping scheme, data mapper sends back the unmapped requests to scheduler and waits for next mapping round.
In WiMAX standard, there are five QoS levels for data traffic, including the Unsolicited Grant Service (UGS), Real-Time Variable Service (RT-VR), Extended Real-Time Variable Service (ERT-VR), Non-Real-Time Variable Service (NRT-VR) and Best Effort service (BE). In a brief introduction of QoS requirements for these five levels: UGS has the highest priority, it doesn’t need to contend for bandwidth; RT-VR and ERT-VR require guaranteed data rate and delay and ERT-VR needs to consider one more criterion--- delay variance; NRT-VR require a guaranteed data rate but is insensitive to delays; BE service is for applications with no rate and delay requirements.
The environment we simulated includes a BS and a group of MSs uniformly distributed in a circle with radius equals five hundred meters. Each MS with a fixed type of connection and each type of five QoS levels is one-fifth of all connections. The traffic model is an on-off model with Rayleigh fading channel. The modulation and coding rate used are: QPSK-1/2, QPSK-3/4, 16QAM-1/2, 16QAM-3/4, 64QAM-2/3 and 64QAM-3/4. We tested the performance of our proposed scheme with five milliseconds frame equals forty-eight OFDMA
8
symbols. Thirty sub-channels in the frequency band, each sub-channel includes twenty-four data sub-carriers. Under PUSC mode, a slot is a combination of one sub-channel and two continuous OFDMA symbols so that total available slots are twenty-four multiplied by thirty equal seven hundred and twenty slots. We assume that the BS knows all the information both the downlink and uplink traffic so that the scheduler can make the right decision with sufficient information.
2.2 Related Work
The problem of resource allocation in IEEE 802.16e OFDMA has been studied in the recent past. In this chapter, we describe some related approaches in detail and outline the drawback which we improve in our work.
The scheme presented in [5] introduced full-search mapping tries, until the optimized one can found. A binary-tree full search operation is applied to exhaustively calculate the total possibilities. It is clear that such an effort demands crucial operational time to be executed; hence the authors limit the number of accommodated MSs to eight per frame.
In [6] a simple mapping scheme “Sample data region allocation algorithm (SDRA)” has been introduced for the downlink sub-frame mapping issue. They assume the burst can be split into smaller bursts arbitrarily. The allocation proceeds backwards in column-wise order and the DL-MAP grows in column-wise order starting from the beginning of the downlink sub-frame. The advantage of this algorithm is simple and that they have considered about the growing DL-MAP but it caused lower efficiency because more bursts are equivalent to need more signaling data (one rectangular burst need to be record by one IE based on the WiMAX standard[1]).
9
/ , / .
i i i i i
W A H H A W
The authors in [7] proposed a better algorithm “Mapping with Appropriate Truncation and Sort (MATS)” than that in [6] even they all assumed the burst can be split arbitrarily. There are request queue (RQ) and fragmentation queue (FQ) in MATS. The requests in RQ are mapped into the downlink sub-frame column by column and truncate the part which can’t fill the whole column, then put them into the FQ. After serving all the requests in the RQ, if there are available capacity, serve the requests in FQ based on the descending order. Even though MATS has better performance than [6], it is still not good enough because it allows splitting bursts, causes too much signaling data.
In [3, 4] two simple heuristic mapping schemes have been proposed, aiming to keep the mapping operational complexity low. According to eOCSA [4], the accommodation strategy lies in the fact that each MS’s request is scheduled into the downlink sub-frame as an individual downlink burst, resulting in a reduced DL-MAP overhead. In the first step, the algorithm includes an initial sorting in a descending order of the incoming bursts and a mapping procedure, which suggests mapping strategy from bottom to top and from left to right. During the second step, known as vertical mapping, and given that H and W denote the downlink sub-frame height and width, Wi denotes the burst allocation width, Hi denotes the burst allocation height, and Ai denotes the number of requests slots of the ith incoming request, the requests are mapped as:
The remaining unallocated space is handled in the third step, in which the horizontal mapping takes place, and where the eOCSA tries to assign the unallocated space to the next largest request that can be accommodated in. We will compare our proposed algorithm with eOCSA in Chapter 6 and show the simulation results.
The scheme called “Adaptive Horizon Burst Mapping (AHBM)” in [9] presented a better mapping efficiency than eOCSA by choosing the better shape of rectangle for every request.
10
There are two steps in this algorithm. The first one is known as “Horizon Mapping”, including an initial sorting in a descending order of the incoming bursts and the right-to-left mapping procedure. Given that H and W are the height and width of the bin, W_rest is the pointer indicating the available width of the bin, Ai denotes the number of requests slots of the ith incoming request, Wi and Hi denote the width and height of request Ai, then the requests are mapped as:
Repeat the scheme until the W_rest is not big enough for every request in the queue. The second step is handling the remaining bursts by bottom-to-top mapping. Find the space above the requests which were mapped in step one and choose the most appropriate one to place the requests one by one in a descending order. The simulation results in [9] showed that it is better than eOCSA, but there still some parts of this algorithm can be improved. We’ll show the detail in Chapter 5. The authors also introduced a prediction module, using the past experience to predict the traffic load in the future and deciding the ratio between downlink and uplink sub-frames. We think that the partition basis should be decided according to the queue status rather than the past data and our idea will show in Chapter 5.
The work in [8] brought up a concept, “profit”, to be the information that scheduler gives to data mapper. It can be the basis of the mapping order to guarantee the QoS requirements for every MS. But the authors in [8] didn’t describe how to define the profit value in detail and just set two QoS levels; there are five QoS levels in WiMAX standard. It gives us a chance to improve this part and the detail will show in Chapter 5.
[1, _ ]
arg min (
*
/
),
/
,
_
_
i i i i i W W rest i i i iW
A W
A
H
A W
W
rest
W
rest
W
11
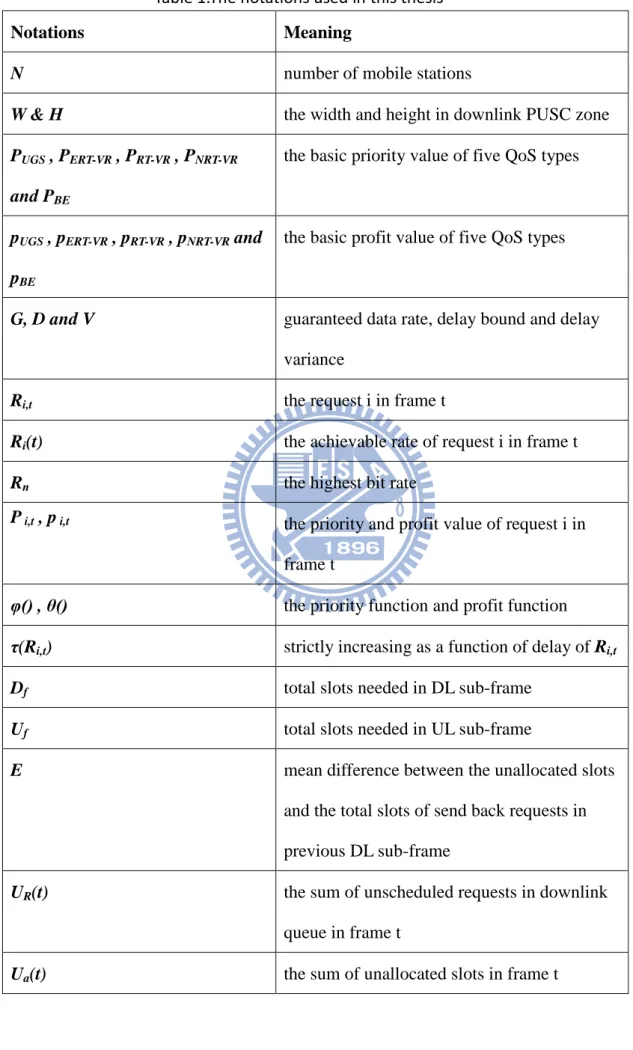
Table 1.The notations used in this thesis
Notations Meaning
N number of mobile stations
W & H the width and height in downlink PUSC zone
PUGS , PERT-VR , PRT-VR , PNRT-VR
and PBE
the basic priority value of five QoS types
pUGS , pERT-VR , pRT-VR , pNRT-VR and
pBE
the basic profit value of five QoS types
G, D and V guaranteed data rate, delay bound and delay
variance
Ri,t the request i in frame t
Ri(t) the achievable rate of request i in frame t
Rn the highest bit rate
P i,t , p i,t the priority and profit value of request i in frame t
φ() , θ() the priority function and profit function
τ(Ri,t) strictly increasing as a function of delay of Ri,t
Df total slots needed in DL sub-frame
Uf total slots needed in UL sub-frame
E mean difference between the unallocated slots
and the total slots of send back requests in previous DL sub-frame
UR(t) the sum of unscheduled requests in downlink
queue in frame t
12
Chapter 3.
Proposed Algorithm
In this section we first define the problem of resource allocation under the 802.16e standard in section 3.1. We assume that BS knows all the traffic information from the MSs, including the downlink part and uplink part, so that the BS can make the right decision to increase the resource utilization. The whole problem is very difficult and complex and it is too hard to solve the problem if we don’t divide this problem into several parts and handle them individually. For the reason mentioned above, we split this problem into four parts, the statement and definition will show as following, including our reasons of how to find the solutions for every part. The notations are shown in table 1.
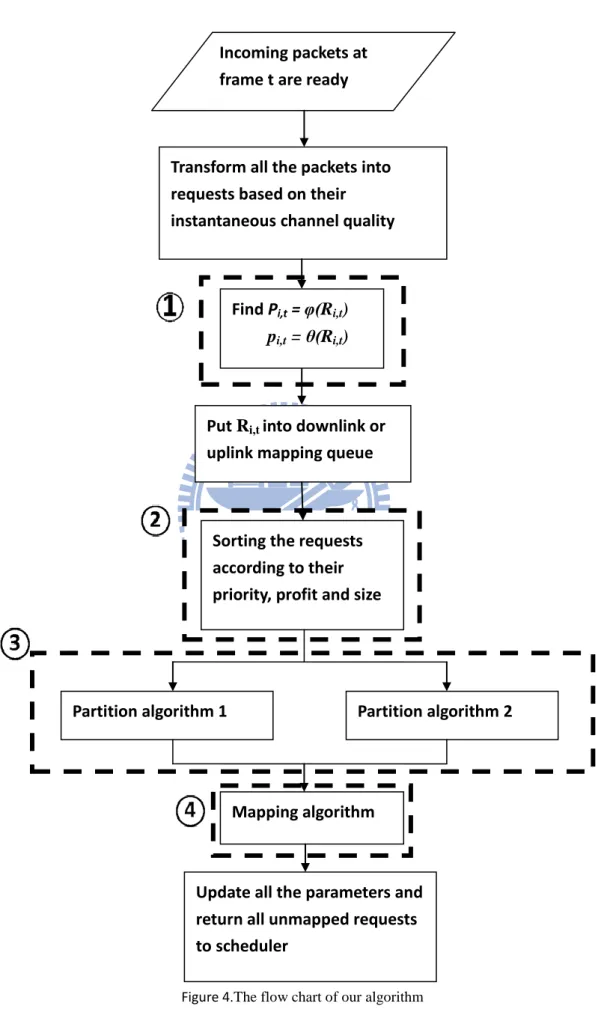
Then we describe our whole set of algorithm, it is divided into four parts to deal with the problems we mentioned before. At first, we transform all the packets into requests, the needed number of slots in current frame, based on their instantaneous channel quality, then use this two functions, φ() and θ(), to find the priority and profit for every request, the detail will show in section 3.2. Next, put all the requests into downlink or uplink mapping queue and sort them according their priority, profit and size, the content will be shown in section 3.3. In next section 3.4, we will introduce two partition algorithms to decide the ratio between the downlink and uplink sub-frames to get higher frame utilization. There is some difference between the two methods; therefore they have their own advantages, disadvantages and different performance. The mapping scheme in section 3.5 called enhanced adaptive horizon burst mapping (eAHBM) is improved from AHBM [9]. Finally, update all the parameters for the next round. The flow chart in Fig. 4 shows our algorithm roughly, and we will describe every part in detail.
13
3.1 Problem definition
3.1.1 The definition of priority and profit
The question in part one is how to protect the QoS requirements for every MS. There are five types of traffic in WiMAX standard, we have introduced them in Chapter 3, and each of them has its own QoS requirements such as delay-bound, guaranteed rate and delay variance. The definition of delay variance is
2/x
x N
where x is the total delay of bursts, is the average delay and N is the total number of bursts. Therefore, we need to give parameters with different values for different types of traffic load. Here we use the “priority” to be the parameter to make sure that the QoS demand of every type of traffic load could be satisfied in the following scheduling process.Under the condition of achieving the QoS requirements for every packet, we need to have a parameter showing how much benefit we get after transmitting the packets per slot. That’s why we define a “profit” here, as a function of QoS type and channel quality. The reason we take the channel quality into consideration is that we just need to spend less resource by using higher modulation coding scheme to serve the MS’s packets if its channel quality is better.
3.1.2 Sorting the incoming packets
As the reference papers we stated before, almost every scheme mapped the request based on the order of size rather than based on the priority or others, and it caused better efficiency but dissatisfaction of QoS requirements. According to the reason, we think that we should change the order based on the parameters we mentioned in 4.1 to achieve our goal, satisfies the QoS requirements of requests as many as possible.
14
3.1.3 Prediction for the ratio between downlink and uplink sub-frames
The traffic loads are different in downlink and uplink, allocating more resource to the side which demands more is a direct approach. In work [9], the prediction module is based on a Hidden Markov Chain, using the past information to make the next decision in the future. We don’t think that it is reasonable because WiMAX is a centralize network, BS is responsible for every MS’s QoS requirements by allocating the resource effectively, we can assume that the BS knows the queue status both in downlink and uplink queue, then segment the whole frame with specific ratio into two parts, downlink sub-frame and uplink sub-frame, and the ratio is decided by the algorithm shown in Chapter 5.3.
3.1.4 The downlink burst mapping problem
The precise statement of the problem is as follows: 1) Given a fixed rectangular bin of width W and H. 2) Given a set of N requests {R1, R2…, RN}
3) Determine a rectangular shape for the ith request with width Wi and height Hi such that Ri ≦ Wi * Hi .
4) Width Wi ≦W for all i. Similarly, height Hi ≦H for all i. Wi, Hi, W and H are all integers.
5) Since the mapped region is more than the desired allocation Ri, the extra resource is wasted and so, Wi * Hi - Ri should be minimized.
15
Figure 4.The flow chart of our algorithm
Incoming packets at frame t are ready
Transform all the packets into requests based on their instantaneous channel quality
Find Pi,t = φ(Ri,t)
pi,t = θ(Ri,t)
Put Ri,t into downlink or
uplink mapping queue
Sorting the requests according to their priority, profit and size
Partition algorithm 1 Partition algorithm 2
Mapping algorithm
Update all the parameters and return all unmapped requests to scheduler
16
3.2 The priority function φ() and profit function θ() 3.2.1 The priority function φ()
Assume we have the basic priority value of five QoS types --- PUGS , PERT-VR ,
PRT-VR , PNRT-VR and PBE , and given values to these three parameters, G (guaranteed data
rate) , D (delay bound) and V (delay variance) , to be our reference when setting the priority. The priority function is Pi,t = φ(Ri,t) where Ri,t is the selected request in current frame t.
Procedure Pi,t = φ(Ri,t)
1. Set the initial priority value Pi,t of request i depend on its QoS type 2. If (Ri,t is a UGS request)
3. Return Pi,t
4. Else if (Ri,t is a BE request) 5. Return Pi,t * (Ri(t)/Rn)
6. Else (Ri,t is a ERT-VR request or RT-VR request or NRT-VR request) 7. Count the corresponding values Gi,t , Di,t and Vi,t then compare them
with G, D and V.
8. If it satisfies all the conditions 9. Return Pi,t * (Ri(t)/Rn ) * τ(Ri,t)
10. Else
11. Return Pi,t * τ(Ri,t)
12. End 13. End
17
3.2.2 The profit function θ()
The meaning of profit here is how much benefit we get per slot after mapping a request into the frame. Assume we have the basic profit value of five QoS types --- pUGS ,
pERT-VR , pRT-VR , pNRT-VR and pBE . The profit function is pi,t = θ( Ri,t) where Ri,t is the
selected request in current frame t.
Procedure pi,t = θ( Ri,t)
1. Set the initial profit value pi,t depending on its QoS type 2. Return pi,t * (Ri(t)/Rn)
3.3 The sorting procedure
For protecting the QoS requirements of MSs, serving order is a quite important issue. Our goal is to serve the requests of UGS type first, then serve the requests of other types with higher priority. The procedure of sorting is as following.
Procedure Sorting
1. Partition all the requests into two set, S1 = {requests of UGS type} and S2 = {requests of all other types}.
2. Sort the requests in the S1 based on the product of their profit and size 3. Sort the requests in the S2 based on their priority
4. If there are some requests with the same priority
5. Sort them based on the product of their profit and size 6. End
18
( ( Df E) /H Uf/H R H/ W)
3.4 The partition algorithm
In order to achieve high utilization of the frame, we have to allocate more resource to the part which needs more; the “part” we describe here is to indicate the downlink sub-frame or uplink sub-frame. How to partition the whole frame into two parts is an important problem. We introduce two methods including their pros and cons as following.
3.4.1 The partition algorithm 1
The first approach is that mix all the requests both in downlink and uplink queue in a set then sort them as we mentioned in 5.2, take out the requests one by one and allocate the corresponding number of slots to downlink part or uplink part according to the requests come from. The detail is as following.
Procedure Partition algorithm 1
1. Sort all the requests both in DL and UL queues based on the sorting algorithm and put them into set S
2. The initial values of E, Df and Uf are zero 3. Do (Select the first request Ri,t in S)
4. If (the first request is in downlink queue) 5. Df = Df + Ri,t ; 6. Else 7. Uf = Uf + Ri,t ; 8. End 9. Remove Ri,t 10. While
19
3.4.2 The partition algorithm 1
The second approach is that put the downlink queue into set S1, uplink queue into set S2, then count the simple integer relations of the length of S1 and S2, then take out the requests from S1 and S2 based on the calculated results. The detail is as following.
Procedure Partition algorithm 2
1. Put the requests in downlink queue into set S1 and the requests in uplink queue into set S2
2. The initial values of E, Df and Uf are zero
3. Count simple integer relations (d:u) of the burst number in S1 and that in S2 4. If (d>u)
5. R d u/ 6. Do
7. Select the first R requests in S1 then assign the corresponding space to Df
8. Select the first one request in S2 then assign the corresponding space to Uf
9. Remove the first R requests in S1 and first one request in S2 10. While ( ( Df E) /H U Hf/ T1/HW)
11. Else
12. R u d/ 13. Do
14. Select the first R requests in S2 then assign the corresponding space to Uf
20
15. Select the first one request in S1 then assign the corresponding space to Df
16. Remove the first R requests in S2 and first one request in S1 17. While ( ( Df E) /H U Hf/ T2/HW)
18. End
19. Set the Uf /H symbols to UL sub-frame and the remains to DL part.
T1 is the total slot number of the first R requests in S1 and the first one request in S2 and
T2 is the total slot number of the first R requests in S2 and the first one request in S1
3.4.3 The pros and cons of the two algorithms
The first algorithm has the better performance than the second because it takes all the requests into consideration so that it can allocate the resource to the most urgent requests. But in some special situation, it may allocate all the space to one side, or prefer one side more time than the other side. The problem above does not exist in the second algorithm. Its proportional allocation can take care of two queues in the same time but cause poor performance. We will show some simulation results in Chapter 6.
21
3.5 The mapping algorithm
In this section, we introduce a mapping scheme which is improved from AHBM [9]. There are two phases in AHBM, we add two more phases to be a new algorithm. We call it enhanced AHBM (eAHBM) and use it to be the mapping scheme in the last part of our algorithm. We will compare the performance with eOCSA [4] and show the results in the Chapter 6.
Procedure mapping algorithm
//First Phase (Horizon definition) 1. Do
2. Select the first request Ri,t from the queue
3. Find the appropriate width, denoted Wi , which minimizes the remaining
wasted slots in the bin:
[1, _ ] arg min ( * / ) i i i i i W W rest W A W A
4. Set its height, denoted as Hi : Hi Ri t, /Wi
5. Map the 2D-rectangular at the base of the bin next to the previous requests, beginning from the below right corner.
6. The empty rectangular space above the request, denoted as Horizon(i), has the following dimensions: Horizon(i)’s height = H - Hi ,
Horizon(i)’s width = Wi
7. Calculate the remaining available bin width W_restW_rest W i
8. Remove Ri,t
22
//Second Phase (Remaining requests mapping) 1. Select the first unmapped request Ri,t from the queue
2. Find the appropriate Horizon(j)’s width, measuring the least remaining waste space (HW(j) stands for Horizon(j)’s width): arg min( ( ) * i t, / ( ) i t, )
j
HW j R HW j MOD R
3. Map Ri,t into Horizon(j), having width equal to Horizon(j) and height as follows: height of
Ri,t = Hi Ri t, /HW j( )
4. Remove Ri,t
5. Update Horizon(j)’s dimensions
6. Continue the second phase until all requests getting mapped or there is not available Horizon to be attached
//Third Phase (Rearrange all Horizons)
1. Rearrange all Horizons in a descending order based on their height so that they form a step-like empty space.
2. Find a maximum rectangle from the empty space, denoted as MaxR, and MaxR’s height and width are HM and WM .
23
//Fourth Phase (Remaining requests mapping in the found rectangle)
1. Select the first unmapped request Ri,t which is smaller than the product of HM and WM
from the queue.
2. Calculate the two values: a(HM*Ri t, /HMRi t, )
, ,
( M* i t / M i t) b W R W R
3. If (a>b)
4. Map Ri,t into the rectangle, having width equal to WM
and height equal to Ri t, /WM
5. Update the available rectangle’s dimensions 7. Remove Ri,t
6. Else
7. Map Ri,t into the rectangle, having height equal to HM
and width equal to Ri t, /HM
8. Update the available rectangle’s dimensions 9. Remove Ri,t
10. End
11. Continue the fourth phase until all requests getting mapped or the available space is not enough for any unmapped request
24
Chapter 4.
Simulation Results
In this section, we evaluate the performance of the proposed scheme with a set of simulation experiments. We consider a single-cell IEEE 802.16e network with a BS and a group of MSs dropped in the cell uniformly. All the MSs move with a walk speed, and the detected SNRs would be the basis of using corresponding MCS. We partition this section into three parts, the first part is showing the performance of two different prediction algorithm and fixed frame-ratio with the same mapping scheme, the second part is showing the performance of different mapping schemes with the same prediction algorithm and sorting algorithm and the third part is showing the performance of schemes with and without sorting algorithm. The values of parameters we used are reported in Table 2.
25
The Figure 5 shows the total profit we get when using different prediction algorithm and the corresponding values is shown below the figure. We can clearly observe that the algorithm 1 is better than the algorithm 2, and the two prediction algorithms are better than the fixed one. The reason is that we allocate more resource to the side which needs more so that we can transmit more requests than the fixed frame-ratio. And the first algorithm is a little bit better than the second because we allocate the resources to the requests with high priority and profit in the first algorithm, it may cause the problem of allocating all the resources to one side. There is no that problem in the algorithm 2, but causes a little bit worse efficiency.
26
In Figure 6, we show the average delay of two real-time services in three ways. It’s clearly that the ert-VR service has less delay than the rt-VR service no matter which kind of method we use because the ert-VR service has the higher basic priority and profit values than the rt-VR service, the scheduler prefer to serve the ert-VR service first. For one specific service, no matter which kind of the two, the average delay in algorithm 1 is the least, it indicates that the frame utilization in the prediction algorithm 1 is the best.
27
The numbers of dropped requests in the three methods is shown in figure 7. Because of the higher priority and profit, the scheduler prefer to serve the ert-VR service first, it causes that the rt-VR requests are easier to be dropped than the ert-VR requests. For one specific service, the performance is the best in the algorithm 1; it shows that the frame utilization in algorithm 1 is the best in the three once again.
28
The next two figures show the other two QoS requirements performance in the three methods and the results met our expectations. It shows the variance of ert-VR service when the number of MSs is forty in figure 8 and the guaranteed rate of three kinds of QoS services in figure 9. The algorithm 1 has better performance than the other two including not only lower variance of ert-VR service but also higher guaranteed rate of nrt-VR service. It supports our point of view: the prediction algorithm 1 is better than the algorithm 2, and the fixed frame-ratio has the worst performance in every part.
29
30
The second part we show the performance with different mapping schemes including “eOCSA”, “AHBM” and our proposed “eAHBM”. In figure 10, we can clearly observe that the eOCSA has the worst performance and its total profit start to decrease when the number of MSs is 35 because of its inefficient mapping scheme, the data mapper can’t serve the requests with higher profit but with higher priority when traffic load is heavy. Meanwhile, our proposed mapping scheme “eAHBM” is a little bit better than AHBM when the traffic load become heavier.
31
The results which are shown in figure 11, 12, 13 and 14 supports our view: eOCSA has the worst performance in every part and our proposed mapping algorithm is a little bit better than AHBM. In figure 11, the average delays of requests in eOCSA are much higher than the other two schemes, so does the number of dropped requests and the variance which are shown in figure 12 and 13. And in the figure 14, the guaranteed rate of the three services in eOCSA is much lower than the values we set before the simulation, indicates that the eOCSA is not a good mapping scheme for protecting QoS requirements.
32
Figure 12.The numbers of dropped requests in three mapping schemes
33
34
In the third part, we show the performance with and without sorting algorithm to indicate that deciding the serving order is an important part in our proposed scheme. The figure 15 shows the result we expected, it has bad performance if we serve the biggest request first. When traffic load become heavier, the biggest request, which may be due to the bad channel conditions caused lower profit, is to be served first so that the total profits start to decrease when the number of MSs is more than twenty-five. In figure 16 and 17, we can see that the data mapper without our sorting algorithm can’t protect the requests with higher priority, it has almost no difference of the two QoS indices, average delay and number of dropped requests, between the ert-VR service and rt-VR service.
35
Figure 16.The average delays with and without sorting algorithm
The figure 18 and 19 shows the results as we think. It is worth to be mentioned that the guaranteed rate of nrt-VR is higher than the other two services because the nrt-VR service is insensitive to delays so that the requests could stay in the queue for a long time and wait to be served, but the ert-VR service and rt-VR service have the opposite position. They have delay bound restriction and the data mapper doesn’t take this restriction into consideration to server them first so that they are easily to be dropped, caused lower guaranteed rate.
36
Figure 17.The numbers of dropped requests with and without sorting algorithm
37
38
Chapter 5.
Conclusion
In this thesis, we present a resource allocation algorithm for taking care of both QoS requirements for every request and frame utilization. There are four parts in our algorithm, the first part is to define the priority and profit for every request so that we can decide the serving order based on these two values; then sort all the requests according to the two indices mentioned in part one is in our second part; the third part is to make the decision of the ratio between downlink and uplink sub-frames depend on the queue status, then an improved mapping scheme is in our fourth part.
The simulation results confirm that the prediction algorithm is working for raising the frame utilization because the traffic load in downlink part and uplink change over time so that allocating more resource to the side with more traffic data is quite a reasonable way. The simulation results also show that our algorithm has better performance for protecting the QoS requirements, for example, higher profit, less number of dropped requests, lower average delay and etc.
39
References
[1] IEEE Std 802.16-2009, IEEE Standard for Local and metropolitan area networks – Part 16: Air Interface for Broadband Wireless Access Systems
[2] S. T. Sheu, M. H. Tsai, T. Y. Tsai, and Y. H. Tsai, “Condensed Downlink MAP Structures for IEEE 802.16e Wireless Metropolitan Area Networks (MANs)” in Proc.
IEEE VTC’10, pp1-5, May 2010
[3] C. So-In, R. Jain and A. A. Tamimi, “OCSA: An algorithm for burst mapping in IEEE 802.16e mobile WiMAX networks1,2, ” in Proc. IEEE APCC’09, pp.52-58, Oct. 2009. [4] C. So-In, R. Jain and A. A. Tamimi, “eOCSA: An algorithm for burst mapping with strict QoS requirements in IEEE 802.16e Mobile WiMAX networks, ” in Proc. IEEE
2nd IFIP’09, pp.1-5, Dec. 2009
[5] C. Desset, E. B. de Lima Filho, and G. Lenoir, “WiMAX Downlink OFDMA Burst Placement for Optimized Receiver Duty-Cycling” in Proc. IEEE ICC’07, pp.5149-5154,
Jun. 2007.
[6] A. Erta, C. Cicconetti, and L. Lenzini, “A Downlink Data Region Allocation Algorithm for IEEE 802.16e OFDMA” in Proc. IEEE ICICS’07, pp.1-5, Dec. 2007.
[7] X. Jin, J. H. Zhou, J. L. Hu, J. L. Shi, Y. Sun, and E. Dutkiewicz, “An Efficient Downlink Data Mapping Algorithm for IEEE 802.16e OFDMA Systems” in Proc. IEEE
GLOBECOM’08, pp.1-5, Dec. 2008.
[8] C. Cicconetti, L. Lenzini, A. Lodi, S. Martello, E. Mingozzi and M. Monaci, “Efficient Two-dimensional Data Allocation in IEEE 802.16 OFDMA, ” in Proc. IEEE
INFOCOM’10, pp.1-9, Mar. 2010
[9] P. G. Sarigiannidis, G. I. Papadimitriou, P. Nicopolitidis, M. S. Obaidat, and A. S. Pomportsis, “A Novel Adaptive Mapping Scheme for IEEE 802.16 Mobile Downlink Framing” in Proc. IEEE GLOBECOM’10, pp.1-5, Dec. 2010
[10] P. G. Sarigiannidis, M. D. Louta, and P. Chatzimisions, “A Novel Fair Mapping Scheme for IEEE 802.16 Downlink Sub-Frame” in Proc. IEEE ICUMT’10, pp.763-768, Oct. 2010
[11] Y. Ben-Shimol, I. Kitroser, and Y. Dinitz, “Two-Dimensional Mapping for Wireless OFDMA System” in Proc. IEEE Transactions on’06, pp.388-396, Sep. 2006
[12] S. Kuei-Ping, C. Hung-Chang, C. Chi-Tao, and H. Tsung-Han, “Channel-Aware Subchannel Renumbering and Downlink Burst Allocation for IEEE 802.16 OFDMA Systems” in Proc. IEEE WCNC’10, pp.1-6, Apr. 2010
[13] R. Cohen, and L. Katzir, “Computational Analysis and Efficient Algorithms for Micro and Macro OFDMA Scheduling” in Proc. IEEE INFOCOM’08, pp.511-519, Apr. 2008
100 碩 士 論 文 在 的 系 統 下 做 具 有 服 務 品 質 保 證 的 資 源 分 配 電 信 工 程 研 究 所 交 通 大 學 電 機 學 院 蘇 運 良 WiM AX 80 2.1 6e