This article was downloaded by: [National Chiao Tung University 國立
交通大學]
On: 28 April 2014, At: 04:08
Publisher: Taylor & Francis
Informa Ltd Registered in England and Wales Registered Number:
1072954 Registered office: Mortimer House, 37-41 Mortimer Street,
London W1T 3JH, UK
Journal of Applied
Statistics
Publication details, including instructions
for authors and subscription information:
http://www.tandfonline.com/loi/cjas20
New generalization of
process capability index
Cpk
W. L. Pearn
Published online: 02 Aug 2010.
To cite this article: W. L. Pearn (1998) New generalization of process
capability index Cpk, Journal of Applied Statistics, 25:6, 801-810, DOI:
10.1080/02664769822783
To link to this article:
http://dx.doi.org/10.1080/02664769822783
PLEASE SCROLL DOWN FOR ARTICLE
Taylor & Francis makes every effort to ensure the accuracy of
all the information (the “Content”) contained in the publications
on our platform. However, Taylor & Francis, our agents, and our
licensors make no representations or warranties whatsoever as to
the accuracy, completeness, or suitability for any purpose of the
Content. Any opinions and views expressed in this publication are
the opinions and views of the authors, and are not the views of or
endorsed by Taylor & Francis. The accuracy of the Content should
not be relied upon and should be independently verified with primary
sources of information. Taylor and Francis shall not be liable for any
losses, actions, claims, proceedings, demands, costs, expenses,
damages, and other liabilities whatsoever or howsoever caused
arising directly or indirectly in connection with, in relation to or
arising out of the use of the Content.
This article may be used for research, teaching, and private study
purposes. Any substantial or systematic reproduction, redistribution,
reselling, loan, sub-licensing, systematic supply, or distribution in
any form to anyone is expressly forbidden. Terms & Conditions of
access and use can be found at http://www.tandfonline.com/page/
terms-and-conditions
Jour nal of A pplied Statistics, Vol. 25, N o. 6, 1998, 801± 810
New generalization of process capability
index C
pkW. L. PEA RN1 & K . S. C HEN2,1Departm ent of Industrial Eng ineering and
M anagement, N ational C hiao Tung University, Hsinchu, Taiwan, Republic of C hina and 2Departm ent of Industrial Eng ineering and M anagement, N ational C hin-Yi Institute of Technolog y, Taichung, Taiwan
SUM M ARY The process capability index Cpk has been widely used in manufacturing
industr y to provide numerical measures of process potential and performance. As noted by many quality control researchers and practitioners, Cpk is yield-based and is independent
of the target T. This fails to account for process centering with symmetric tolerances, and presents an even g reater problem with asymmetric tolerances. To overcome the problem, several generalizations of Cpk have been proposed to handle processes with asymmetric
tolerances. Unfortunately, these generalizations understate or overstate the process capabil-ity in many cases, so re¯ ect the process potential and performance inaccurately. In this paper, we ® rst introdu ce a new index C "pk, which is shown to be superior to the existing
generalizations of Cpk. We then investigate the statistical properties of the natural estimator
of C "pk, assuming that the process is nor mally distributed.
1 Introduction
Process capability indices (PC Is), the purpose of which is to provide num erical m easures of whether or not the ability of a manufacturing process m eets a preset level of production tolerance, have received considerable research attention in recent years. Exam ples include Boyles (1991, 1994), Chan et al. (1988), Choi and O wen (1990), Franklin and Wasserman (1992), Johnson et al. (1994), K ane (1986), Kushler and Hurley (1992), Pearn and C hen (1996), Pearn et al. (1992) and m any others. Most research work, however, has focused on developing and investigating PCIs for processes with sym m etric tolerances.
Correspondence: W. L. Pearn, Departm ent of Industrial Engineering and Managem ent, National Chiao
Tung University, 1001 Ta H sueh Road, Hsinchu 30050 , Taiwan, Republic of China. Tel: 35 731630 ; Fax: 35 722392 .
0266-476 3/98/060801-1 0 $7.00 199 8 Carfax Publishing Ltd
A process is said to have a symm etric tolerance if the target value T is the
m idpoint of the speci® cation interval (LSL , U SL), i.e. T5 M5 (U SL
+
LSL) /2,where U SL and LSL are the upper and the lower speci® cation lim its. Among
various capability indices that have been introduced, Cpkde® ned as
Cpk5
d2 ½l 2 M½
3r (1)
where l is the process m ean, r is the process standard deviation and
d5 (U SL2 LSL) /2, has been the m ost widely used index in m anufacturing
indus-try, providing unitless m easures of process potential and perform ance. H owever,
as noted by m any quality control researchers and practitioners, Cpkis essentially a
m easure of process yield and is independent of T. In fact, we can calculate the process yield as
2U (3Cpk)2 1< % Yield< U (3Cpk)
if the process is norm ally distributed, w here U (´) is the cumulative function for the
standard norm al distribution. C onsequently, Cpk fails to account for process
centering with sym m etric tolerances, and encounters an even greater problem with asym m etric tolerances.
We consider the following example with asym m etric tolerance (LSL , T, USL),
where T5 [3(U SL)
+
(LSL)] /4. For processes A and B withl A5 T ,l B5 LSL+
d /2andr A5 r B5 d /6, both result in Cpk5 1. The expected proportions non-conform ing
are the sam e for both processes (approxim ately 0.135% ). We note that process A is on target, but process B is far away from its target. In fact, we have
l A2 l B5 T2 l B5 d . Clearly, Cpk fails to distinguish between ontarget and oþ
-target processes in this case.
To overcom e the problem , several generalizations of CpkÐ including C *pk, CÂpkand
SpkÐ have been proposed to handle processes w ith asym m etric tolerances. U
nfortu-nately, these generalizations understate or overstate the process capability in m any cases, particularly for cases where the preset production tolerances are asym m etric. T herefore, they re¯ ect the process potential and perform ance inaccurately. In this
paper, we ® rst review the existing generalizations of Cpk and then propose a new
index, w hich we refer to as C "pk. T he proposed new index C "pk is com pared with the
existing generalizations of Cpk in term s of som e process characteristics considered
by Boyles (1994), Choi and O wen (1990) and Pearn et al. (1992). The results
indicate that the proposed new index C "pk is superior to the existing generalizations
of Cpk. In addition, we investigate the statistical properties of the natural estim ator
of C "pk, assum ing that the process is norm ally distributed.
2 Existing generalizations of Cpk
T he ® rst generalization proposed for processes with asym m etric tolerances shifts one of the two speci® cation limits, so that the new (shifted) speci® cation lim its are symm etric to the target value (see C han et al., 1988; Kane, 1986). In other words,
the proposal replaces the original speci® cation lim its (T2 Dl, T
+
Du) w ith thenew sym m etric lim its (unjusti® ed som etim es) T6 d *, where d *5 m in{Dl, Du} ,
Du5 U SL2 T and Dl5 T2 LSL , and then applies the standard de® nition of Cpk.
G eneralization of process capability index Cpk 803
T he generalization m ay be w ritten as C *pk5
d *2 ½l 2 T½
3r (2)
We note that this generalization can understate the process capability, by restricting the process to a proper subset of the actual speci® cation range, as observed by
Boyles (1994). For exam ple, consider a process w ithl 5 T2 d /25 M andr 5 d /3,
where the target value is T5 [3(U SL)
+
(LSL )] /4. For this process, we have C *pk5 0. H owever, the expected proportion non-conforming is approxim ately 0.27% .
T herefore, the index C *pk understates the capability of the process in this case.
O bviously, if Du5 Dl, then the speci® cation tolerance becom es sym metric and the
generalization de® ned in equation (2) reduces to Cpkde® ned in equation (1).
The second generalization proposed for processes with asymm etric tolerances shifts both speci® cation lim its to obtain one that is sym m etric (Franklin & Wasser-m an, 1992; Kushler &aWasser-mp; Hurley, 1992). In other words, the proposal replaces
the original speci® cation lim its (T2 Dl, T
+
Du) with the new sym m etric lim its(unjusti® ed som etimes) T6 (Dl
+
Du) /2, and then applies the standard de® nitionof Cpk. W ith this generalization, the index de® ned in equation (1) can be rew ritten as
CÂpk5 d2 ½
l 2 T½
3r (3)
T his approach can either understate or overstate the process capability, depending
on the position ofl relative to T, as noted by Boyles (1994). For example, consider
the following two processes A and B with l A5 T2 d , r A5 d /6, l B5 T
+
3d /4,r B5 d /12 and T5 [3(USL)
+
(LSL)] /4. For process A, we have CÂpk5 0. However,the expected proportion non-conform ing is approxim ately 0.135% . Thus, CÂpk
understates the process capability in this case. In contrast, the index value given to
process B is CÂpk5 1. However, the expected proportions non-conform ing is
approxi-m ately 99.865% . Obviously, CÂpk overstates the process capability in this case. We
note that, if Du5 Dl, then the speci® cation tolerance becomes sym m etric and the
generalization de® ned in equation (3) reduces to Cpkde® ned in equation (1).
Boyles (1994) de® ned a sm ooth function S(x, y)5 U
2 1
[U (x) /2
+
U ( y) /2]3
where U (x) is the cum ulative function of the standard normal distribution. Based
on this sm ooth function, Boyles (1994) considered a generalization of Cpkde® ned as
Spk5 S ((U SL2 l ) /r , (l 2 LSL) /r )
which can be rewritten as Spk5 1 3U 2 1
{
U [ (U SL2 l ) /r ] 2+
U [ (l 2 LSL) /r ] 2}
(4)We note that, given Spk5 c , we can calculate the process yield as
U ((USL2 l ) /r )2 U ((LSL2 l ) /r )5 2U (3c)2 1
for arbitrary values of c. Therefore, Spk represents the actual process yield, unlike
Cpk, which is only approximately related to the process yield (see Boyles, 1994).
H owever, we point out that, for a ® xed standard deviation r , Spk obtains the
m axim al values not at l 5 T but atl 5 M5 (U SL
+
LSL) /2, which m ay re¯ ect theprocess capability inaccurately in some cases.
For example, consider the following case with asym m etric tolerance
(LSL , T, U SL)5 (26, 50, 58). Assum e that we have two processes A and B with
l A5 T5 50 and l B5 34, respectively, and standard deviationr A5 r B5 8. It is easy
to verify that the Spkvalues for processes A and B are the sam e (0.468), so both
processes have the sam e yield. W hile process A is on target, process B is severely
oþ target.
3 New generalization C "pk
In this section, we propose a new generalization of Cpkfor processes with asym m etric
tolerances, which we refer to as C "pk. The design of the new index C "pk is based on
the following criteria by Boyles (1994), Choi and Owen (1990) and Pearn et al. (1992) in analyzing and com paring the existing capability indices: (a) process yield; (b) process centering; (c) other process characteristics.
The new index C "pk m ay be de® ned as
C "pk5
d *2 A *
3r (5)
where
A*5 m ax{d *(l 2 T ) /Du, d *(T2 l ) /Dl}
O bviously, if T5 M (sym m etric tolerance), then A*5 ½l 2 T½ and C "pk reduces to
the basic index Cpkde® ned in equation (1).
We can show that C "pk< Spk for any level c and all values of l . T hus, given a
process with capability C "pk5 c, the fraction non-conforming is guaranteed to be no
greater than that of a process with Spk5 c ; it is 2[12 U (3c)] if the process is
norm ally distributed. Further, given C "pk> c, the bounds on ½l 2 T½ m ay be
calcu-lated as T2 Dl< l < T
+
Du. In developing the new index C "pk, we replaced d and½l 2 T½ in equation (1) by d * and A* respectively. This replacement ensures that
the new index C "pk obtains the m axim al values at l 5 T, regardless of whether the
preset speci® cation tolerances are sym m etric or asym m etric. For processes with asym m etric tolerances, the corresponding loss function is also asym m etric to T. We take into account the asym m etry of the loss function by adding the factors d * /Du and 2 d * /Dl to l 2 T, according to whether l is greater or less than T.
T he factors d * /Du and 2 d * /Dl ensure that, if there are two processes A and B
with l A> T and l B< T satisfying (l A2 T )/Du5 (T2 l B) /Dl, then the index values
given to processes A and B m ust be the sam e. It is easy to verify that, if the process
is on the speci® cation lim its (l 5 LSL or l 5 U SL), then C "pk5 0. In contrast, if
LSL< l < USL , then we have C "pk> 0.
To com pare the new index with the existing indices, we consider the following
exam ple with speci® cations (LSL , T, U SL )5 (10, 40, 50). Since Du5 U SL2 T5 10
and Dl5 T2 LSL5 30, the process has an asymm etric tolerance. Table 1 displays
the values of the ® ve indices, Cpk, C *pk, CÂpk, Spkand C "pk for various values ofl with
a ® xed standard deviation r 5 10 /3. In Table 1, we note that Cpk and Spk are
m axim ized by l 5 M5 30, and the two indices give the sam e index values to
processes A and B, satisfying l A2 M5 M2 l B. Thus, forl A5 40 andl B5 20, the
G eneralization of process capability index Cpk 805
TABLE1. Comparison between the ® ve indices for various values ofl and ® xed r 5 10 /3, with (LSL, T, USL) 5 (10, 40, 50) l Cpk C *pk CÂpk Spk C "pk 10 0.000 0.000 0.000 0.225 0.000 11 0.100 0.000 0.000 0.291 0.033 12 0.200 0.000 0.000 0.364 0.067 13 0.300 0.000 0.000 0.443 0.100 14 0.400 0.000 0.000 0.525 0.133 15 0.500 0.000 0.000 0.611 0.167 16 0.600 0.000 0.000 0.699 0.200 17 0.700 0.000 0.000 0.789 0.233 18 0.800 0.000 0.000 0.881 0.267 19 0.900 0.000 0.000 0.974 0.300 20 1.000 0.000 0.000 1.068 0.333 21 1.100 0.000 0.100 0.163 0.367 22 1.200 0.000 0.200 1.259 0.400 23 1.300 0.000 0.300 1.355 0.433 24 1.400 0.000 0.400 1.451 0.467 25 1.500 0.000 0.500 1.548 0.500 26 1.600 0.000 0.600 1.646 0.533 27 1.700 0.000 0.700 1.743 0.567 28 1.800 0.000 0.800 1.841 0.600 29 1.900 0.000 0.900 1.938 0.633 30 2.000 0.000 1.000 2.000 0.667 31 1.900 0.100 1.100 1.938 0.700 32 1.800 0.200 1.200 1.841 0.733 33 1.700 0.300 1.300 1.743 0.767 34 1.600 0.400 1.400 1.646 0.800 35 1.500 0.500 1.500 1.548 0.833 36 1.400 0.600 1.600 1.451 0.867 37 1.300 0.700 1.700 1.355 0.900 38 1.200 0.800 1.800 1.259 0.933 39 1.100 0.900 1.900 1.163 0.967 40 1.000 1.000 2.000 1.068 1.000 41 0.900 0.900 1.900 0.974 0.900 42 0.800 0.800 1.800 0.881 0.800 43 0.700 0.700 1.700 0.789 0.700 44 0.600 0.600 1.600 0.699 0.600 45 0.500 0.500 1.500 0.611 0.500 46 0.400 0.400 1.400 0.525 0.400 47 0.300 0.300 1.300 0.443 0.300 48 0.200 0.200 1.200 0.364 0.200 49 0.100 0.100 1.100 0.291 0.100 50 0.000 0.000 1.000 0.225 0.000
process yields (approxim ately 99.865%) and the index values are all the sam e for
both processes. W hile process A is on target, process B is severely oþ target. For
C *pk, the index values given to processes with l < T are too low. In fact, we have
C *pk5 0 for all l < 30. We note that, forl 5 30, the process yield is approximately
100%. Clearly, C *pk understates the process capability in this case. Sim ilarly, the
index CÂpk understates the process capability for l < 30 and overstates it forl > 30.
In fact, for l 5 50, the process yield is approximately 50% , but CÂpk5 1.
Further, the new index C "pk has taken into account the asym m etry of the loss
function. Thus, given two processes A and B w ith l A> T and l B< T , satisfying
(l A2 T ) /Du5 (T2 l B)/Dl, the (new) index values given to processes A and B are
TABLE 2. Corresponding index values for processes that satisfy (l A2 T ) / Du5 (T2 l B)/Dl l Cpk C*pk CÂpk Spk C"pk 37 1.300 0.700 1.700 1.355 0.900 41 0.900 0.900 1.900 0.974 0.900 34 1.600 0.400 1.400 1.646 0.800 42 0.800 0.800 1.800 0.881 0.800 31 1.900 0.100 1.100 1.938 0.700 43 0.700 0.700 1.700 0.789 0.700 28 1.800 0.000 0.800 1.841 0.600 44 0.600 0.600 1.600 0.699 0.600 25 1.500 0.000 0.500 1.548 0.500 45 0.500 0.500 1.500 0.611 0.500 22 1.200 0.000 0.200 1.259 0.400 46 0.400 0.400 1.400 0.525 0.400 19 0.900 0.000 0.000 0.974 0.300 47 0.300 0.300 1.300 0.443 0.300 16 0.600 0.000 0.000 0.699 0.200 48 0.200 0.200 1.200 0.364 0.200 13 0.300 0.000 0.000 0.443 0.100 49 0.100 0.100 1.100 0.291 0.100 10 0.000 0.000 0.000 0.225 0.000 50 0.000 0.000 1.000 0.225 0.000
the sam e. Table 2 is a sum m ary of the processes (taken from Table 1) that
satisfy (l A2 T ) /Du5 (T2 l B)/Dl. For exam ple, consider processes A and B with
l A5 41> T and l B5 37< T. C learly, we have (l A2 T )/Du5 1 /10 and (T2 l B)/
Dl5 3 /305 1 /10. Checking Table 2 for the index values that correspond tol A5 41
and l B5 37, we have C "pk5 0.900 for both processes A and B. However, the values
of Cpk and Spk given to process B are considerably higher than those given to
process A, and the values of C *pk and CÂpk given to process B are lower than those
given to process A.
4 Estim ation of C "pk
To estim ate the new index C "pk, we consider the natural estimator which can be
de® ned as CÃ "pk5 d *2 AÃ * 3S where AÃ *5 m ax{d *(XÅ 2 T ) /Du, d *(T2 XÅ ) /Dl}
G eneralization of process capability index Cpk 807 and XÅ 5
(
R
n i5 1 xi)
/
n S5[
(n2 1)2 1R
n i5 1 (xi2 XÅ ) 2]
1 / 2are conventional estim ators ofl and r w hich may be obtained from a process that
is demonstrably stable (well in control). In the case where the production tolerance
is sym m etric (i.e. T5 M ), AÃ * may be simpli® ed as ½XÅ 2 T½ and the estim ator CÃ "pk
is reduced to
CÃ pk5 m in{(U SL2 XÅ ) /3S, (XÅ2 LSL) /3S}
i.e. the natural estimator of Cpkdiscussed by Kotz et al. (1993). Therefore, we m ay
view the estim ator CÃ "pk as a direct extension of CÃpk. Assum e that the process is
norm ally distributed. T hen, the estim ator CÃ "pk can be rewritten as
CÃ "pk5 f 1 /2 3 K 2 1 /2
[
d * r 2 d * n1 /2 m ax{
Z Du ,2 Z Dl}
]
where K5 fS2/r 2 is distributed as v 2f, and Z5 n
1 /2
(XÅ 2 T) /r is distributed as
N (d , 1), with f5 n2 1 andd 5 n1 /2(l 2 T ) /r . Further, since XÅ and S2
are m utually independent, Z and K are also m utually independent. To obtain the expected value
and variance of CÃ "pk, we ® rst calculate the following:
E
(
max{
Z Du ,2 Z Dl}
)
5(
1 Du+
1 Dl)
1 (2p )1 /2exp(
2 d 2 2)
+
max{
d Du ,2 d Dl}
[12 2U (2 ½d ½)]+
(
d Du 2 d Dl)
U (2 ½d ½) E(
m ax2{
Z Du ,2 Z Dl}
)
5 1 2(
1 D2u+
1 D2l)
+
(
d 2 D2u+
d 2 D2l)
U (2 ½d ½)+
(
1 D2u 2 1 D2l)
{
d (2p )1 /2exp(
2 d 2 2)
+
d 2½d ½ [12 2U (2 ½d ½)]}
+
max2{
d Du ,2 d Dl}
[12 2U (2 ½d ½)]T herefore, the rth m oment (about zero) of CÃ "pk may be obtained as
E(CÃ "pk)r5 fr /2 3r E(K 2 r /2 )
R
r j5 0(
r j)(
d * r)
j(
2 d * n1 /2)
r2 j E(
max{
Z Du ,2 Z Dl}
)
r2 jH ence, we have E(CÃ "pk)5
{
C "pk2 1 6(
d * Du+
d * Dl)(
2 np)
1 /2 exp(
2 d 2 2)
2 1 3(
d * Du 2 d * Dl)(
l 2 T r)
U (2 ½d ½)+
2 3m ax{
(
d * Du)(
l 2 T r)
,(
d * Dl)(
T2 l r)
}
U (2 ½d ½)}
b 2 1 f Var(CÃ "pk)5 f2 2 f(
(C "pk) 2+
4 9(
d * r)
max{
(
d * Du)(
l 2 T r)
,(
d * Dl)(
T2 l r)
}
U (2 ½d ½) 2 1 9(
d * r)(
d * Du+
d * Dl)(
2 np)
1 / 2 exp(
2 d 2 2)
+
1 18n[
(
d * Du)
2+
(
d * Dl)
2]
+
1 9[
(
d * Du)
2+
(
d * Dl)
2]
(
l 2 T r)
2 U (2 ½d ½) 2 2 9(
d * Du 2 d * Dl)(
d * r)(
l 2 T r)
U (2 ½d ½) 2 2 9m ax 2{
(
d * Du)(
l 2 T r)
,(
d * Dl)(
T2 l r)
}
U (2 ½d ½)+
1 9n[
(
d * Du)
2 2(
d * Dl)
2]
{
d (2p )1 /2exp(
2 d 2 2)
+
d 2½d ½ [12 2U (2 ½d ½)]}
)
2 [E (CÃ "pk) ] 2In the case w here the production tolerance is sym m etric (T5 M ), we have
E(CÃ "pk)5
[
Cpk2 1 3(
2 np)
1 /2 exp(
2 d 2 2)
+
2 3 ½l 2 T½ r U (2 ½d ½)]
b 2 1 f 5 E(CÃpk) Var(CÃ "pk)5 f2 2 f[
(Cpk) 2+
4 9(
d * r)
½l 2 T½ r U (2 ½d ½)+
1 9n 2 2 9(
d * r)(
2 np)
1 /2 exp(
2 d 2 2)
]
2 [E(CÃpk) ] 2 5 Var(CÃpk)T he results are the sam e as those calculated by Kotz et al. (1993).
G eneralization of process capability index Cpk 809
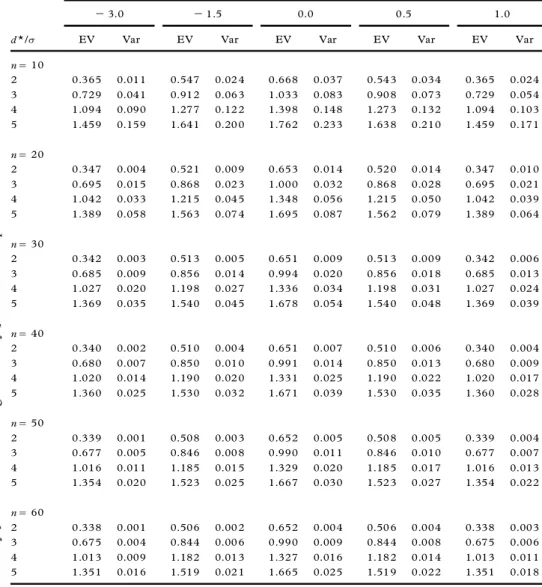
TABLE3. Moments of CÃ "pk
Results for the follow ing values of (l 2 T ) /r
2 3.0 2 1.5 0.0 0.5 1.0
d * /r EV Var EV Var EV Var EV Var EV Var
n5 10 2 0.365 0.011 0.547 0.02 4 0.668 0.037 0.54 3 0.034 0.365 0.024 3 0.729 0.041 0.912 0.06 3 1.033 0.083 0.90 8 0.073 0.729 0.054 4 1.094 0.090 1.277 0.12 2 1.398 0.148 1.27 3 0.132 1.094 0.103 5 1.459 0.159 1.641 0.20 0 1.762 0.233 1.63 8 0.210 1.459 0.171 n5 20 2 0.347 0.004 0.521 0.00 9 0.653 0.014 0.52 0 0.014 0.347 0.010 3 0.695 0.015 0.868 0.02 3 1.000 0.032 0.86 8 0.028 0.695 0.021 4 1.042 0.033 1.215 0.04 5 1.348 0.056 1.21 5 0.050 1.042 0.039 5 1.389 0.058 1.563 0.07 4 1.695 0.087 1.56 2 0.079 1.389 0.064 n5 30 2 0.342 0.003 0.513 0.00 5 0.651 0.009 0.51 3 0.009 0.342 0.006 3 0.685 0.009 0.856 0.01 4 0.994 0.020 0.85 6 0.018 0.685 0.013 4 1.027 0.020 1.198 0.02 7 1.336 0.034 1.19 8 0.031 1.027 0.024 5 1.369 0.035 1.540 0.04 5 1.678 0.054 1.54 0 0.048 1.369 0.039 n5 40 2 0.340 0.002 0.510 0.00 4 0.651 0.007 0.51 0 0.006 0.340 0.004 3 0.680 0.007 0.850 0.01 0 0.991 0.014 0.85 0 0.013 0.680 0.009 4 1.020 0.014 1.190 0.02 0 1.331 0.025 1.19 0 0.022 1.020 0.017 5 1.360 0.025 1.530 0.03 2 1.671 0.039 1.53 0 0.035 1.360 0.028 n5 50 2 0.339 0.001 0.508 0.00 3 0.652 0.005 0.50 8 0.005 0.339 0.004 3 0.677 0.005 0.846 0.00 8 0.990 0.011 0.84 6 0.010 0.677 0.007 4 1.016 0.011 1.185 0.01 5 1.329 0.020 1.18 5 0.017 1.016 0.013 5 1.354 0.020 1.523 0.02 5 1.667 0.030 1.52 3 0.027 1.354 0.022 n5 60 2 0.338 0.001 0.506 0.00 2 0.652 0.004 0.50 6 0.004 0.338 0.003 3 0.675 0.004 0.844 0.00 6 0.990 0.009 0.84 4 0.008 0.675 0.006 4 1.013 0.009 1.182 0.01 3 1.327 0.016 1.18 2 0.014 1.013 0.011 5 1.351 0.016 1.519 0.02 1 1.665 0.025 1.51 9 0.022 1.351 0.018
Note: EV, expected value.
Som e num erical values of E(CÃ "pk) and Var(CÃ "pk) are presented in Table 3. T he
readers are encouraged to exam ine the colum n that corresponds to l 5 T m ost
carefully. Corresponding values of C "pk are presented in Table 4. We note that CÃ "pk
is a biased estim ator of C "pk. The resultant bias is positive for all cases show n in
Table 3 for which l
¹
T. W hen l 5 T, the bias is positive for n5 10 but becom esnegative for larger values of n. (For d * /r 5 2.0, it is negative for all n> 20; for d * /
r 5 3.0, it is negative for all n> 30; for d * /r 5 4.0, it is negative for all n> 40; for
d * /r 5 5.0, it is negative for all n> 60.) As n becom es very large, the bias becom es
0. This is explored in m ore detail in Table 5, which presents the values of E(CÃ "pk)
for (l 2 T) /r 5 0 and d * /r 5 3. We note that, in this case, the `theoretical’ value
of C "pk is 1.
TABLE4. Values of C "pk
Results for the follow ing values of (l 2 T ) /r
d * /r 2 3.0 2 1.5 0.0 0.5 1.0
2.0 0.333 0.500 0.667 0.500 0.333
3.0 0.667 0.833 1.000 0.833 0.667
4.0 1.000 1.167 1.333 1.167 1.000
5.0 1.333 1.500 1.667 1.500 1.333
TABLE5. Values of E(CÃ "pk) forl 5 T and d * /r 5 3, corresponding to C "pk
5 1 for a series of increasing values of n
Sample size n E(CÃ "pk) Sample size n E(CÃ "pk)
10 1.033 750 0.995 20 1.000 1 200 0.996 30 0.994 2 120 0.997 40 0.991 4 420 0.998 50 0.990 12 960 0.999 150 0.992 122 740 1.000 490 0.994 R EFER E NCES
BOYLES, R. A. (1991 ) The Taguchi capability index, Jour nal of Quality Technology, 23, pp. 17 ± 26. BOYLES, R. A. (1994 ) Process capability with asymmetric tolerances, Communications in Statistics:
Computation & Simulation, 23, pp. 615 ± 643.
CH AN, L. K., CHENG, S. W. & SPIRING, F. A. (1988 ) A new measure of process capability Cpm, Journal
of Quality Technology, 20, pp. 162 ± 175.
CHOI, B. C. & OWEN, D. B. (1990 ) A study of a new capability index, Communications in Statistics:
T heor y and Methods, 19, pp. 1231 ± 1245.
FRANKLIN, L. A. & WASSERMAN, G. (1992 ) Bootstrap lower con® dence limits for capability indices,
Jour nal of Q uality Technology, 24, pp. 196 ± 210.
JOHNSON, N. L., KOTZ, S. & PEARN, W. L. (1994 ) Flexible process capability indices, Pakistan Jour nal
of Statistics, 10A , 23 ± 31.
KANE, V. E. (1986 ) Process capability indices, Jour nal of Q uality Technology, 18, pp. 41 ± 52.
KOTZ, S., PEARN, W. L. & JOHNSON, N. L. (1993 ) Some process capability indices are more reliable than one might think, Applied Statistics, 42, pp. 55 ± 62.
KUSHLER, R. H. & HURLEY, P. (1992 ) Con® dence bounds for capability indices, Journal of Quality
Technology, 24, pp. 188 ± 195.
PEARN, W. L., KOTZ, S. & JOHNSON, N. L. (1992 ) Distributional and inferential properties of process capability indices, Jour nal of Q uality Technology, 24, pp. 216 ± 231.
PEARN, W. L. & CHEN, K. S. (1996 ) Bayesian-like Estimators of Cpk, Communications in Statistics:
Computation & Simulation, 25, pp. 321 ± 329.