Correlation of In vivo and In vitro Measurements
of Sun Protection Factor
MING-THAU SHEU1, CHENG-WEN LIN1, MING-CHUAN HUANG2, CHAO-HUI SHEN3AND HSIU-O HO1*
1.Graduate Institute of Pharmaceutical Sciences, Taipei Medical University, 250 Wu-Hsing Street, Taipei 110, Taiwan, R.O.C. 2.National Laboratories of Foods and Drugs, Department of Health, Executive Yuan, 161-2, Kuen Yang St., Nankang,
Taipei 115, Taiwan, R.O.C.
3.Department of Dermatology Taiwan Adventist Hospital, 424, Sec 2, Pa Te Road, Taipei 115, Taiwan
(Received: August 15, 2002; Accepted: January 9, 2003)
ABSTRACT
In this study, the correlation of measuring sun protection factor (SPF) values between in vivo and in vitro tests was investigated for the purpose of monitoring the in vivo efficacy of sunscreen products using in vitro tests instead of in vivo tests to lessen the labor burden. Eight products, including standard product of the US FDA (SPF 4) and COLIPA (SPF 15) and six commercial products, were included for comparison. For the in vivo test, the test sample was evenly applied to the skin at a concentration of 2 mg/cm2using a finger stall. The lag time between application and UV irradiation was about 15 min. A Multiport UV Solar Simulator with six outputs was used as the UV source. Six test sites were exposed to UV irradiation with a progression of UV doses of 25% from output to output. The minimal erythemal dose (MED) was assessed visually after 24 hr of UV exposure. During the in vitro test, each sunscreen was evenly spread on 3M Transpore®tape and the transmittance was measured with a UV transmittance analyzer equipped with a single-flash xenon lamp. The results demonstrated that the SPF values of the in vivo tests were close to the claimed value, indicating that SPF values measured in this study were reliable. However, statistical analysis by t-test or ANOVA showed that significant difference in SPF values existed between in vivo and in vitro tests for most products. Thus, a correlation of SPF measurement between in vitro and in vivo tests could not be constructed. According to these results, using a UV transmittance analyzer to measure SPF values is not a reliable method to correlate with the results of in vivo tests, and so this is not a practical way to monitor the effectiveness of sunscreen products.
Key words: in vitro test, in vivo test, SPF, Correlation
INTRODUCTION
Sunscreens are intended to protect the skin from the harmful effects of the sun, including the appearance of erythema in the short term and actinic photo-ageing and/or skin cancers in the long term. The evaluation of a sunscreen’s efficacy for ultraviolet B (UVB) in humans is based on the determination of the minimum erythemal dose (MED). Roughly, the test consists of applying the product to a volunteer’s skin, exposing protected and unprotected skin to ultraviolet rays (UVR) from a solar simulator, and determining the respective doses necessary to induce minimum sunburn on protected and unprotected skin (MEDp and MEDu) for each volunteer. Individual SPF is the ratio of these two doses (SPF = MEDp/MEDu) for each volunteer, and SPF of the product is the mean of individual SPFs.
It is important that SPF value on a product label gives a good indication of the level of protection a sun protection product will provide. Fundamental to achieving reliable labeling is the test method used. The method should be technically sound and reproducible in laboratories. Establishing a standard test method is an essential
require-ment or standardized SPF labeling of sun protection products from different manufacturers. Although there are a number of national standard SPF methods worldwide, there is none for Taiwan (ROC) so far.
With the publication of the US Food and Drug Administration (FDA)’s tentative monograph on sunscreens
in 1978(1), which was modified in 1993(2), the first national
standard method was established. A number of other countries followed by publishing methods which were essentially hybrids of the FDA method. The exception was
the German DIN Standard published in 1984(3) which had
key elements different from that of all other published tests. The Comité de Liaison de la Parfumerie (COLIPA) Task Force ‘Sun Protection Measurement’ was initiated in 1990
and published its test method in 1996(4,5). Australia/New
Zealand established a test method in 1997. The Japan Cosmetic Industry Association (JCIA) established a test
method in 1992 and revised in 1997(6). The final
monograph of regulations for sunscreen drug products was
published by the FDA in 1999(7).
Most of the published test methods adopt an in vivo method based on measurements on human skin, which is very time-consuming and expensive. Therefore, construct-ing an in vitro method capable of correlatconstruct-ing well with in
vivo methods in the measurement of SPF values is of
* Author for correspondence. Tel & Fax:886-2-23771942; E-mail:hsiuoho@tmu.edu.tw
interest to researchers(8) as an attempt to find a substitute
for in vivo methods(9,10). Since no official test method has
been published in Taiwan, establishment of a test method for SPF values is urgently required. In this study, a modified version of an in vivo testing method based on the FDA monograph was adopted, and its correlation with an in vitromethod was examined.
METHODS
I. Materials
Two standard sunscreen products were selected as ref-erences. One is the standard homosalate sunscreen (8%) with a mean SPF value of 4.47 (S.D. = 1.28), as suggested by the US FDA. Another is the COLIPA high standard (SPF = 15). Two standard sunscreen products and six com-mercially available products were purchased from the market. Active ingredients in each product and additional detailed information are listed in Table 1.
II. Methods
(I) In vitro testing of SPF values
3M Transpore tape is placed in a single layer on clean 2 mm thick quarts slides. An area of at least two square
inches (12.5 cm2) is applied to enable measurement at least
five non-overlapping spots. A minimum of five samples was prepared for each sunscreen to be tested. At the same time, a reference sample of Transpore Tape (Minneapolis, USA) was prepared. After placing the sample plate inside
an Ultraviolet Transmittance Analyzer (UV-1000S, Solar Light Company, Philadelphia, PA, USA), exposure to UV irradiation with a wavelength range of 280~400 nm was initiated. This step ensured the transmittance of the Transpore tape. To prepare the sunscreen samples, a 1-mL fine needle syringe was used to transfer sample. For a two
square inch (12.5 cm2) sample size, the slide was placed on
an analytical balance and approximately 2 mg/cm2 was
evenly distributed using a finger stall, as required by the FDA. After waiting for 15 min, the sample plate was placed inside the analyzer again for exposure to UV irradia-tion as before. Irradiairradia-tion took place at five randomly selected points, and each point was scanned twice. The reading was taken by the analyzer, and calculation of the SPF value was based on the following equation with the use of a built-in software:
where El is defined as the CIE (Commission Internationale de l’Eclarirage) erythemal spectral effective-ness, Sl is designated as the solar spectral irradiance, and Tl is the spectral transmittance of the sample as measured on the UV-1000.
(II) In vivo testing of SPF values
A test panel with a limit of 25 subjects with skin
pho-totypes II to III~IV(11) was recruited for each product, and
informed consent was obtained from each subject. Analysis requires valid data from at least 20 subjects. General in
SPF E S d E S T d nm nm nm nm = ◊ ◊ ◊ ◊ ◊
Ú
Ú
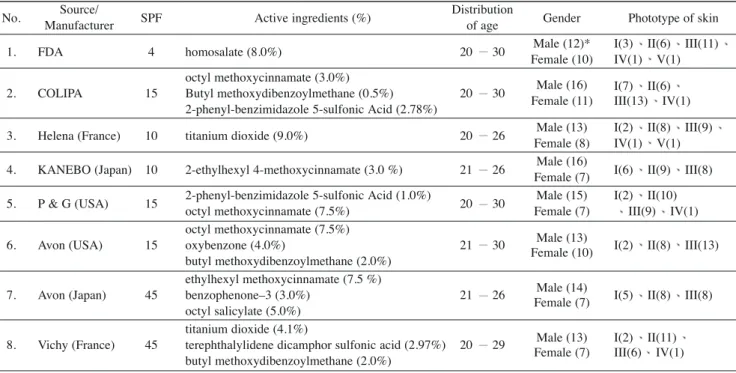
l l l l l l l 280 400 280 400Table 1.Active ingredients and SPF values for sunscreen products tested and the distribution of age, gender, and phototype of skin in the panel of volunteers
No. Source/ SPF Active ingredients (%) Distribution Gender Phototype of skin
Manufacturer of age
1. FDA 4 homosalate (8.0%) 20 30 Male (12)* I(3) II(6) III(11)
Female (10) IV(1) V(1) octyl methoxycinnamate (3.0%)
I(7) II(6) 2. COLIPA 15 Butyl methoxydibenzoylmethane (0.5%) 20 30 Male (16)
2-phenyl-benzimidazole 5-sulfonic Acid (2.78%) Female (11) III(13) IV(1) 3. Helena (France) 10 titanium dioxide (9.0%) 20 26 Male (13) I(2) II(8) III(9)
Female (8) IV(1) V(1) 4. KANEBO (Japan) 10 2-ethylhexyl 4-methoxycinnamate (3.0 %) 21 26 Male (16) I(6) II(9) III(8)
Female (7)
5. P & G (USA) 15 2-phenyl-benzimidazole 5-sulfonic Acid (1.0%) 20 30 Male (15) I(2) II(10)
octyl methoxycinnamate (7.5%) Female (7) III(9) IV(1)
octyl methoxycinnamate (7.5%)
Male (13)
6. Avon (USA) 15 oxybenzone (4.0%) 21 30 I(2) II(8) III(13)
butyl methoxydibenzoylmethane (2.0%) Female (10) ethylhexyl methoxycinnamate (7.5 %)
Male (14)
7. Avon (Japan) 45 benzophenone–3 (3.0%) 21 26 I(5) II(8) III(8)
octyl salicylate (5.0%) Female (7)
titanium dioxide (4.1%)
Male (13) I(2) II(11) 8. Vichy (France) 45 terephthalylidene dicamphor sulfonic acid (2.97%) 20 29
butyl methoxydibenzoylmethane (2.0%) Female (7) III(6) IV(1) *: number of volunteers
vivo testing procedures for determining SPF values were adopted from US FDA guidelines. Table 1 gives further details concerning the distribution of age, gender, and skin phototype of the volunteers. The application area was delineated by using a template on the back of the volunteer. The sample quantity was weighed and evenly applied to the
skin at an area of 2.0 mg/cm2using a finger stall. The time
between applying the product and irradiation was 15 min.
Each of the six test sites (area of 5 ¥ 10 cm2) was exposed
to UV illumination (Multiport Solar UV Simulator Model 601) for 45 or 60 sec with a progression of UV doses of 25% from (output to output). The minimal erythemal doses (MEDs) were estimated visually after 22~24 hr. of UV
exposure by a dermatologist. MED (millijoule (mj) / cm2)
for unprotected skin was determined for each volunteer. The exact series of exposures (refer to Table 2) to be given to the protected skin were determined by the previously established MED for unprotected skin and by the expected SFP of the test sunscreen. The SPF value of the test product was then calculated from the UV radiation dose required to produce MED of the protected skin and from the dose of UV radiation required to produce MED of the unprotected skin as follows:
(III) Statistical analysis
The arithmetic mean of individual SPF and the standard deviation were calculated. The 95% confidence interval (CI) was calculated as CI = ts/sqrt (n) with the low CI = the mean SPF – CI and the high CI = the mean SPF + CI; t is the t-value from a two-sided Student’s t distribution table, s is the standard deviation of the mean SPF, and n is the number of subjects included in the calculation of the
SPF MED mj cm MED mj cm = ( )( ) ( )( ) protected skin unprotected skin 2 2
mean SPF. One-way ANOVA was applied to examine dif-ferences between in vitro and in vivo tests.
RESULTS AND DISCUSSION
Table 2 shows MED values of unprotected skin for subjects recruited in this study. The values range from 0.85
to 2.0 mj/cm2. This indicates that the majority of
volun-teers who can be recruited in Taiwan belong to skin type II
(0.85~1.17 mj/cm2), III (1.0~1.6 mj/cm2), and IV (1.5~2.0
mj/cm2) based on classification of the different skin types
suggested by MED. However, FDA guidelines require fair-skin volunteers with fair-skin types I, II, and III. This criteria will not be suitable in Taiwan. Guidelines proposed by Taiwanese authorities should take this difference into account and suggest solutions for the selection of appropri-ate skin types.
In vitro test results on two standard formulations (FDA/SPF-4 and COLIPA/SPF-15) and six commercial products are listed in Table 3. Mean values of individual SPFs for the two standard formulations determined by the in vitrotest method are 4.76 ± 0.33 (CV = 7.0%) and 10.36 ± 0.60 (CV = 5.8%), respectively, and 95% CIs for the mean SPF are 4.35~5.18 (4.76 ± 0.41) and 9.61~11.10 (10.36 ± 0.75), respectively. Variations for the two standard formulations are quite small, indicating that the repro-ducibility of the in vitro test method is acceptable. However, in order for the SPF determination of a test product to be considered valid, the SPF of the standard for-mulation must fall within the standard deviation range of the expected SPF (i.e., 4.47 ± 1.279) and the 95% CI for the mean SPF must contain the value 4. The SPF value of the standard US FDA formulation satisfies only the standard deviation range requirement, since the 95% CI for the mean SPF does not contain the value 4. Both require-ments are not met by the standard COLIPA formulation. The accuracy of in vitro test is considered poor, and this test method is concluded to be invalid.
According to US FDA guidelines, labeled SPF for each product is equal to the largest whole number minus the mean CI, and the drug product is classified into a product classification designation (PCD) as follows: if 20 + CI < the mean, the PCD is ultra high; if 12 + CI < the mean < 20 + CI, the PCD is very high; if 8 + CI < the mean < 12 + CI, the PCD is high; If 4 + CI < the mean < 8 + CI, the PCD is moderate; if 2 + CI < the mean < 4 + CI, the PCD is
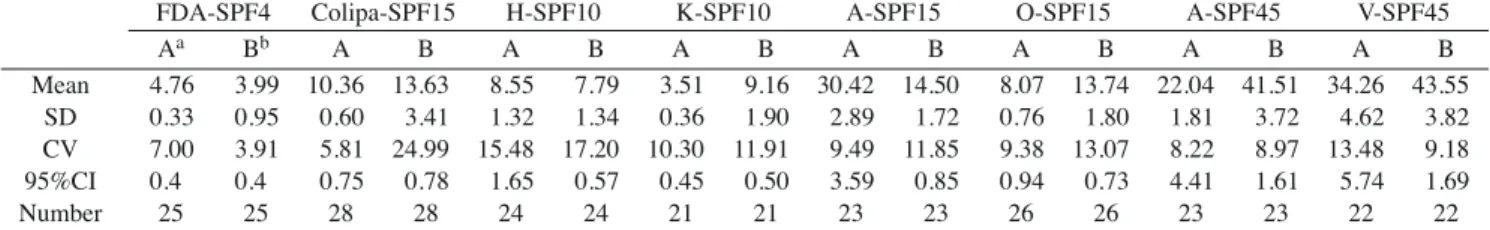
Table 3.Test results of SPF for each product measured by in vitro and in vivo method
FDA-SPF4 Colipa-SPF15 H-SPF10 K-SPF10 A-SPF15 O-SPF15 A-SPF45 V-SPF45
Aa Bb A B A B A B A B A B A B A B Mean 4.76 3.99 10.36 13.63 8.55 7.79 3.51 9.16 30.42 14.50 8.07 13.74 22.04 41.51 34.26 43.55 SD 0.33 0.95 0.60 3.41 1.32 1.34 0.36 1.90 2.89 1.72 0.76 1.80 1.81 3.72 4.62 3.82 CV 7.00 3.91 5.81 24.99 15.48 17.20 10.30 11.91 9.49 11.85 9.38 13.07 8.22 8.97 13.48 9.18 95%CI 0.4 0.4 0.75 0.78 1.65 0.57 0.45 0.50 3.59 0.85 0.94 0.73 4.41 1.61 5.74 1.69 Number 25 25 28 28 24 24 21 21 23 23 26 26 23 23 22 22
aA: in vitro method; bB: in vivo method; SD: standard deviation; CV: coefficient of variation; CI: confidence interval
Table 2.The exact series of exposures for the various expected SPF values of the tested sunscreens
SPF < 8
The MED times 0.64Xa ?W-X?*@)?N@H@??J5??.Y? 0.8X ?W-X ?*@) ?N@H@? ?J5? ?.Y? 0.9X ?W-X ?*@) ?N@H@? ?J5? ?.Y? 1.00X ?W-X ?*@) ?N@H@? ?J5? ?.Y? 1.10X ?W-X ?*@) ?N@H@? ?J5? ?.Y? 1.25X 8 < SPF <15
The MED times 0.69X ?W-X?*@)?N@H@??J5??.Y? 0.83X ?W-X ?*@) ?N@H@? ?J5? ?.Y? 0.91X ?W-X ?*@) ?N@H@? ?J5? ?.Y? 1.00X ?W-X ?*@) ?N@H@? ?J5? ?.Y? 1.09X ?W-X ?*@) ?N@H@? ?J5? ?.Y? 1.20X SPF >15
The MED times 0.76X ?W-X?*@)?N@H@??J5??.Y? 0.87X ?W-X ?*@) ?N@H@? ?J5? ?.Y? 0.93X ?W-X ?*@) ?N@H@? ?J5? ?.Y? 1.00X ?W-X ?*@) ?N@H@? ?J5? ?.Y? 1.07X ?W-X ?*@) ?N@H@? ?J5? ?.Y? 1.15X
minimal; if the mean < 2 + CI, the product cannot be labeled as a sunscreen and cannot display a SPF value. CI is defined in the statistical analysis section, and the mean is the average of individual SPFs for each test product. Based on the test results of this in vitro method shown in Table 3, the labeled SPF values (mean minus CI) for the six com-mercial products are 8, 3, 30, 8, 22, and 34, respectively, and they are classified as moderate (4~8), minimal (2~4), ultra high (> 20), moderate (4~8), ultra high (> 20), and ultra high (> 20), respectively. Table 3 further reveals the mean value and the standard deviation of each individual SPF for these six commercial products. Only H-SPF10, A-SPF45, and V-SPF45 demonstrated a similar PCD classifi-cation to that claimed by the commercial product. However, values of the sample means are statistically differed from the labeled SPF value for five (K-SPF10, A-SPF15, O-A-SPF15, A-SPF45, and V-SPF45) out of six products based on the null hypothesis of sample mean being equivalent to the claimed SPF value. This reveals that this in vitro test method cannot precisely and accurately yield the same SPF value claimed by the manufacturers.
Since distribution of the sample on the plate was
reported to be even, accurate, and reproducible(12)and
suit-ability of the light source has been validated according to
the guidelines(7), deviations from the claimed SPF value
with in vitro testing may be attributable to matrix and for-mulation variables. If the matrix of the samples is too liquefied or too solidified to produce an even distribution, an accurate and reproducible measurement of UV
irradia-tion may not be possible(10). Formulations containing
higher percentage of alcohol or more than two organic sunscreen ingredients, or exhibit a more hydrophobic nature, were reported to have greater influences on the
mea-surement of the SPF value using this in vitro method(13).
The results for A-SPF15, O-SPF15, A-SPF45, and V-SPF45, which contained more than two organic sunscreen ingredients and had larger deviation from the claimed SPF value, were consistent with the previous findings
The test results of the in vivo method are also shown in Table 3. The labeled SPF values (95% CI) for the two standard formulations and six commercial products measured by this in vivo method were: 3 (3.59~4.38), 12 (12.85~14.41), 7 (7.22~8.35), 8 (8.66~9.66), 13 (13.75~14.46), 13 (13.01~14.46), 39 (39.90~43.12), and 41 (41.86~45.25), respectively These 8 products are classified into a PCD as minimal (2~4), very high (12~20), moderate (4~8), moderate (4~8), very high (12~20), very high (12~20), ultra high (> 20), and ultra high (> 20), respective-ly. Table 3 further gives the mean value and the standard deviation of each individual SPF. As described above, since the SPF value of the standard formulation suggested by the US FDA falls within the standard deviation range of the expected SPF (i.e., 4.47 ± 1.279) and the 95% CI for the mean SPF contains the value 4, the in vivo method has to be considered valid. This also demonstrates that the PCD classification of all products, except the product H-SPF10, is similar to that claimed by each product.
Furthermore, the sample mean of the SPF value measured in vivo for only three (H-SPF10, O-SPF15, and A-SPF45) out of seven products statistically differed from the labeled SPF values based on the null hypothesis of the sample mean being equivalent to the claimed SPF value. This reveals that in vivo test provides a more reliable and accurate claim of the SPF value than in vitro method.
The results in Table 3 also show that the mean SPF value of each product measured by the in vivo method was lower than the claimed SPF value of the corresponding product. The difference in skin phototype probably led to this bias. Subjects with skin phototypes I, II, and III are suggested for in vivo testing by the US, European countries and Japan, while subjects with skin types II, III, and IV were recruited in this study. MEDs for unprotected skin of types II, III, and III are expected to be larger than those for types I, II, and III. This might cause lower SPF values in calculations a larger denominator.
Although the SPF values estimated by the in vivo method were closer to the claimed values than those by the in vitromethod, variations in the mean SPF value by the former method (CV ranging from 3.9% to 25.0%) seemed to be larger than those by the latter method (CV ranging from 5.8% to 15.5%). Variations in the mean SPF values could be caused by: 1) Variations in the efficiency of UV due to the unsteady UV exposure during the in vivo test 2) Variations in MED readings due to bias in the judgment of MED by dermatologists. In order for the in vivo method to claim more reliable SPF value, training to minimize varia-tions in light exposure and consistent reading of MEDs by a single qualified dermatologist seem to be critical.
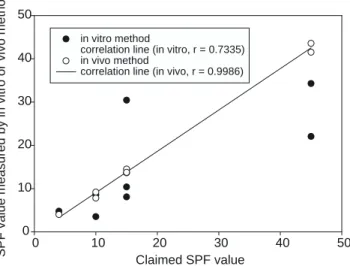
Correlation between the SPF value measured by the in vitromethod and the in vivo method is shown in Figure 1. The difference in sample means of these two values was found to be statistically insignificant for the FDA standard formulation, H-SPF10, and V-SPF45, whereas they were statistically significantly different for COLIPA, K-SPF10,
Figure 1.Plot of the correlation between the expected SPF and the SPF value measured either by the in vitro or in vivo method.
Claimed SPF value
0 10 20 30 40 50
SPF value measured by in vitro or vivo method
0 10 20 30 40 50 in vitro method
correlation line (in vitro, r = 0.7335) in vivo method
2. Food and Drug Administration. 1993. Sunscreen drug products for over-the-counter human use; tentative final monograph; proposed rule. Federal Register 58/90, 28194-302. U.S.A.
3. Deutsches Institut fur Normung. Experimentelle derma-tologische Bewertung des Erythemschutzes von externen Sonnenschutzmitteln fur die menschliche Haut. DIN 67501 (1984).
4. Ferguson, J. 1990. European Guidelines (COLIPA) for Evaluation of Sun Protection Factors. 25: 513-525. 5. Ferguson, J., Brown, M. and Alert, D. 1996.
Collaborative development of a sun protection factor test method: a proposed European standard Test Method. COLIPA Task Force ‘Sun Protection Measurement’, Europe. 18: 203-218.
6. (JCIA) Japan Cosmetic Industry Association. 1991. Standard SPF Test Method.
7. Food and Drug Administration. 1999. Sunscreen drug products for over-the counter human use: final monograph; rules and regulations, Federal Register. 64(98): 27666-27693.
8. Sayre, R. M. 1993. Correlation of in vivo tests, in vitro SPF predications, Cosmet. and Toilet. 108: 111-114. 9. Ferguson, J., Brown, M. W., Hubbard, A. W. and Shaw,
M. I. 1988. Determination of sun protection factors: correlation between in vivo human studies and in vitro skin cast method. Int. J. Cosmet. Sci. 10: 117-129. 10. Sayre, R. M., Agin, P. P., Levee, G. J. and Marlowe, E.
1979. A comparison of in vivo and in vitro testing of sunscreen formulas. Photochemistry and Photobiology. 29: 559-566.
11. Olsen, B. R. and Nimni, M. E. 1989. Collagen molecular biology. Cleveland CRC Press. Volume IV. 12. Diffy, B. L. and Robson, J. 1989. A new substrate to
measure sunscreen protection factor throughout the ultraviolet spectrum. J. Soc. Cosmet. Chem. 40: 127-133.
13. Greitar, F., Bilek, P., Doskoczil, S., Washuttl, J. and Wurst, F. 1995. Methods for water resistance testing of sun protection products. Int. J. Cosmet. Sci. 1: 147-157. O-SPF15, A-SPF15, and A-SPF45. This reveals that in
vitromethod could not claim the same SPF value as in vivo method. Our findings indicate that in vivo method is the only reliable way to test the SPF value for a test product. It cannot be replaced by the in vitro method examined in this study. In addition to the these two methods’ different mechanism of testing the SPF value, the absorption of the sunscreen ingredient by the skin may be a determinant factor for the SPF value for the in vivo method. Absorption is considered a more-complicated and more-influential process during in vivo testing, while no absorption occurs during in vitro testing. The correlation between these two methods, therefore, might exist simply by chance.
CONCLUSION
In conclusion, application of in vitro test method for estimation of the SPF value for sunscreen products is con-venient and consistent, and only requires a short period of time to complete the test procedure and confirm the efficacy. It is possible that deviations from the actual skin absorption mechanisms with in vitro testing led to greater discrepancy between the claimed value and the measured SPF value. On the other hand, in vivo method yield larger variations in the measurement of SPF values for sunscreen products on human subjects. Although this method is time-consuming, the test results are more reliable and closer to the claimed SPF value, as the test procedure more closely imitates the real situation of how sunscreen products are used. In the absence of a improving the in vitro method to more closely simulate actual conditions, the in vivo method on human subjects is irreplaceable for providing SPF values sunscreen products.
REFERENCES
1. Food and Drug Administration. 1978. Sunscreen drug products for over-the-counter human use; proposed safety, effective and labeling conditions. Federal Register 43/166, 38206-69. U.S.A.