國
立
交
通
大
學
應用化學系博士班
博士論文
利用單變數與多變數拉曼成像法研究活體
酵母菌之細胞週期動態學
In Vivo Univariate and Multivariate Raman Imaging
Study of the Dynamics of Yeast Cell Cycle
研 究 生:黃傳耿
指導教授:重藤真介 博士
利用單變數與多變數拉曼成像法研究活體
酵母菌之細胞週期動態學
In Vivo Univariate and Multivariate Raman Imaging
Study of the Dynamics of Yeast Cell Cycle
研究生:黃傳耿 Student: Chuan-Keng Huang
指導教授:重藤真介 博士 Advisor: Dr. Shinsuke Shigeto
國 立 交 通 大 學 應用化學系博士班
博 士 論 文
A Thesis
Submitted to Ph. D. Program, Department of Applied Chemistry College of Science
National Chiao Tung University in Partial Fulfillment of the Requirements
for the Degree of Doctor of philosophy in
Applied Chemistry July 2012
Hsinchu, Taiwan, Republic of China
i
利用單變數與多變數拉曼成像法研究活體
酵母菌之細胞週期動態學
學生: 黃傳耿 指導教授:重藤真介 博士
國立交通大學應用化學系博士班
中文摘要
在生物體的複製過程中,細胞分裂週期扮演著相當重要的角色,主要分
成
G2
、
M、G1
和
S四個階段。過去數十年,分子生物學已經建立了細胞分裂
週期的基本架構,但是對於細胞內的分子物質動態學,例如脂質與蛋白質
等,仍留存許多尚未明瞭的部份。對於探討活體生物分子的動態學研究,
拉曼成像法不需外加標靶物質的特性,已被證明具有相當優良的潛力。因
此在此研究中,我們將呈現利用實驗室自製的高靈敏度拉曼顯微光譜儀,
研究單一活體酵母菌細胞隨時間變化的拉曼影像。實驗中,細胞分裂期間
的各階段
(G2 → M → G1/S → G2) 分子組成與分佈的動態變化,已清楚地
被觀測到。我們利用單一變數與多變數的分析方法建構兩種不同的拉曼影
像。單變數分析法提供非常簡單且方便的方法建構拉曼影像,但對於具有
多樣性拉曼光譜的生物樣品來說,此方法所得的結果,很可能受到來自多
種分子造成的重疊光譜資訊所干擾。因此,我們試圖利用多變數曲線解析
ii
細胞週期實驗中,分子隨時間變化的分佈與組成可以透過六個變數的多變
數曲線解析法得到藉由三個主要組成(變數)的時間相關之拉曼影像與歸一
化的細胞內拉曼訊號的強度總和,我們觀測到脂質與蛋白質的濃度從
G2
至
M再至G1/S階段有逐漸增加的趨勢,並且在細胞分裂前達到最大值。並且研
究結果顯示,在細胞分裂之後,脂質的拉曼訊號總強度劇烈地下降至約略
一半。此外,我們利用多變數曲線解析法,發現了一種與蛋白質相關的組
成,這是在先前使用單一變數分析法所沒有觀察到的。
iii
In Vivo Univariate and Multivariate Raman Imaging
Study of the Dynamics of Yeast Cell Cycle
Student: Chuan-Keng Huang Advisor: Dr. Shinsuke Shigeto
Ph. D. Program, Department of Applied Chemistry
National Chiao Tung University
Abstract
The cell cycle, which typically includes G2, M, G1, and S phases, plays a pivotal role in
the reproduction of all living cells and organisms. Molecular biology of the cell cycle has been established over the decades, but intracellular dynamics of molecular species involved in the cell cycle, including proteins and lipids, remain largely unexplored. Label-free Raman imaging has proven itself powerful for studying such dynamic behaviors in vivo and at the molecular level. Here, we present time-lapse Raman imaging of a single live fission yeast cell achieved with a laboratory-built high-sensitivity Raman microspectrometer. We visualize dynamic changes in molecular composition and distribution during the yeast cell cycle (G2 →
M → G1/S → G2). We construct Raman images by two approaches, namely, univariate and
multivariate data analyses. Univariate data analysis is a simple and convenient approach to obtain Raman images. However, it may suffer from overlapped spectral information, especially for biological samples. To overcome this difficulty, we also attempt multivariate curve resolution (MCR). Time-dependent variations in distributions and compositions during the cell cycle are well accounted for by assuming six components in the MCR analysis. Time-lapse Raman images and normalized integrated intensities for the three major components derived from MCR show that the concentrations of lipids and proteins increase from G2 to M and G1/S phases and reach their maxima right before cytoplasmic division takes
place. Moreover, the results show a drastic decrease in amount of lipids by ~50 % after cell division. Interestingly, the MCR analysis uncovers a protein-associated component that has not been detected with the univariate approach.
iv
Acknowledgments
六年的研究生生涯終於告一段落了,過程中,相當感謝許多老師、同學、
學長姐、學弟妹和朋友們的幫忙與照顧,使得許多大小事最後都可以迎刃
而解。特別地,我最要感謝的是
Prof. Hamaguchi,由於他的鼓勵和建議,讓
我可以確立研究的方向,進而完成博士學業。再者,也非常感謝我的指導
教授
Prof. Shigeto在過去四年來,不管是專業學術知識,亦或是語言上的指
導,皆幫助我能更加順利的拿到博士學位。此外,我也要感謝江素玉老師
在我研究生涯上的啟蒙,讓我具備了許多基礎知識與研究能力。另外,我
也由衷地感謝我的父母,由於他們的支持和賦予我的環境,能讓一個小孩
年近三十仍能無後顧之憂的在外求學,相信,這也是我幸運的地方吧。最
後,我要感謝儒瑩六年來的諒解,在我繁忙時,時常犧牲自己的假日,只
為了陪我在實驗室打拼,謝謝妳。
v
Tables of Contents
中文摘要 ... i Abstract ... iii Acknowledgments ... iv Tables of Contents ... vList of Figures and Table ... viii
Chapter I Introduction ... 1
Chapter II Experimental ... 5
II-1. Sample preparation ... 6
II-2. Confocal Raman microspectrometer and imaging apparatus ... 6
II-3. Evaluation of spatial resolution ... 7
II-4. Sample chamber ... 8
Chapter III Data Analysis ... 13
III-1. Introduction of univariate and multivariate data analyses ... 14
III-2. Singular value decomposition analysis ... 15
III-3. Univariate data analysis ... 16
III-4. Multivariate data analysis ... 16
Chapter IV Results and Discussion ... 24
IV-1. Cell cycle of fission yeast cells under the microscope ... 25
IV-2.Univariate Raman images ... 26
IV-2-1.Group of lipids ... 26
IV-2-2.Group of proteins ... 27
IV-2-3. Group of admixtures of lipids, proteins, and other molecular species ... 27
IV-2-4. Others ... 28
vi
IV-4. Distribution changes of lipids and proteins during the cell cycle ... 29
IV-5. Multivariate Raman images ... 30
IV-5-1. Component 1 ... 31
IV-5-2.Component 2 ... 31
IV-5-3. Component 3 ... 31
IV-5-4. Components 4 and 5 ... 32
IV-5-5. Component 6 ... 34
IV-6. Time dependence of lipid and protein concentrations in multivariate analysis ... 34
IV-6-1. Lipids (component 3) ... 35
IV-6-2. Major Proteins (component 4) ... 35
IV-6-3. Protein-associated component (component 5) ... 36
IV-7. Comparison between the Univariate and Multivariate Approaches ... 37
Chapter V Summary and Future Perspectives ... 45
References ... 48
Appendix I The effects of CoQ10 on the 1602 cm-1 band. ... 55
Appendix I-1. Introduction and motivation ... 56
Appendix I-2. Experimental methods ... 59
Appendix I-2-1. Commercial microscopic incubator ... 59
Appendix I-2-2. Water solubilized CoQ10 ... 59
Appendix I-2-3. Sample preparations ... 59
Appendix I-2-4. Experimental conditions ... 60
Appendix I-3. Results and discussion. ... 63
Appendix I-3-1. Growth curves ... 63
Appendix I-3-2. Time-dependent Raman spectra of ∆dps yeast cells in PMLU and PMLU-CoQ10 media with 2.6 mW laser power ... 63
vii
medium with 1 mW laser power ... 64 Appendix I-3-4. Time-dependent Raman spectra of ∆ppt1 yeast cells in PMLU and PMLU-CoQ10 media with 1mW laser power ... 65
Appendix I-4. Summary and future perspectives ... 71 References ... 72
viii
List of Figures and Table
Figure II-1. A single colony on the YES plate after 3-5 day cultivation at 30 o C. ... 10
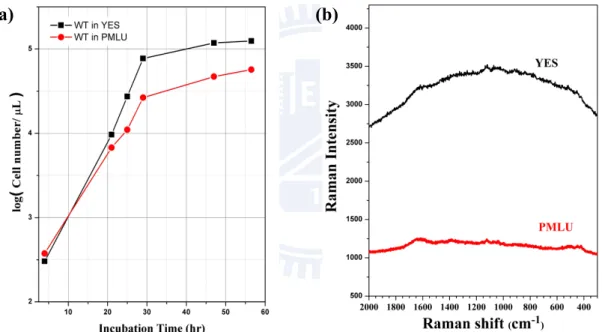
Figure II-2. (a) Growth curves of fission yeast cells in YES and PMLU media at 30 o C.
(b) Raman spectra of pure YES and PMLU media taken with a 60-s exposure time. ... 10
Figure II-3. Schematic of the laboratory-built confocal Raman microspectrometer used
in this work. ... 11
Figure II-4. Evaluation of lateral (a) and axial (b) resolution of the laboratory-built
confocal Raman microspectrometer. ... 11
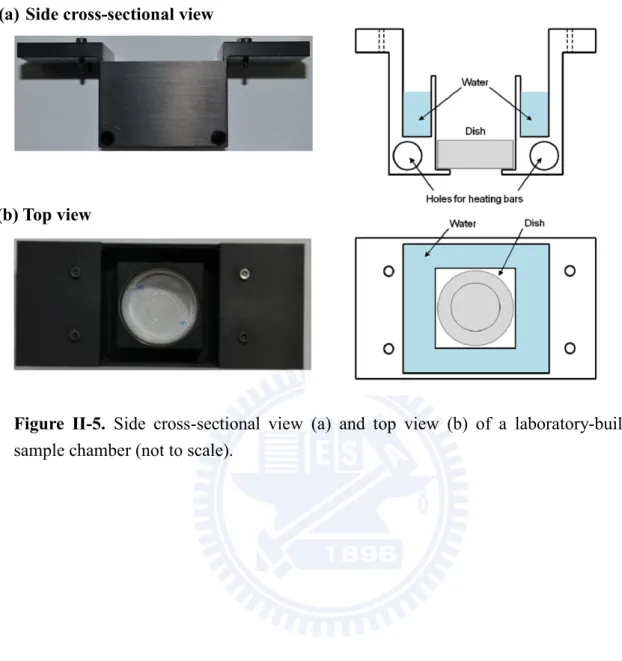
Figure II-5. Side cross-sectional view (a) and top view (b) of a laboratory-built sample
chamber ... 12
Figure III-1. Typical lipid-rich Raman spectrum of fission yeast cells with 633 nm
excitation. ... 20
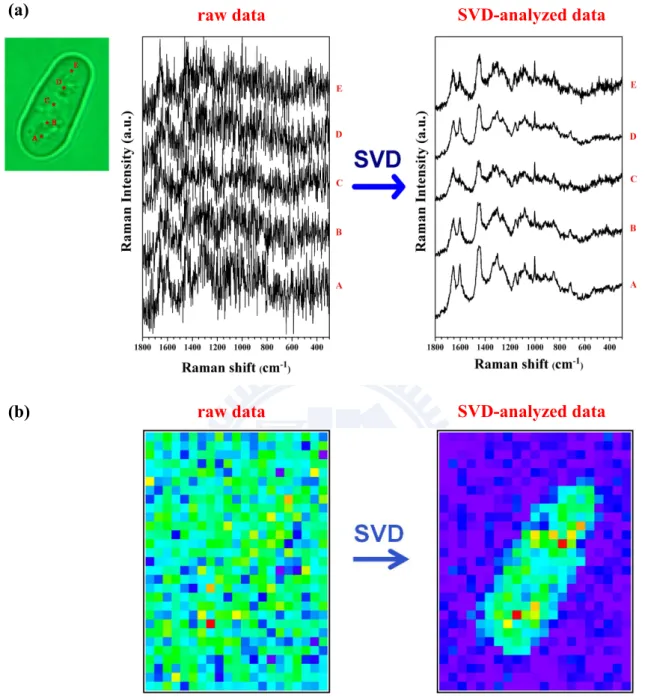
Figure III-2. (a) Typical space-resolved Raman spectra of a single living S. pombe cell
acquired with an exposure time of 1.5 s and laser power of 1 mW. ... 21
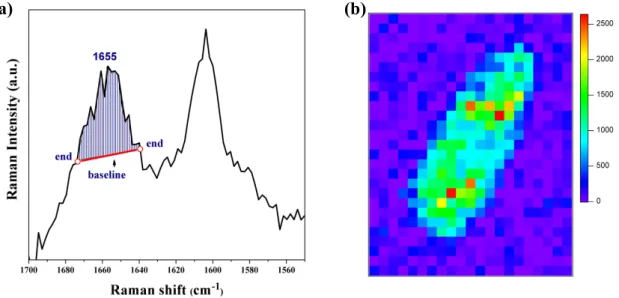
Figure III-3. (a) Baseline connecting two ends for the Raman band at 1655 cm-1. ... 22
Figure III-4. Diagrammatic representation of the unfolding of overall four-dimensional
spectral data into a two-way array that facilitates multivariate data analysis. ... 22
Figure III-5. (a) 2D plot of the normalized residual matrix 𝑹 ... 23 Figure IV-1. Schematic illustration of the S. pombe cell cycle. The oval bodies along the
circle represent the morphology of cells in different phases. ... 39
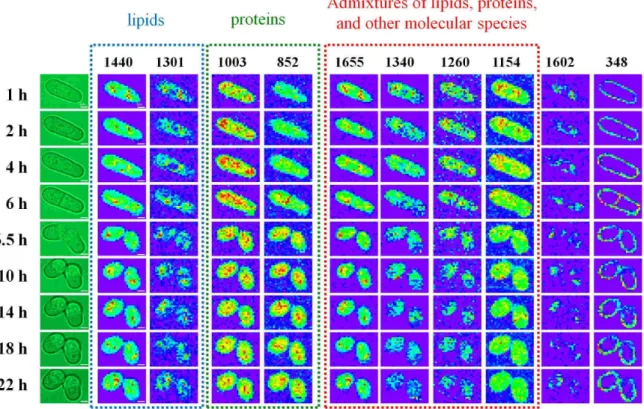
Figure IV-2. Time-lapse univariate Raman images of a single dividing S. pombe cell at
the Raman shift of 1655, 1602, 1440, 1340, 1301, 1260, 1154, 1003, 852, and 348 cm-1 ... 39
ix
Figure IV-4. Time dependence of the Raman intensities at 1440 (a), 1301 (b), 1003 (c),
and 852 (d) cm-1, integrated over the whole cell. ... 40
Figure IV-5. Distribution and intensity changes of the 1301 cm-1 (a) and the 1003 cm-1
(b) Raman band during the cell cycle. In the right panel (a and b), normalized Raman intensity along the cross-section shown in the left panel is plotted against lateral position. ... 41
Figure IV-6. Time-lapse multivariate Raman imaging of the single dividing S. pombe
cell. (a) Raman images of six components derived from the MCR, together with the optical images (leftmost column). Scale bar = 2 µm. (b) Normalized Raman spectra of background, lipids, major-proteins, protein-associated, and unknown components. The spectra are displaced vertically for clarity with the zero line of each spectrum indicated by a dotted line. ... 41
Figure IV-7. Component spectra of protein-associated (a) and major proteins (b). The
sum of spectra a and b (c) coincides well with the typical protein-rich Raman spectrum (d) of yeast cells. ... 42
Figure IV-8. Overlaid Raman images of major proteins and protein-associated
components. ... 42
Figure IV-9. Time dependence of the Raman intensities integrated over the whole cell in
MCR for lipids (a), major proteins (b), and protein-associated components (c). . 43
Figure IV-10. Time-lapse raw Raman spectra of the S. pombe cell. ... 43 Figure IV-11. Comparison between the time-lapse univariate and multivariate Raman
images ... 44
Figure A-1. Blocking process of the peroxidation of ergosterol. CoQ10 as an antioxidant
can react with reactive oxygen (1O
2), leading to the accumulation of ergosterol
in yeast cells. ... 58
x
comes in from the right-hand side of the incubator. (b) The controller of the heaters for the microscopic incubator. ... 61
Figure A-3. Schematic illustration of a complex of CoQ10 and γ-CD. The complex
formation can increase the water solubility of CoQ10. ... 61
Figure A-4. A laboratory-built device for drying the solution including the CoQ10
complex. To avoid the thermal decomposition of the CoQ10 complex, we put
the mixture solution in water bath about 32-35 oC. ... 62
Figure A-5. The growth curves of wild-type (WT), ∆dps, and ∆ppt1 yeast cells in YES
and PMLU media. ... 67
Figure A-6. (a) Optical image of a selected ∆dps yeast cell. The arrow indicates a lipid
particle in the cell. (b,c) Time-dependent Raman spectra (upper panels) and difference spectra (lower panels) for ∆dps yeast cells in PMLU-CoQ10 (b) and
PMLU (c) media with 2.6 mW laser power. ... 67
Figure A-7. The photobleaching behavior of the 1602 cm-1 band. The target cell was
continuously illuminated with 2.6 mW laser at a position where a lipid particle was found. Each spectrum was recorded with a 10 s exposure time. Rapid photobleaching of the 1602 cm-1 band was observed within 90 s. ... 68
Figure A-8. Time-dependent Raman spectra (upper panels) and difference spectra (lower
panels) of points a (a) and b (b) in the ∆dps yeast cells in PMLU medium with 1 mW laser power. The laser beam spots a and b are denoted with asterisks. ... 68
Figure A-9. Normalized temporal changes of the peak area of Raman bands at 1602,
1655, 1440, 1301, and 1083 cm-1 (a) and the corresponding unnomalized data
for the 1003 cm-1 band (b). ... 69
Figure A-10. Time-dependent Raman spectra (upper panels) and difference spectra
(lower panels) for ∆ppt1 yeast cells in PMLU (a) and PMLU-CoQ10 (b) media
xi
Figure A-11. Comparison of the difference Raman spectra for ∆ppt1 yeast cells cultured
in pure PMLU (23 h – 1 h) and PMLU-CoQ10 media (21 h – 1 h). ... 70
1
Chapter I
2
The cell cycle is a series of complicated processes occurring in living cells. These processes include exceedingly dynamic molecular changes in both composition and distribution before, during, and after cell division. In cell division, the final phase of the cell cycle, vital cellular components including nucleic acids, proteins, membranes and organelles are duplicated accurately and inherited equally by the two daughter cells [1]. Various biochemical and bioanalytical approaches have been used to investigate the molecular mechanism of the cell cycle over decades [2-5]. Especially, the cell cycle of fission yeast and budding yeast cells has been commonly studied because those yeasts are widely utilized as a model system for higher organisms [6, 7]. Almost all the organelles contained in higher animal and plant cells can also be found in the yeast cells. However, what these methods can obtain is essentially time- and space-averaged information based on results of many cells. In fact, quantitative understanding of the dynamic behavior of molecular composition and distribution in single cells still remains one of the challenging goals in biological sciences. In the present study, we have overcome this challenge by using in vivo Raman imaging coupled with univariate and multivariate data analysis techniques.
This thesis is composed of Chapters II–V and Appendix I. In Chapter II, we describe the experimental approach used in this work, Raman imaging, with focus placed on how to achieve spatial resolution high enough for single-cell analysis. We built a high-sensitive confocal Raman microspectrometer that enables us to measure living Schizosaccharomyces
pombe cells with lateral and axial resolutions of 0.3 and 2.5 µm, respectively. The high
collection efficiency of Raman signals makes it possible to acquire one image with 609 pixels in less than 20 minutes. With this time resolution, we can resolve each phase of the cell cycle because the period of the cell cycle of fission yeast cells is typically about 3h. The following two advantages render Raman spectroscopy a powerful tool for investigating a wide variety of biochemical systems. First, unlike mass spectrometry [8, 9], noninvasive and nondestructive characteristics of Raman spectroscopy allow for continuously monitoring the dynamics of one
3
particular yeast cell during the cell cycle. Second, unlike fluorescence spectroscopy, there is no need to introduce probe molecules to the target cell. Thus, it is possible to explore unknown cellular components for which workable probes have not been developed. Moreover, many reports describe that introducing probe molecules to a living cell may give rise to unhealthy behaviors and may eventually alter its physiological conditions [10]. In contrast, Raman microscopy is label-free and thus expected to be much less perturbative to living cells than fluorescence microscopy.
Chapter III deals with univariate and multivariate data analyses that we used to construct Raman images out of a bunch of spaced-resolved Raman spectra. The limitation of univariate analysis, which arises from the contaminations due to severely overlapped spectral information in cellular Raman spectra, is described in Chapter III-1. We employed multivariate data analysis to overcome this problem. Also shown in Chapter III-2 is the denoising that we performed prior to the construction of univariate/multivariate Raman images, based on singular value decomposition analysis.
In Chapter IV, we first present our results of multimode time-lapse Raman imaging of a single dividing fission yeast cell, in which univariate Raman images for 10 vibrational modes were obtained simultaneously at different cell-cycle stages of an S. pombe cell. According to the assignments, we have grouped the 10 Raman images into 4 groups: lipids, proteins, polysaccharides, and others (Chapter IV-2). The time-lapse changes in integrated intensities of the Raman bands at 1440, 1301, 1003, and 852 cm-1, which represent dynamic changes in
molecular composition and distribution during yeast cell cycle, are discussed in Chapter IV-3. The integrated intensities reached their maxima right before cell division and subsequently dropped drastically by ~50%. Despite the simplicity of this univariate approach, we suffer from overestimation of Raman intensity primarily due to severely overlapped spectral information.
4
capable of extracting maximum chemical information from complicated Raman spectra without a priori knowledge about spectral characteristics. The second part of Chapter IV describes our attempt of Raman imaging using multivariate curve resolution (MCR). The MCR analysis of the data yielded five major components, which are attributed to the background, polysaccharides, lipids, proteins, and protein-associated component (Chapter IV-5). The time evolution of molecular compositions and distributions of lipids and major proteins derived by the MCR resembles, respectively, that of the lipid (1440 and 1301 cm-1)
and protein (1003 and 852 cm-1) groups that we obtained with the univariate data analysis.
Surprisingly, a protein-associated component, which we have never detected with the univariate data analysis, was resolved by the MCR. According to the time-lapse molecular changes in concentration and distribution of the protein-associated component, we conclude that it reflects phosphorylation of proteins (Chapter IV-6-3). A summary is given in Chapter V.
In addition to the main project presented in Chapter IV, we have also studied the effects of coenzyme Q10 on the 1602 cm-1 band as a subproject, which are described in Appendix I.
5
Chapter II
6
II-1. Sample preparation
Schizosaccharomyces pombe, a haploid fission yeast, was pre-cultured on a YES plate
containing yeast extract (5 g L-1), glucose (30 g L-1), agar (17 g L-1), and amino acids
including adenine, histidine, leucine, uracil, and lysine (50 mg L-1 each). After 3-5 day
cultivation, a large number of colonies of the yeast cells spread on the YES plate (Figure II-1). In the present work, a single colony of yeast was transferred into PM minimal medium with leucine and uracil [11] (75 mg L-1 each) and was immobilized on a poly-D-lysine coated glass
bottom dish (MatTek, P35GC-1.5-10-C). Although this Pombe Mineral Leucine Uracil (PMLU) medium, which is a minimum nutrition medium, was provided as the initial culture medium, the yeast cells in PMLU medium exhibited as well bio-activity as those in YES medium (Figure II-2a). Besides, Figure II-2b shows that PMLU medium gives background intensity in the Raman spectrum one-third that of YES, indicating that the use of PMLU instead of nutrition-rich medium like YES can improve the quality of Raman spectra.
II-2. Confocal Raman microspectrometer and imaging apparatus
Figure II-3 is a schematic illustration of the laboratory-built confocal Raman microspectrometer used in this work [12-14]. The 632.8-nm output of a He-Ne laser (Thorlabs; HRR170) with a 0.98 mm beam diameter was used as the Raman excitation source. In order to reduce the spot size at the focal point, the laser beam was magnified by a factor of ~2.7 to effectively cover the exit pupil of the objective. The expanded beam was introduced to an inverted microscope (Nikon) by a pair of an edge filter (Semrock; LP02-633RU-25) and a hot mirror (Thorlabs; FM02). The microscope was custom-made in collaboration with Nikon engineers by modifying a TE2000-U microscope. The beam was focused onto the sample by an oil-immersion objective (CFI Plan Fluor; 100×, NA = 1.3) placed on the microscope stage, and backward scattered light was collected by the same objective. The backward scattered
7
light was guided along the opposite direction to the incoming path. Rayleigh and anti-stokes Raman scattered light was rejected at the edge filter and only stokes Raman scattered light was transmitted. The Raman scattered light was then focused onto a 100-μm pinhole by a 150-mm lens and collimated by another 150-mm lens. With this confocal configuration, a spatial resolution of about 0.3 µm in lateral direction and 2.7 µm in axial direction were achieved. The Raman scattered light was dispersed by an imaging spectrometer (HORIBA Scientific; iHR320) and detected by a back-illuminated, deep-depletion, liquid-nitrogen cooled CCD detector (Princeton Instruments; Spec-10:100B) with 100 × 1340 pixels operating at −120 oC. A 600 grooves/mm grating was used. The resulting spectral resolution
was 7 cm−1, which was high enough in this work because the Raman spectra of biological
samples usually exhibit broad Raman bands. In addition, this grating can cover a wide spectral range over the fingerprint region (>2000 cm−1). For bright-field observation, the
sample was illuminated by a halogen lamp (or mercury lamp) and optical micrographs were acquired by a digital camera (Nikon; DS-Ri1) mounted on the microscope.
For imaging experiments, the laboratory-built confocal Raman microspectrometer was also equipped with a high-precision piezoelectric nanopositioning stage (PI; P-563.3CD). A LabVIEW (National Instruments) program was run to automatically control the piezoelectric stage such that Raman imaging experiments were performed by translating the sample both horizontally and vertically. In the present work, the sample was translated with a 0.5-μm step in both X and Y directions. Because these steps were greater than the estimated lateral resolution (0.36 μm), they determined the effective spatial resolution here.
II-3. Evaluation of spatial resolution
How did we estimate the lateral and axial resolution? In the estimation of the lateral resolution, the laser spot was scanned horizontally through a sharp edge of a silicon wafer and the intensity of the 520 cm-1 band of silicon was used to examine the intensity profile along
8
the edge. Similarly, in the estimation of the axial resolution, we acquired the intensity rise of the 1019 cm-1 band of indene at an indene-glass interface. The Raman intensity versus the
scanned distance is showed in Figures II-4a for the 520 cm-1 band of silicon (lateral
resolution) and II-4b for the 1019 cm-1 band of indene (axial resolution). Here we assume that
the edge and the interface were ideally sharp. Therefore, they can be described by a step function. We also assume that the profile of the laser beam can be expressed by a Gaussian function. As a result, the Raman intensity change at the edge or interface can be fitted by a convoluted of a Heaviside step function H(x) and a Gaussian function g(x) (Equation II-1) as follows [15]: 𝑓(𝑥, 𝑁, 𝑐, σ) = 𝑁 � 𝐻(𝑎′)𝑔(𝑎′− 𝑎)𝑑𝑎′=𝑁 2 �1 + 𝑒𝑟𝑓 � 𝑥 − 𝑎 √2𝜎�� + 𝑐 (II − 1) ∞ −∞
where N is a normalization constant, a is the rise of the step function, σ is the width of the Gaussian function, c is a constant, and erf denotes the error function. The full width at half maximum (FWHM) is equal to 2√2 ln 2 σ. Thus, the fitted results show that the spatial resolution is 0.36 ± 0.04 µm in the lateral direction and 2.52 ± 0.09 µm in the axial direction. The error bars here represent fitting precision.
II-4. Sample chamber
To trace the cell cycle of fission yeast cells under a microscope, the surrounding temperature and humidity in the sample dish must be kept appropriately. Otherwise, the yeast cells would not divide well. We designed a sample chamber (Figure II-5) that enabled us to keep high humidity and constant temperature for yeast cells. The body of the chamber was made of aluminum. The inside of the chamber was partitioned into inner and outer spaces by a square wall (41 × 41 mm). The water-filled moat surrounded the sample dish and prevented the medium from drying. Two heating bars were inserted into the two holes made at the bottom of the chamber so that the temperature of the chamber was controlled by a PID
9
controller (Vertex, VT7226). The temperature was controlled to be 30 ± 0.5 oC at the sample
and its surrounding, providing the best growing environments for fission yeast. The chamber was covered by an acrylic plate to make the chamber nearly a closed-system. Tubing for continuous air flow and a thermocouple were introduced through two holes on the cover.
10
Figure II-2. (a) Growth curves of fission yeast cells in YES and PMLU media at 30 o C.
(b) Raman spectra of pure YES and PMLU media taken with a 60-s exposure time.
(a) (b)
Figure II-1. A single colony on the YES plate after 3-5 day cultivation at 30 o C.
11
Figure II-4. Evaluation of lateral (a) and axial (b) resolution of the laboratory-built
confocal Raman microspectrometer. Black dot, observed Raman intensity; red line, best fit to the model function (Equation II-1).
(a) (b)
Figure II-3. Schematic of the laboratory-built confocal Raman microspectrometer
used in this work. The apparatus consists of a He-Ne laser for Raman excitation, inverted microscope, imaging spectrometer and charge-coupled device (CCD) detector. To scan the sample and acquire Raman images, we combined a piezoelectric stage with the microscope stage.
12
Figure II-5. Side cross-sectional view (a) and top view (b) of a laboratory-built
sample chamber (not to scale).
(a) Side cross-sectional view
13
Chapter III
14
III-1. Introduction of univariate and multivariate data analyses
The conventionally employed approach to construct Raman images is based on two dimensionally plotting the area intensity of a Raman band of interest assigned to a specific molecular species. Because this analysis depend on a single variable (i.e., wavenumber), it can be called univariate Raman imaging. The advantages of univariate Raman imaging are easy-to-perform, time-saving, and Raman-band specific. However, Raman spectra of biological samples intrinsically contain very complex and overlapped Raman bands within a spectral region of interest. This fact leads to difficulties in getting a Raman image of a single molecular species without contaminations of other species even when the Raman band looks isolated. As an example, we would like to show how complicated the Raman spectrum of fission yeast is. Figure III-1 is the typical lipid-rich Raman spectrum of a fission yeast cell. Detailed assignments of the major Raman bands observed in this spectrum are shown in Table III-1. Obviously, the Raman band at 1655 cm-1 is attributed to both the cis-C=C stretch of
lipids and the amide I of proteins. Similarly, the Raman band at 1440 cm-1 comes from the CH
bending of the aliphatic chain of both lipids and proteins. There might still be several different Raman bands underlying the 1655 and 1440 cm-1 regions and what is worse, many weak
Raman bands of lipids, proteins, and other species severely overlap with each other in the 1000-1400 cm-1 region. Thus, the overestimation of band area may arise due to heavily
overlapped spectral information. In fact, only few bands can be assigned unequivocally according to our experience and previous reports [12, 16-19].
To overcome this problem inevitably encountered in analyzing cellular Raman spectra, multivariate data analysis, such as principal component analysis [20-26] (PCA), cluster analysis [21, 22, 26-29] and multivariate curve resolution [20, 22, 25, 30, 31] (MCR, also known as non-negative matrix factorization [32]), has recently been applied to Raman image data. Multivariate data analysis is capable of extracting maximum chemical information from
15
complicated Raman spectra without a priori knowledge about spectral characteristics and analyzes global data set instead of mapping the intensity of an individual band. As a result, we obtain the intrinsic spectrum and concentration distribution of each component. In the present work, we use MCR to analyze our time-lapse Raman spectra of a single living fission yeast cell during its cell cycle.
In what follows, we describe the procedures of univariate and multivariate data analyses in detail.
III-2. Singular value decomposition analysis
In order to provide a better growing environment to yeast cells during cell cycle, it is important to irradiate the sample with sufficiently low laser power and short exposure time. However, Raman spectra acquired under such experimental conditions (laser power of 1 mW and exposure time of 1.5 s) show poor signal-to-noise ratio (S/N). To practically resolve this dilemma, we performed singular value decomposition (SVD) as a pretreatment for subsequent data analysis. This technique has been successfully used in numerous studies [12, 14, 19, 33-36] to reduce noises in Raman spectra and hence improve the S/N. SVD is a mathematical technique that factorizes an arbitrary 𝑚 × 𝑛 matrix 𝑨 into the product of three matrices as 𝑨 = 𝑼𝑾𝑽𝑇. Here 𝑼 is an 𝑚 × 𝑛 column-orthonormal matrix, 𝑾 an 𝑛 × 𝑛 diagonal
matrix of positive singular values, and 𝑽 an 𝑛 × 𝑛 orthonormal matrix. 𝑼 and 𝑽 represent the spectral and positional matrices, respectively. Only components of 𝑼 and 𝑽 having significantly large singular values were retained to reproduce matrix 𝑨, because other components with much smaller singular values contributed to the original data negligibly and can be regarded as noises. The matrix 𝑨 was then reconstructed by using the components of 𝑼 and 𝑽 associated with large singular values. The number of singular values retained in this reconstruction was typically less than 10. The main criterion for determining how many components were taken into account was whether or not the spectral component of 𝑼
16
corresponding to a particular singular value showed definite Raman features. The SVD was computed in Igor Pro (WaveMetrics) using LAPACK routines. Figure III-2a illustrates how well SVD denoising worked. Space-resolved Raman spectra taken at five different locations in a fission yeast cell are compared before and after the SVD. It is clear that the SVD did good job of dramatically reducing noises. As compared in Figure III-3b, the Raman image constructed for the 1655 cm-1 band from the raw data (without SVD) is featureless due to
noisy spectra, but the image constructed from the SVD-analyzed data shows clear contrast.
III-3. Univariate data analysis
The univariate data analysis simply uses the area intensity calculated under the band contour of a Raman band of interest. The area intensity between the band contour and a baseline connecting the two ends of an interval chosen to include the whole band was calculated (Figure III-3). Here, the selected region was chosen as narrow as possible (< 10 cm-1) to avoid spectral overlap of unexpected molecular species. Curve fitting was not used
for this purpose due to the low S/N with extremely low power and short exposure time in our experiment. The integrated Raman intensities so obtained at every position (XY on the mapping region) were combined to construct a two-dimensional map of the Raman intensity distribution, namely, univariate Raman image of the band.
III-4. Multivariate data analysis
For the multivariate analysis, we performed multivariate curve resolution (MCR) to analyze a four-dimensional data matrix (XY on the image plane (spatial), spectral and temporal dimensions; see Figure III-4) by the software (nmf-11, Pylone) which was developed at Tokyo specifically for spectral imaging applications. To be able to deal with four-dimensional data, we unfolded the four-dimensional data matrix into a two-dimensional
17
array. One dimension should correspond to the spectral dimension (pixel or wavenumber); thus the non-negative matrix factorization constrains each resolution as an individual component [37]. The other dimensions were merged to be a single dimension. In MCR, given an 𝑚 × 𝑛 non-negative data matrix A, a low-rank approximation of the matrix A is sought for by solving the problem [37, 38]:
𝑨 ≈ 𝑾𝑯 (III − 1) with non-negativity constrains 𝑾 ≥ 𝟎 and 𝑯 ≥ 𝟎. In the present work, 𝑾 is an 𝑚 × 𝑘 matrix whose columns correspond to spectra and 𝑯 is a 𝑘 × 𝑛 matrix whose rows represent spatiotemporal concentration profiles. By reorganizing the 𝑯 matrix, multivariate Raman images can be obtained. The parameter 𝑘, which specifies the number of components that consist of the data, should be given by the user in advance. The most suitable value of 𝑘 was found to be k = 6 in the present case. The optimal solutions of 𝑾 and 𝑯 are obtained by solving alternating least-squares (ALS) problems of equation III-1 so that the Frobenius norm ‖𝑨 − 𝑾𝑯‖F2 is minimized.
Here, we briefly describe the MCR procedure adopted in this work, which consisted of the following steps:
(1). The MCR software requires a two-dimensional matrix as input. Thus, we need to rearrange a four-dimensional matrix which was constructed by the data cube at each measurement time (Figure III-4) into a two-dimensional matrix. Because spectral information is one of our primary concerns, the wavenumber dimension was treated as a single variable. By doing so, we generated the data matrix 𝑨.
(2). SVD-based initialization [39] was utilized to generate initial guesses for 𝑾 and 𝑯 in this case. Although random initialization is also available in our software, it often results in falling into a local minimum [39]. The number of components was set to be 𝑘 = 6, which yielded the best resolution of polysaccharide, lipid, and protein components.
18
optimization of 𝑾 and 𝑯. An L1 penalty term of α2 = 0.0095 was added to obtain sparser
solutions as
(𝑾T𝑾 + α2𝑬)𝑯 = 𝑾T𝑨 (III − 2)
and
(𝑯𝑯T+ α2𝑬)𝑯 = 𝑯𝑨T (III − 3)
where 𝑬 is a 𝑘 × 𝑘 matrix all of whose elements are unity.
(4). Repeat step (3) until ‖𝑨 − 𝑾𝑯‖F2 converges. The number of iteration was to be 4000,
ensuring that ‖𝑨 − 𝑾𝑯‖F2 converged to a sufficiently small number.
Last, we discuss how well the matrices 𝑾 and 𝑯 reproduce the matrix 𝑨. For the unfolded data matrix 𝑨 (a 790 × 6885 matrix), we calculated the normalized residual matrix 𝑹 (Figure III-5a) using the following equation:
𝑅𝑖𝑗 = �𝐴𝑖𝑗−(𝑾𝑯)𝐴 𝑖𝑗�
𝑖𝑗 (III − 4)
where 𝑅𝑖𝑗 represent the normalized residue at row i and column j. Besides horizontal stripes
indicating the locations of intense Raman bands, the 2D plot shows no particular distribution pattern and residues seem to be randomly distributed. Figure III-5b shows a histogram of all fitting residues, which are less than 10%. This result indicates that the original data is well reproduced by the present MCR analysis. We also compare a reproduced spectrum with the corresponding original spectrum (SVD-treated) at a randomly selected position (Figure III-5c). The two spectra are almost identical with less than 5% residues.
19
Table III-1. Band assignments for Raman spectra of single living S. pombe cells.
Wavenumber (cm-1) Assignment
1655 cis-C=C stretching of the unsaturated lipid chains
Amide I mode of proteins
1602 Not yet assigned. "Raman spectroscopic signature of life"
1440 CH2 scissoring and CH3 degenerate deformation
1340 CH bending of the aliphatic chain of proteins
1301 In-phase CH2 twisting mode
1260 C=C-H in-plane bend of the cis- –CH=CH– linkage
Amide III mode of proteins 1154
1083 1003
C− C and C− N stretching Antisymmetric CCC stretching
Ring breathing of the phenylalanine residues 852
783
“Tyrosine doublet” (Fermi resonance of a ring-breathing vibration and the overtone of an out-of-plane ring-bending vibration of the tyrosine residues)
20
Figure III-1. Typical lipid-rich Raman spectrum of fission yeast cells with 633 nm
excitation. Some Raman bands, e.g. at 1655, 1440, 1260, and 1154 cm-1, show a complicated feature composed of lipids/proteins and other molecular species.
21
(a)
Figure III-2. (a) Typical space-resolved Raman spectra of a single living S. pombe
cell acquired with an exposure time of 1.5 s and laser power of 1 mW. A–E denote the positions in the cell at which the Raman spectra were recorded. The SVD-treated spectra (right) exhibit much higher S/N than the raw data (left). (b) Raman images for the 1655 cm−1 band constructed from the raw (left) and SVD-analyzed (right) data, respectively. It is clear that SVD analysis makes it possible to construct high-contrast Raman images even with low excitation power and short exposure time.
raw data SVD-analyzed data
raw data
22
(a) (b)
Figure III-3. (a) Baseline connecting two ends for the Raman band at 1655 cm-1.
The blue-shaded area is used as the Raman intensity of this band at a given pixel in the univariate Raman image. (b) Univariate Raman image of the 1655 cm-1 band. A rainbow color scale displays the highest Raman intensity with red and the lowest with purple.
Figure III-4. Diagrammatic representation of the unfolding of overall
four-dimensional spectral data into a two-way array that facilitates multivariate data analysis. X and Y denote positions in the image plane, and denotes the spectral dimension. The three dimensions (two spatial and one temporal dimensions) are combined to be a single dimension.
23
(a)
(b) (c)
Figure III-5. (a) 2D plot of the normalized residual matrix 𝑹 (see equation III-4).
(b) Histogram of all fitting residues calculated at all pixels. (c) Comparison of a typical SVD-treated Raman spectrum (blue curve) and the corresponding MCR fitted spectrum (red curve). Also shown is their difference spectrum.
24
Chapter IV
25
IV-1. Cell cycle of fission yeast cells under the microscope
Figure IV-1 schematically shows the cell cycle of S. pombe. The optical images showing the morphology of the S. pombe cell in each phase during the cycle are those captured in our Raman imaging experiment (see below). The S. pombe cell cycle consists of four different phases called the M (mitosis) phase, G1 (gap-1) phase, S (synthesis) phase, and G2 (gap-2)
phase. It is known that S. pombe has a very short G1 phase under normal vegetative conditions.
This fact makes the G1 phase of S. pombe unclear. Thus, we use the notation G1/S for the two
indistinguishable phases. In the present work, we randomly chose a single yeast cell that stayed in G2 phase and started an in vivo long-term measurement with the Raman
microspectrometer equipped with the laboratory-built chamber (see Chapter II). The time zero is defined as the instance when we put a single colony of S. pombe into PMLU medium. At 1 h, we start to measure a randomly chosen single yeast cell in the sample dish. Once an imaging measurement is done, laser illumination is blocked until a next measurement. We are sure that the cell initially stayed in the G2 phase, because we observe elongation of the cell
along the cell polarity axis by a factor of ∼1.2 on going from 1 to 4h, which is a common biological behavior in G2 phase. The cell cycle progresses from G2 to M phases and the cell
prepares for a coming cell division in the first four hours (1-4 h). At 6 h, a septum is already formed to segregate the cell into two compartments, indicating that the cell is in the G1/S
phase. By 6.5 h, the cell divides completely and splits into two daughter cells. Subsequently, two daughter cells should enter a new cell cycle (G2 phase again). To clearly present the
stages in the cell cycle, we also performed experiments using nucleus-labeled fission yeast cells with GFP, but they were not successful. A possible reason for the failure might be that the nucleus-labeled fission yeast cells seem to be more photolabile than unlabeled cells and be strongly affected by laser illumination during the cell cycle.
26
think that the selected fission yeast cell enter a new cell cycle after the mother cell divided into two daughter cells. They each are supposed to start new cytoplasmic division after 6.5 h. However, as shown in the optical images of Figure IV-2, the daughter cells exhibit little morphological change, suggesting that the conditions are not favorable for the yeast cells to divide. Singh et al. [41] showed that budding yeast cells cannot sustain even with 400 µW of 632.8-nm laser radiation if it lasts for a long period of time. Thus, we presume that the fission yeast cells divide only once due to 1 mW laser irradiation in our experiments. The fission yeast cells may fall into G0 (gap-0) phase without morphological changes. Even in such a case,
changes of molecular compositions are still progressing to overcome the external stress. As discussed in the next section, our results do reveal that the molecular compositions and distributions continuously vary even while there is little morphological change in optical images.
IV-2.Univariate Raman images
Using the univariate analysis described in Chapter III, 10 time-lapse univariate Raman images of a single S. pombe cell during the cell cycle are constructed at the Raman shift of 1655, 1602, 1440, 1340, 1301, 1260, 1154, 1003, 852, and 348 cm-1 within as narrow as
possible selected bands (Figure IV-2). We classify these 10 Raman images into three groups according to their assignments. The three groups are lipids, proteins, and admixtures of lipids, proteins, and other molecular species.
IV-2-1.Group of lipids
Univariate Raman images of lipids include those for the 1440 and 1301 cm-1 Raman
bands. As we discussed in Chapter III, the Raman band at 1440 cm-1 comes from the CH 2
scissoring (1439 cm-1) and CH
3 deformation (1456 cm-1) of both lipids and proteins. How
27
of lipid-rich and protein-rich Raman spectra of fission yeast cells. The peak position of the CH bend in the protein-rich spectrum (Figure IV-3a) is at 1451 cm-1, which is different from
that in the lipid-rich spectrum, i.e., 1440 cm-1 (Figure IV-3b). This result is consistent with the
fact that proteins have a larger CH3/CH2 ratio than lipids [42]. As long as we carefully choose
a narrow region around 1440 cm-1 for intensity integration (recall Chapter III), we can extract
a Raman image of lipids from contaminated bands. Compared to the 1440 cm-1 Raman band,
the 1301 cm-1 Raman band originates predominantly from CH
2 in-phase twist of lipids, so a
pure Raman image can be constructed easily.
IV-2-2.Group of proteins
The group of proteins contains the 1003 and 852 cm-1 Raman bands. Their origins are
exclusively proteins. The sharp band at 1003 cm-1 is assigned to the ring breathing mode of
the phenylalanine residue in proteins. The 852 cm-1 band is one of the tyrosine doublet,
which arises from a Fermi resonance between the ring breathing fundamental and the overtone of an out-of-plane ring bending vibration of tyrosine residues [43].
IV-2-3. Group of admixtures of lipids, proteins, and other molecular species
Here we discuss the last group consisting of the 1655, 1340, 1260, and 1154 cm-1 Raman
bands. It is well known that the peak positions of the amide I band (1657 cm-1) and the C=C
stretching of the unsaturated lipid chains (1655 cm-1) are almost identical [44]. Thus, those
severely overlapped Raman bands cannot be easily resolved even by using the same method as for the 1440 cm-1 Raman bands. The 1340 cm-1 Raman band is located at a shoulder of a
broad band around 1300 cm-1 which include a lot of complicated species, suggesting that the
contributions to the 1340 cm-1 image are very complicated. The Raman images of the weak
band at 1154 cm-1 may also suffer from large uncertainties. Furthermore, the Raman bands of
28
1000-1150 cm-1 region [45] may interfere with the 1154 cm-1 Raman images.
Despite the spectral contaminations for those complicated bands, we can still separate those admixtures, to some extent, into lipid-dominated and protein-dominated contributions. The cis-C=C band at 1655 cm-1 of lipids is usually stronger than the amide I band at 1657
cm-1 in yeast cells. Thus, the lipid-dominated Raman images at 1655 cm-1 coincide with other
lipids Raman images. However, more green patterns that fill up the entire yeast cell are observed in the Raman images at 1655 cm-1. It implies that proteins also contribute slightly to
the Raman images at 1655 cm-1. Crystalline sodium polyphosphate is known to appear in
yeast cells under conditions of starvation [17]. However, in the present work, the treatment with fresh medium provides sufficient nutrition and prevents the yeast cells from starvation. The interference from this band should thus be small. Skeletal C-C stretch modes are very broad so that we can remove this contribution by using a well-selected baseline. Thus, the 1154 cm-1 Raman images here can be considered as originating from proteins. The Raman
bands at 1340 and 1260 cm-1 are too weak to be used for constructing decent Raman images.
It is not clear whether their behaviors represent that of lipids or proteins.
IV-2-4. Others
Especially, we put the 1602 and 348 cm-1 Raman bands individually. The 348 cm-1
Raman band is assigned to polysaccharides which are abundance in the cell walls and the septa [46, 47]. To our knowledge, Raman images of this particular band in the fission yeast cells have been obtained for the first time owing to the improved S/N and sample conditions. The Raman band at 1602 cm-1 is relatively isolated from the others, but it has not yet been
given a conclusive assignment [48-50]. Recently, Chiu et al. showed that ergosterol contributes, at least partially, to the 1602 cm-1 Raman band [51]. In another project of our
group, we also studied this mysterious Raman band using ubiquinone Q10 deficient yeast cells,
29
IV-3. Time dependence of the Raman intensities during the cell cycle
Next, we discuss the time dependence of the total relative concentrations of selected bands (Figure IV-4). Note that the Raman intensity of each band is proportional to the concentration of the molecule that gives rise to the band. Moreover, the effective laser volume in the axial direction (~2 µm) here is similar to the thickness of a single fission yeast cell (~2 µm). Taken together, the Raman intensity of the band can represent dynamics changes in concentration of the molecular species within the entire yeast cell. Here we focus only on four Raman images that have been assigned unambiguously (1440 and 1301 cm-1 for lipids and
1003 and 852 cm-1 for proteins) for discussion of their specific dynamic behaviors. The
normalized total intensity of these four bands reaches a maximum at 6 h, indicating that the yeast cell produces a large amount of lipids, proteins, and other biological molecules right before dividing. Subsequently, the normalized Raman intensities of the four bands drop by ~50% when the cell divides at 6.5 h. After the cell division, they gradually increase over 15.5 h. Interestingly, the morphology of the yeast cell looks identical from 6.5 h to 22 h, but the total Raman intensities at 1440, 1301, 1003, and 852 cm-1 still gradually increase over 15 h.
Although the yeast cell might fall into G0 phase at some point after 6.5 h due to unexpected
stress, we do see slight changes in concentrations of lipids and proteins, indicating that the yeast cell might return to the regular cell cycle.
IV-4. Distribution changes of lipids and proteins during the cell cycle
In this section, we discuss the distribution of lipids and proteins in more detail. Dynamic distribution changes of lipids during the cell cycle can be explored using the 1301 cm-1
Raman images, which are constructed from a pure lipid band (Figure IV-5a). At 1 h (G2
phase), the 1301 cm-1 Raman images show that red patterns are localized at the two ends of
30
and appear to spread over the whole cell. To more quantitatively see whether the Raman images show distribution changes from a localized to delocalized pattern in the yeast cell during the cell cycle, we consider a cross-section of the Raman images that runs from upper left to lower right of the yeast cell (see lines on the Raman images of Figure IV-5a). Raman intensities at two neighboring pixels along the line as well as on the line are summed up to reduce uncertainty in the choice of a cross-section. The line profile of the Raman intensity clearly shows that lipids are localized at two ends of the yeast cell at 1 h (early G2) and
continuously becomes uniform on going from late G2 to G1/S phase. In contrast to the
distribution of lipids, that of proteins (Figure IV-5b) exhibits delocalized pattern in the each phase, indicating that the concentration of proteins is always homogeneous over the whole yeast cell. These results are consistent with our previous work [52].
We interpret this phenomenon as follows. Lipids are associated with energy storage, which is a basic metabolic process in the yeast cells [53, 54]. The yeast cell stores high concentrations of lipids for energy in some particular organelles whose locations are indicated as the aggregated areas (red areas) and prepares for the cell cycle in the early G2 phase. The
yeast cell then transfers those lipids to sites where energy is needed to start duplicating organelles and to proceed to cell division in the M and G1/S phase. As a result, the uniform
distribution is observed in this period. The present finding demonstrates the potential use of lipid Raman images as an indicator of energy consumption in the cell.
IV-5. Multivariate Raman images
To overcome the difficulty in the univariate analysis arising from possible contaminations from multiple intracellular molecules, we perform multivariate curve resolution (MCR). MCR globally analyzes Raman image data and can in principle decompose all major components contained in the spectrum of fission yeast cells. The MCR analysis of the same data set as used for the univariate analysis derived time-lapse Raman images and
31
component spectra of six chemical species (Figure IV-6). Rainbow color scale is used to represent the intensity at each pixel with red showing the highest intensity and purple the lowest. The six components are denoted 1-6. We will describe in the following how to assign each component based on its spectral feature and concentration distribution.
IV-5-1. Component 1
Component 1 shows a featureless spectrum (Figure IV-6b-1) and is distributed exclusively outside the yeast cell (Figure IV-6a-1), indicating component 1 is associated with background from the medium.
IV-5-2.Component 2
Component 2 can also be undoubtedly attributed to polysaccharides such as β-1,3-glucan, the major constituent of the yeast cell wall [55]. The Raman images of component 2 (Figure IV-6a-2) clearly visualize the cell wall at all measurement times and a septum at 6 h. Furthermore, the spectrum of component 2 (Figure IV-6b-2) is in good agreement with the reported Raman spectrum of β-1,3-glucan [16]. According to the normal-mode analysis of model disaccharides [46, 47], the low-frequency bands at 348 and 423 cm-1 are predominantly
attributed to the skeltal deformations (C–C–C, C–C–O, and O–C–O), the 890 cm-1 band to the
C–O stretch mode of the glycosidic linkage, and the 1463 cm-1 band to the CH bending mode
of the CH2OH group.
IV-5-3. Component 3
The Raman images of component 3 are almost identical to the 1301 cm-1 Raman images
(Figure IV-2) obtained with the univariate analysis, indicating that component 3 is associated to lipids. Its spectral component shows a typical lipid-rich Raman spectrum of yeast cells, including bands at 716, 1301, 1440, 1602, and 1658 cm-1. As already discussed above, the
32
cm-1 band to the CH bending of lipid chain, and the 1301 cm-1 band to in-plane CH
2 twisting.
In particular, the 716 cm-1 band is a characteristic spectral signature of phospholipid
headgroup [56, 57], suggesting that phospholipids also contribute to component 3. Moreover, close inspection of the distribution pattern of the image show a blue (low-intensity) region around the center of the cell that corresponds to the nucleus. This result is consistent with a low concentration of lipids in nuclei.
IV-5-4. Components 4 and 5
So far, we have attributed components 1-3 to background (medium), polysaccharides, and lipids, respectively. We can immediately think of proteins, another major constituent of yeast cells, as a candidate for the remaining components. The multivariate Raman images of component 4 quite resemble the univariate Raman images at 1003 cm-1, and those of
component 5 are similar to the 852 cm-1 Raman images. Because the Raman bands at 1003
cm-1 and 852 cm-1 are both ascribed to proteins, it is reasonable to assign components 4 and 5
to proteins.
First, let us look into the spectrum of component 4 (Figure IV-6b-4). The ring breathing mode of phenylalanine residues at 1003 cm-1, which is the most direct Raman indicator of
proteins, is clearly observed. In addition to the 1003 cm-1 band, we see three prominent bands
at 1658, 1606, and 854 cm-1. The 1658 cm-1 band, which is assigned to the amide I vibration,
commonly appears in proteins. Furthermore, the 1606 cm-1 band is also assigned to
phenylalanine residues [43]. It should be noted that this weak band can be resolved clearly by the multivariate data analysis. The 854 cm-1 band is one of the tyrosine doublet, which arises
from a Fermi resonance between the ring breathing fundamental and the overtone of an out-of-plane ring bending vibration of tyrosine residues [58]. The counterpart of the doublet should appear around 830 cm-1, but it is probably too weak to be seen in the spectra of
33
conclude that component 4 is the major protein component.
Although component 4 accounts for most of characteristic features found in the Raman spectrum of proteins, the Raman images of component 5 also show similar behaviors to proteins in that it is distributed over the entire yeast cell. Is component 5 also assigned to proteins? First, we noticed a relatively sharp, strong band at 845 cm-1 (Figure IV-6b-5).
Previous Raman studies [59, 60] show that the tyrosine doublet at about 854 and 830 cm-1
collapses to a single band appearing in between the doublet peaks upon phosphorylation of tyrosine residues. It is therefore plausible that the 845 cm-1 band observed in Figure IV-6b-5
is due to the collapsed band of the tyrosine doublet. It is also shown for some test peptides that a band emerges at ~920 cm-1 upon tyrosine phosphorylation [59], which is also observed
in Figure IV-6b-5. The band at 522 cm-1 is likely attributable to the S–S stretch of disulfide
bonds [43]. Both phosphorylation and formation of disulfide bridges are indicative of structural changes of proteins during the cell cycle of the S. pombe cell. It is tempting to think of component 5 alone as representing a specific class of proteins. However, its spectrum crucially lacks the significant characteristic on proteins at 1658 (amide I) and 1003 cm-1
(phenylalanine), suggesting that component 5 alone may not represent proteins. We tentatively think that component 5 reflects, at least partially, phosphorylated proteins. Strong spectroscopic evidence for this idea is shown in Figure IV-7. We synthesized the spectra of components 4 and 5 (Figure IV-6b-4,5) with a 1:1 ratio and found that the synthesized spectrum coincides well with the protein-rich Raman spectrum of the S. pombe cell.
Further evidence from multivariate Raman images is presented as Figure IV-8c. Comparison of the distribution patterns of components 4 and 5 reveal that the concentration of component 5 is always high in the region where component 4 is less abundant (Figure IV-8a,b). To better see this complementary distribution, two multivariate Raman images are overlaid with cyan and red color scales for components 4 and 5, respectively (Figure IV-8). The overlaid Raman images clearly demonstrate light cyan patterns surrounding red patterns.
34
The lower concentration of the major protein component at the red area suggests that proteins there might be a different type of proteins, possibly phosphorylated proteins. The lack of protein Raman bands such as the amide I and the phenylalanine bands in the spectrum of component 5 is due probably to a flaw in the present MCR analysis. The true spectrum of component 5 would be given by a linear combination of the spectra of components 4 and 5.
IV-5-5. Component 6
The origin of component 6 is unclear. As seen from Figure IV-6b-6, its time-lapse Raman images look like those of lipids (component 3, Figure IV-6b-3), but its Raman images suddenly disappear at 14 h. Its intrinsic spectrum (Figure IV-6b-6) shows no noticeable Raman features. In contrast with the other components, component 6 is not reproducible in terms of Raman images as well as of spectral features; the appearance of this component seems to depend on the data set. We tried MCR of the same Raman image data with five components (k = 5), but we were unable to obtain well-resolved components. It seems that the best and reasonable result can be derived only when six components are assumed.
IV-6. Time dependence of lipid and protein concentrations in multivariate analysis
We have assigned above the five major components derived from the MCR according to their spectra and qualitative temporal changes of their Raman images. More quantitative insight should be gained from the time dependence of the relative concentration of each component. Again, the Raman images constructed for polysaccharides (Figure IV-6b-2) provide an accurate boundary of the yeast cell from a molecular viewpoint. We manually summed up all Raman intensities of each component inside the yeast cell. Error bars were obtained by taking into account uncertainties in the location of the cell wall. The resulting integrated Raman intensities of lipids, major proteins, and protein-associated component are plotted as a function of measurement time in Figure IV-9.
35
IV-6-1. Lipids (component 3)
The total concentration of lipids (Figure IV-9a) appears to just fluctuate before the cell divides. However, it suddenly drops by ~50% at 6.5 h, when the cell splits into two daughter cells, and remains constant for more than 15 h afterward. Such a drastic decrease of lipids soon after the formation of a septum has not so far been observed by any methods other than Raman spectroscopy. Because lipids are known to serve as main energy storage [53] in the yeast cells, its concentration changes represent the generation or consumption of energy. In the beginning of measurement, the yeast cell starts duplicating a number of organelles and synthesizing lipids simultaneously, making the total concentration of lipids fluctuates before the cell divides. The drastic drop in concentration of lipids at 6.5 h indicates a huge energy consuming process of the cell division. The constant concentration of lipids after the cell division seems to be consistent with the possibility that the yeast cell falls into a pseudo-resting phase, G0, as we expected from the unchanged cellular shapes from 10 to 22 h.
The total relative concentration of lipids estimated with our method has important biological implications, because it allows us to quantitatively discuss how much energy is stored and used in the form of lipids before and after cell division.
IV-6-2. Major Proteins (component 4)
The dynamic change in the total concentration of major protein component is similar to that of lipids. However, a small difference is found. Figure IV-9b shows a gradual increase in the total intensity of major proteins before the cell division in contrast with that of lipids. Because proteins do not play an important role as energy source in yeast cells (they mainly work as enzymes that catalyze biochemical reactions), they need not be consumed in the duplication of cell organelles.
36
IV-6-3. Protein-associated component (component 5)
The protein-associated component exhibits markedly different time dependence (Figure IV-9c) from the lipid and major protein components. This component shows a rapid increase in total Raman intensity before the cell division. The intensity at 6 h is about 4 times as large as that at 1 h. An analogous behavior to lipids and major proteins components occurs right before the cell division; the integrated intensity suddenly decreases by ~60%. However, the intensity regains slowly after the cytoplasmic division. On the basis of primarily the spectrum (Figure IV-6b-5), we have conjectured that this component is attributed at least partially to protein molecules that undergo chemical modifications such as phosphorylation during the cell cycle. The rapid increase in integrated intensity of this component can be interpreted plausibly by two biologically cellular behaviors which the cell cycle [61] and DNA repair [62-64] need to be regulated by phosphorylation of proteins.
The 522, 845, and 920 cm-1 bands observed in the spectrum of component 5 (Figure
IV-6-5) may look questionable because they are smaller in intensity than a broad feature in the low-frequency region of the same spectrum. However, we can also see those Raman bands in averaged raw Raman spectra without performing MCR. Figure IV-10 shows a time lapse of space-resolved Raman spectra, each of which is an average of eight spectra that were obtained around the center of the S. pombe cell. Consistent with the time-dependent changes in Figure IV-9c, the three bands at ∼529, 845, and 920 cm-1 in the protein-associated component do
rapidly increase with time, confirming the validity of the MCR analysis. Furthermore, the similar changes of Raman band at tyrosine residue are observed for a 120 minute exposure with 780 nm excitation line [65]. The authors concluded that the increase of the Raman band is due to the alteration of the hydrogen-bonding state of the tyrosine OH group. The environmental changes of the OH groups can be plausibly interpreted by that the phosphoryl can change a nonpolar hydrophobic protein into a polar, very hydrophilic molecule.
37
this component is somehow related to laser irradiation. It is known that the expression of a class of proteins known as heat shock proteins [66] is significantly increased when cells are exposed to external stress such as elevated temperature. Although our excitation wavelength (632.8 nm) lies very close to a biological window (660−850 nm), a tightly focused laser beam might elevate local temperature and put certain stress on cells. In the present study, the cell cycle took longer than 20 h; the rate of the cell cycle was much slower than the normal cycle for fission yeast in PMLU medium (i.e., 3 h). This slowed cell cycle may be a consequence of the stress. Biochemical studies together with Raman microspectroscopy are needed to clarify this issue. Nevertheless we underline here that although the MCR presents limitations in separating proteins as discussed above, it was not until we performed the MCR that such a characteristic protein-associated component was extracted from complicated Raman images.
IV-7. Comparison between the Univariate and Multivariate Approaches
As we have demonstrated in the previous sections, the greatest advantage of the univariate approach lies in its simplicity. Its Raman image can be constructed straightforwardly only by selecting an appropriate baseline. For an ordinary sample, it can give reasonable and correct results. However, using the univariate approach to analyze complicated biological samples often overestimates the band intensity of a molecular species due to overlapping of other species. Figure IV-11 compares lipid-dominant and protein-dominant univariate Raman images with multivariate Raman images of lipids and major proteins component. Both lipid-dominant and protein-dominant univariate Raman images present larger green (moderate-intensity) patterns than their corresponding multivariate Raman images. For example, compare the univariate Raman images at 1440 cm-1
and multivariate Raman images of lipids (Figure IV-11a). The univariate Raman images display more green patterns that spread over the whole yeast cell. Similar features of univariate Raman images at 1003 cm-1 are also presented in Figure IV-11b. In addition, the