國 立 交 通 大 學
多 媒 體 工 程 研 究 所
碩 士 論 文
利用擴增實境與環場電腦視覺技術作園區行車導覽之
研究
A Study on Tour Guidance by Car Driving in Park Areas Using
Augmented Reality and Omni-vision Techniques
研 究 生:陳柏丞
指導教授:蔡文祥 教授
利用擴增實境與環場電腦視覺技術作園區行車導覽之研究
A Study on Tour Guidance by Car Driving in Park Areas Using
Augmented Reality and Omni-vision Techniques
研 究 生:陳柏丞 Student:Bo-Cheng Chen
指導教授:蔡文祥 Advisor:Wen-Hsiang Tsai
國 立 交 通 大 學
多 媒 體 工 程 研 究 所
碩 士 論 文
A ThesisSubmitted to Institute of Multimedia Engineering College of Computer Science
National Chiao Tung University in partial Fulfillment of the Requirements
for the Degree of Master
in
Computer Science
June 2012
Hsinchu, Taiwan, Republic of China
利用擴增實境與
利用擴增實境與
利用擴增實境與
利用擴增實境與環場電腦視覺
環場電腦視覺
環場電腦視覺
環場電腦視覺作
作
作
作室外
室外
室外
室外園區行車
園區行車導
園區行車
園區行車
導
導
導覽
覽
覽系
覽
系
系
系
統
統
統
統
研究生: 陳 柏丞
指導教授:蔡文祥 博士
國立交通大學資訊科學與工程研究所
摘要
摘要
摘要
摘要
本研究利用架設在監控車頂上的全方位環場攝影機裝置以及投射於擋風玻 璃上的平板影像,以及偵測特殊地標得到的資訊來達成直覺性且獨立的擴增實境 戶外園區導覽功能。駕駛者可以利用投射在擋風玻璃的擴增影像看到目前經過的 左右兩邊的建築物及其名字。 為了讓每個地標都有導覽的資訊,首先要建立園區導覽地圖,在這裡提出了 環場攝影機與 PTZ 攝影機的座標轉換方法,輔助建立單一地標的區間地圖。之 後,我們也提出把區間地圖合成完整的園區導覽地圖的方法,獲得每個地標在導 覽地圖中的關係。 在本研究中,此環場攝影機成像系統能夠廣範圍監看任何角度的影像畫面。 在這裡我們提出圓形地標在環場影像中會得到橢圓的形狀以及此橢圓面積在影 像中的關係。此外利用影像處理的技術,偵測出地標在影像中的中心位置。之後 計算出地標的真實世界座標,得出監控車和地標之間的方向與距離。 同時,我們利用平板投射在擋風玻璃上的影像達成擴增實境的應用。發展出 顯示目前車子所在的建築物資訊的方法。本研究也提出得到平板放置的位置與投 射的影像位置的方法,讓車內的人了解成像的位置。最後我們利用圖表遍歷方法 以及光流法,偵測出監控車轉彎的方向以及在導覽俯視圖中如何得知目前的位 置。 實驗結果顯示所提出戶外園區導覽系統確實可行。A Study on Tour Guidance by Car Driving in Park
Areas Using Augmented Reality and Omni-vision
Techniques
Student: Bo-Cheng Chen
Advisor: Prof. Wen-Hsiang Tsai
Institute of Multimedia Engineering, College of Computer Science
National Chiao Tung University
ABSTRACT
In this study, an augmented-reality based tour guidance system for use in park
areas using a video surveillance vehicle and computer vision techniques has been
proposed. When a user drives the vehicle in a park, he/she can get from the system
tour guidance information about the names of the nearby buildings appearing along
the way on the two roadsides. The building names are displayed on the iPad, which
then are projected onto the windshield for the user to observe on the driver’s seat, in a
sense of augmenting the scene seen through the car windshield by the projected
building names.
To implement a system of this augmented reality function, at first, a PTZ camera
and a two-camera omni-imaging device equipped on the vehicle roof are used for
acquiring PTZ-images and omni-images, respectively, for the purposes of guidance
map construction and vehicle localization. Guidance map construction is carried out
by use of the PTZ camera to measure feature points on nearby buildings. Vehicle
localization during vehicle driving is accomplished through 3D image analysis using
omni-images acquired of a series of red circular-shaped landmarks attached
To detect red circular-shaped landmarks around the video surveillance vehicle
during park navigation, image analysis techniques, including YCbCr color modeling,
region growing, approximation of a circle in an omni-image by an ellipse, elliptical
shape fitting, etc., are applied to segment out the corresponding elliptical-shaped
landmark in the omni-image. Also proposed is a method for obtaining the center point
of the ellipse in the omni-image to compute the 3D data of the detected landmark for
vehicle localization.
Furthermore, methods for calculating the accurate position of the iPad image
projected on the windshield, computing the accurate position of the vehicle in the
guidance map, and showing the names of the nearby buildings are proposed. Finally,
also proposed are methods for analyzing the vehicle turning direction by motion
vectors produced by optical flow analysis, and for generating a guidance map graph
for use in path planning for each tour in the park.
Good experimental results are also shown, which prove the feasibility of the
ACKNOWLEDGEMENTS
The author is in hearty appreciation of the continuous guidance, discussions, and
support from his advisor, Dr. Wen-Hsiang Tsai, not only in the development of this
thesis, but also in every aspect of his personal growth.
Appreciation is also given to the colleagues of the Computer Vision Laboratory
in the Institute of Computer Science and Engineering at National Chiao Tung
University for their suggestions and help during his thesis study.
Moreover, the author thanks to his ex-girlfriend, Angel Chen. Although she
proposes breaking up when the author will present next week, she still helps
ex-boyfriend to revise paper very hard. The author thinks he is not alone, because he
has a good partner.
Finally, the author also extends his profound thanks to his dear mom and dad for
CONTENTS
ABSTRACT (in English) ………...…….i
ACKNOWLEDGEMENTS………...iii CONTENTS……….………..……..iv LIST OF FIGURES……….………...………...vii LIST OF TABLES……….………...….….xi CHAPTER 1 Introduction...1 1.1 Motivation...1
1.2 Survey of Related Studies...4
1.3 Overview of Proposed Methods...5
1.3.1 Terminologies ...5
1.4 Contributions...8
1.5 Thesis Organization ...9
CHAPTER 2 Ideas Of Proposed Methods And System Design ... 11
2.1 Ideas of System Design... 11
2.2 System Configuration ...14
2.2.1 Hardware configuration ...15
2.2.2 Software configuration ...17
2.2.3 Network Configuration ...17
2.3 Review of Adopted PTZ-camera System ...18
2.4 Review of Adopted Omni-camera System ...19
2.5 System Processes ...22
2.5.1 Learning Process...22
2.5.2 Navigation Process ...24
CHAPTER 3 Creation Of Guidance Map...26
3.1 Introduction...26
3.2 Integration of Information Acquired by PTZ-camera and Omni-cameras ...27
3.2.1 Review of Adopted Calibration Method for PTZ-camera ...27
3.2.2 Conversion of PTZ-camera Coordinates into Omni-camera Coordinates ...30
3.3 Creation of Guidance Map...35
3.3.1 Creation of Database for Guidance Map ...35
3.3.2 Creation of Guidance Map with PTZ-camera and Omni-camer.36 3.3.3 Conversion of Local Maps into a Global Map...38
3.3.4 Algorithm for generating the guidance map ...40
Two-Camera Omni-Directional Imaging Device ...43
4.1 Introduction...43
4.2 Analysis of Circular-shaped landmark in Omni-directional Image...44
4.2.1 Approximation of Circles in Omni-directional Images by Ellipses...45
4.2.2 Property of Red Circular-shaped Landmarks in Omni-directional Images Approximated by Ellipses...49
4.3 Red Circular-shaped Landmark Detection...54
4.3.1 YCbCr Color Model ...54
4.3.2 Region Growing...56
4.3.3 Elliptical Shape Fitting in Omni-directional Images ...59
4.4 Distance Estimation between a Surveillance Vehicle and a Circular-shaped Landmark...60
4.4.1 Review of Adopted Pano-mapping Method for Omni-image and 3D Data Acquisition Process ...61
4.4.2 Calculation of Landmark Distance ...67
CHAPTER 5 Using Augmented Reality And A Two-Camera Omni-Directional Imaging Device For Park Guidance ...68
5.1 Introduction...68
5.2 Implementation of Augmented Reality Tour Guidance in a Surveillance Vehicle with an iPad ...69
5.2.1 Idea of Projecting Images Displayed on iPad onto Car Windshield ...69
5.2.2 Coordinate Estimation for Projecting iPad onto the Windshield 70 5.3 Showing Names of Buildings to the Left and Right of Surveillance Vehicle on the Windshield...77
5.3.1 Computing Accurate Position of Surveillance Vehicle on Guidance Map...77
5.3.2 Decision of Left and Right Buildings ...82
CHAPTER 6 Navigation By Guidance Map Traversals Using Vehicle Turning Information ...86
6.1 Introduction...86
6.2 Analysis of Vehicle Turning by Motion Vectors in Omni-images...87
6.2.1 Review of Vehicle Direction Analysis by Optical Flows...87
6.2.2 Vehicle Turning Decision ...87
6.3 Organization of Guidance Map for Park Navigation by Graph Traversals ...93
6.3.1 Creation of Guidance Map Graph...93 6.3.2 Updating of Landmark Labels on Guidance Map Graph during
Driving ...94
CHAPTER 7 Experimental Results And Discussions ...98
7.1 Experimental Results ...98
7.2 Discussions ...107
CHAPTER 8 Conclusions And Suggestions For Future Works ...108
8.1 Conclusions...108
8.2 Suggestions for Future Works ...109
LIST OF FIGURES
Figure 1.1 Illustration of proposed guidance system using augmented reality
techniques.. ...3
Figure 1.2 A flowchart of proposed system process.. ...9
Figure 2.1 The video surveillance vehicle used in this study with a two-camera omni-imaging device and a PTZ camera affixed on the car roof. (a) A front view of the vehicle. (b) A side view of the vehicle... 11
Figure 2.2 Positions of cameras affixed to the video surveillance vehicle roof and the corresponding FOV. (a) The omni-camera is affixed at the rear-middle of the car roof. (b) The omni-camera is affixed at the right-front of the car roof. (c) The PTZ-camera is affixed at the middle of the car roof. (b) The PTZ-camera is affixed at the border of the car roof...13
Figure 2.3 An example of landmark detection and guidance map. (a) An omni-image of a landmark detected at a sidewalk. (b) A generated guidance map showing the relative position of the car. (c) A projected image on the windshield. ...14
Figure 2.4 Structure of the proposed surveillance system. ...16
Figure 2.5 The architecture of the local network used in this study ...18
Figure 2.6 Relationship of the mirror and the CMOS sensor in camera...19
Figure 2.7 (a) Relation between the world coordinates system and the image coordinate system. (b) Simple geometry between the mirror and the CMOS sensor in the camera ...20
Figure 2.8 Flowchart of calibration of omni-cameras and PTZ-camera...22
Figure 2.9 Flowchart of learning guidance map. ...23
Figure 2.10 Flowchart of tour guidance...24
Figure 2.11 Flowchart of tour guidance...25
Figure 3.1 An illustration of transformation between image coordinate system (ICS) and spherical coordinate system (SCS) and Cartesian coordinate system.28 Figure 3.2 Camera calibrations by a vertical grid board. (a) An illustration of attaching the lines on the wall. (b) The intersections seen by camera are marked by yellow points...29
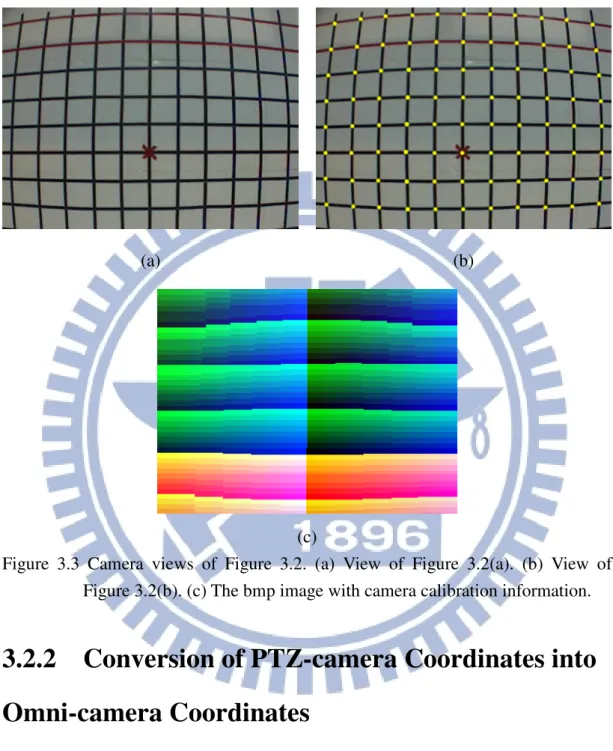
Figure 3.3 Camera views of Figure 3.2. (a) View of Figure 3.2(a). (b) View of Figure 3.2(b). (c) The bmp image with camera calibration information...30
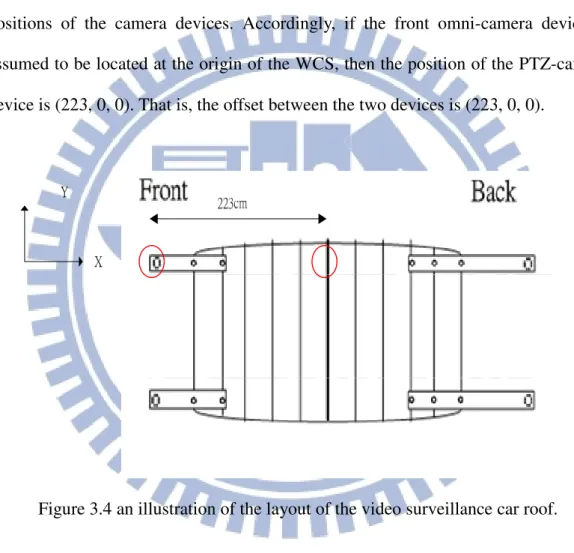
Figure 3.4 An illustration of the layout of the video surveillance car roof. ...30
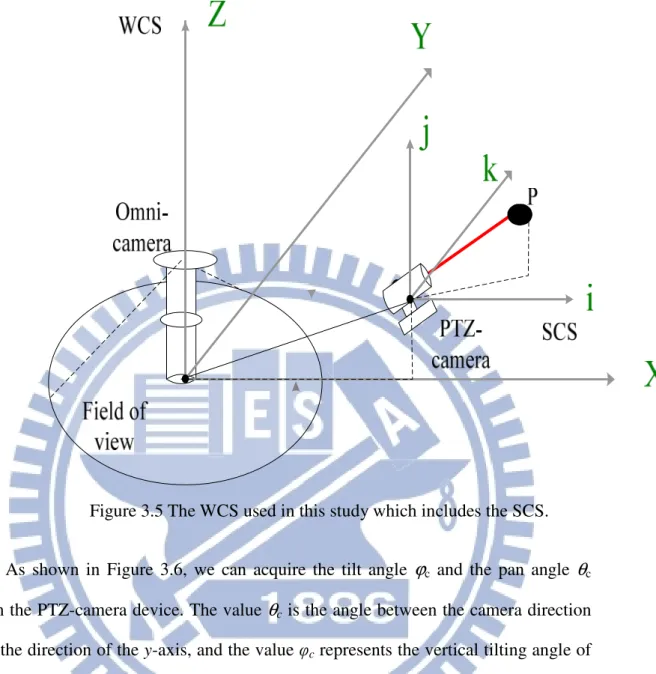
Figure 3.5 The WCS used in this study which includes the SCS.. ...31 Figure 3.6 The angle between the detected point and the PTZ-camera (a) the
PTZ-camera has a tilt angle of ϕc < 0 (b) the PTZ-camera has a tilt angle of
ϕc > 0 (c) the PTZ-camera has a pan angle of θc < 0 (d). the PTZ-camera
has a pan angle of θc > 0. ...32
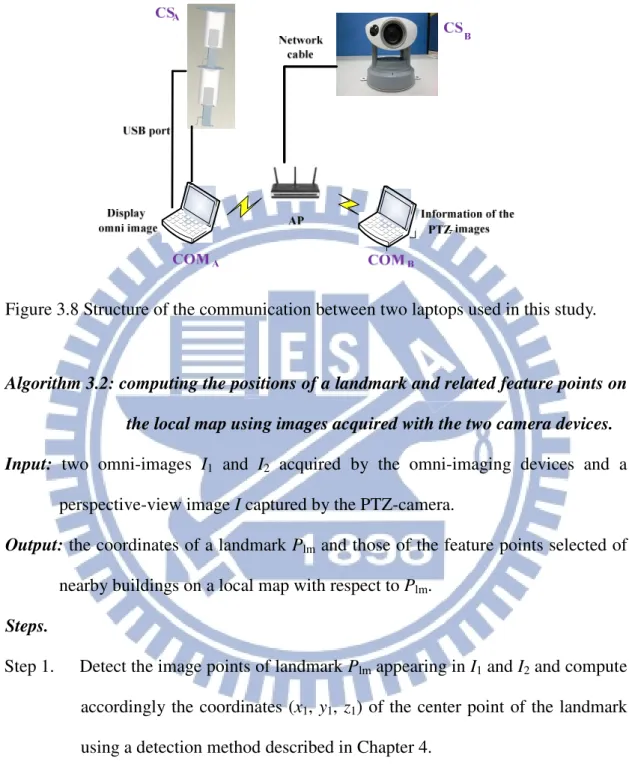
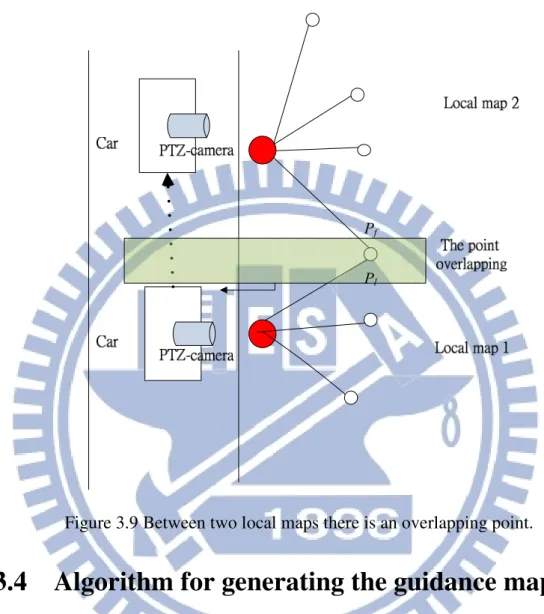
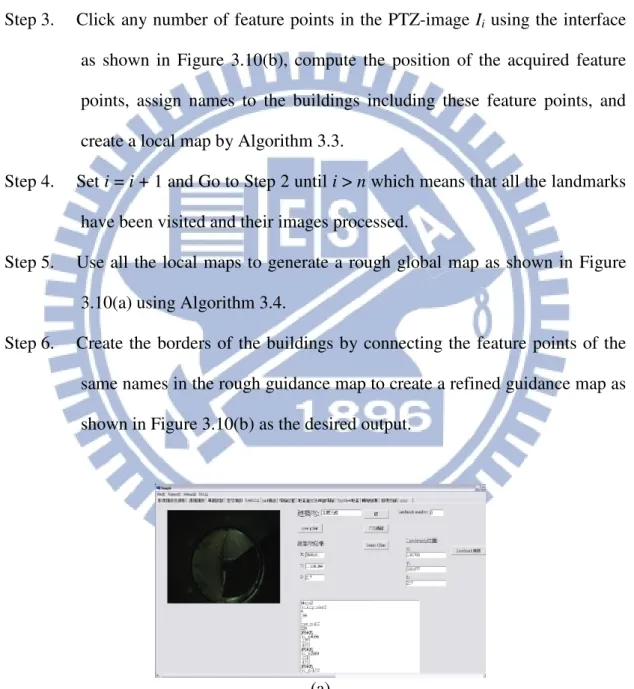
Figure 3.7 Illustration of proposed guidance map. ...33 Figure 3.8 Structure of the communication between two laptops used in this study...36 Figure 3.9 Between two local maps there is an overlapping point. ...40 Figure 3.10The GUI designed in this study for creating local maps (a) The interface
for using the omni-cameras. (b) The interface for using the PTZ-camera. 41 Figure 3.11Creating the guidance map. (a) Various feature points on the global map.
(b) The guidance map after organizing these feature points ...42 Figure 4.1 A flowchart of circular-shaped landmark detection...44 Figure 4.2 An illustration of the omni-camera coordinate system involved in this study ...46 Figure 4.3 Top view from the z direction showing the relationship between new and
original coordinate system with the new image coordinate system (u′, v′) obtained by rotating the u-axis through an angle of θw with respect to the center of the circular-shaped landmark W. ...47 Figure 4.4 A photo of a used landmark. ...50 Figure 4.5 Top view from the z direction showing the area of the ellipse A is equal to
the area of the ellipse B when the distance xw′ is the same. ...50 Figure 4.6 The results of curve fitting of the areas of the ellipses and the uwi′. ...54 Figure 4.7 An illustration of the 3D YCbCrcolor model in [15]...55
Figure 4.8 An illustration of red-colored region detection using YCbCr color model (a)
The original omni-image. (b) The binary image of the detection result.. ..56 Figure 4.9 The binary images of the landmark detection. (a) The image before region
growing. (b) The image after region growing...57 Figure 4.10An illustration of the region growing process the blue region represents
the elliptical-shaped region and the white region represents the non- elliptical-shaped region. Once the scan point is found to be in the elliptical-shaped region, the region growing process starts ...58 Figure 4.11Detection of the landmark by ellipse shape fitting. (a) The image before
region growing. (b) The image after region growing (c) Generating an ellipse for every region. (d) Deciding the best-fit ellipse shape, where the blue shape is the best-fit ellipse, and the green shape is an erroneous ellipse ...61 Figure 4.12 Interface to for user to select the landmark points. ...62 Figure 4.13 Mapping between a radius distance r and elevation angle ρ. ...63 Figure 4.14 Illustration of mapping between the azimuth-elevation angle pair of the omni-image and the horizontal and vertical axes of the pano-mapping table,
respectively.. ...64
Figure 4.15Computation of 3D information using the two-camera omni-directional imaging device. (a) The ray tracing of a scene point P in the imaging device with a hyperbolical-shaped mirror. (b) A triangle in detail (part of (a))...65
Figure 4.16 System configuration of upper omni-camera with a hyperbolical-shaped mirror ...66
Figure 4.17 The relative position of the landmark and the video surveillance car. (a) The omni-image. (b) The position of the video surveillance car on the guidance map ...67
Figure 5.1 An illustration of the augmented reality display of the image on the iPad. (a) The projected image on the windshield (b) The relationship between the eyes of a visual angle and the positions of the seats.. ...71
Figure 5.2 An illustration of the projection of iPad image onto the windshield...72
Figure 5.3 An illustration of the projected image. ...74
Figure 5.4 The four corner points of the iPad. ...75
Figure 5.5 Illustration of the coverage of the projected image on the windshield...76
Figure 5.6 Illustration of selected detection regions. (a) The left-front region. (b) The left-back region. ...78
Figure 5.7 Illustration of the car direction on the guidance map.. ...80
Figure 5.8 (a) The detected landmark of the left-front region. (b) The position of the video surveillance vehicle by (a) (c) The detected landmark of left-back region. (d) the position of the video surveillance vehicle by (c) (e) The detected landmark of left-front region again (f) the position of the video surveillance vehicle by (e) ...81
Figure 5.9 Illustration of displaying the names of buildings. ...82
Figure 5.10 An experimental result of displaying the names of the buildings. (a) The name of the current-visited buildings. (b) The position of the video surveillance vehicle by (a) (c) The name of the next-visited buildings. (d) The position of the video surveillance vehicle by (c). ...85
Figure 6.1 Transformation of a motion vector from the ICS into the WCS. (a) An illustration of the camera system and the motion vector. (b) The ray tracing of a scene point P on the ground projected on the hyperbolical-shaped mirror...90
Figure 6.2 A distribution chart of the direction angles of motion vectors.. ...92
Figure 6.3 A graph of finite state machine proposed to determine the moving direction [17]...93
Figure 6.4 The graph of the guidance map. (a) An illustration of organizing guidance map. (b) The guidance map graph of our experimental environment...94
Figure 6.5 A flowchart of deciding the label of the next landmark on the guidance map graph for graph traversals. ...96 Figure 6.6 An experimental result of turning direction determination. (a) The position
of the video surveillance vehicle and the detected forward direction. (b) The position of the video surveillance vehicle and the decided left direction.. ...97 Figure 7.1 Illustration of the experimental guidance area.. ...98 Figure 7.2 A learning interface of the experiment. (a) An interface for using the
omni-camera. (b) An interface for using the PTZ-camera ...99 Figure 7.3 A guidance map of the experiment environment ...99 Figure 7.4 An experimental result of landmark detection. (a) An elliptical-shaped
landmark in the omni-image. (b) Image of landmark detection by region growing ...100 Figure 7.5 A guidance map of the experimental environment.. ...100 Figure 7.6 An experimental result of guidance tour. (a) The current landmark in the
right-front region. (b) The image of the iPad projected on the windshield. (c) The position of the vehicle on the guidance map ...101 Figure 7.7 Another experimental result of guidance tour. (a) The current landmark in
the right-front region. (b) The image of the iPad projected on the windshield. (c) The position of the vehicle on the guidance map...102 Figure 7.8 A third experimental result of guidance tour. (a) The current landmark in
the right-front region. (b) The image of the iPad projected on the windshield. (c) The position of the vehicle on the guidance map...103 Figure 7.9 An experimental result of vehicle turning determination. (a) The
omni-image, the image of detection result, and the decided vehicle direction of positive x-axis. (b) The image of the iPad projected on the windshield. (c) The position of the vehicle on the guidance map...104 Figure 7.10 Another experimental result of vehicle turning determination. (a) The
omni-image, the image of detection result, and the decided vehicle direction of positive x-axis. (b) The image of the iPad projected on the windshield. (c) The position of the vehicle on the guidance map...105 Figure 7.11 A third experimental result of vehicle turning determination. (a) The
omni-image, the image of detection result, and the decided vehicle direction of positive x-axis. (b) The image of the iPad projected on the windshield. (c) The position of the vehicle on the guidance map...106
LIST OF TABLES
Table 2.1 Specifications of the laptop computers and the pad used in this study. ….17 Table 2.2 Specifications of used COMS cameras ………. 21 Table 4.1 The computed values of the area of the elliptical shape and uw………… 56
Table 4.2 An example of the pano-mapping table……… .69 Table 6.1 The range of the angles of the three vehicle moving directions………… 97
Chapter 1
Introduction
1.1
Motivation
Nowadays, with the progress of computer technology, video cameras have
become more and more popular in various applications, bringing convenience and
improving welfare in our daily life. For example, a video surveillance vehicle with
its roof equipped with video cameras can help a driver to monitor surrounding
environments and to be aware of dangerous conditions so that upcoming accidents
can be avoided in time. In other cases, people often equip cars with video cameras
like digital driving recorders, and once a traffic accident occurs, the driver can
clarify the responsibility for the event by inspecting the video record.
In addition to video cameras, the augmented reality technique can help the driver
of a vehicle as well. For example, there exists commercially a type of head-up
display on the windshield, which can show the car speed and the fuel consumption
condition in real time. Through this type of equipment, the driver can look up at the
information displayed on the windshield conveniently rather than look down at the
dashboard. The latter action will cause accidents sometimes. Besides, by projecting
the information of the road in front and the surrounding buildings on the windshield
(their names, numbers, etc.), the augmented reality technique can help implementing
a car navigation system which provides the driver the surround condition at any time
for safe driving on roads.
Most researches of vision-based techniques for the mentioned applications are
field of view (FOV) of a projective video camera is limited. When we want to see
panoramic images of a spot from the roof of a video surveillance vehicle, four or
more of such cameras are required. If we implement a video surveillance car system
using such cameras, it will consume a larger cost and need more overhead in
computing. Therefore, we choose the omni-camera to be our imaging device in this
study. Panoramic images of the environment around the video surveillance vehicle
can be covered by such an omni-camera system.
Although current augmented reality techniques seem useful to assist drivers, they
are difficult to use for the purpose of acquiring the current information of the
environment around the car. Specifically, a GPS is often used to get outdoor location
information, but using the GPS for this purpose has some problems. Firstly, the GPS
is not very accurate, and this will yield possibly erroneous information to the
augmented reality system. Secondly, the GPS does not work in tunnels or inside big
buildings. Therefore, we propose in this study is to integrate omni-cameras and
augmented reality techniques with a video surveillance vehicle to implement an
effective augmented reality system for outdoor uses. Through omni-image analysis
and omni-camera calibration, we can get accurate information of the outdoor
environment for the proposed augmented reality system. Furthermore, the
omni-cameras equipped on the video surveillance vehicle and the augmented reality
system inside the vehicle can be used together to develop functions for various
applications.
To sum up, the research goal in this study is to develop a tour guidance system
for use by car driving. To accomplish the goal, we will use a video surveillance car
with a two-camera omni-imaging device as an experimental platform. Also, we will
use an iPad to simulate the head-up display device for use inside the video
will place landmarks in the guidance area and use computer vision techniques to
obtain the positions of nearby buildings via analysis of the omni-images of these
landmarks acquired by the omni-camera on top of the vehicle. An illustration of the
proposed system is shown in Fig. 1.1.
Figure 1.1 Illustration of proposed guidance system using augmented reality techniques
Listed below are the more detailed descriptions of the desired capabilities of the
proposed system.
(1) The proposed video camera system can help creating a guidance map. For this, a local map is created first by the use of the two-camera omni-image system and a
PTZ camera. Moreover, we propose a method to convert local maps into a
global map.
measure its position and height. It then marks the relative location of the video
surveillance car on the guidance map.
(3) The system is capable of computing the accurate position of the information displayed on the iPad for projection onto the windshield. Moreover, in the
projected image onto the windshield, the name of nearby buildings on the two
roadsides can be displayed for tour guidance.
(4) The system can analyze omni-images to decide the turning direction of the vehicle when necessary, and choose a correct path on the guidance map.
1.2
Survey of Related Studies
In recent years, many techniques have been developed for use in the applications
of video surveillance. For example, Trivedi et al. [1] proposed methods to enhance vehicle safety by video surveillance systems with omni-cameras; and Kim and Suga
[2] proposed a method to detect motion vectors using optical flows with an
omni-camera.
Moreover, new video devices can be designed by combining projective cameras
and mirrors, resulting in new types of omni-vision systems. Also, two omni-images
together taken by these omni-vision systems can provide stereo information. In this
aspect, a method to obtain stereo information for mobile robot navigation with an
omni-vision system which consists of two mirrors and one camera was proposed by
He et al. [3]; and a method to detect a suspicious passer-by automatically by a stereo
vision system which consists of a pair of two-camera omni-imaging devices was
proposed by Yuan and Tsai [4]. Jeng and Tsai [5] proposed a method based on the
concept of pano-mapping table to calibrate omni-cameras without knowing the
extrinsic parameters of the omni-cameras.
have been developed in the past decade. Betke and Gurvits [6] proposed a standard
localization method to identify surrounding landmarks in the environment and find
their corresponding locations in an environment map built in advance. Wu and Tsai
[7] proposed a vision-based method for location estimation for use in autonomous
land vehicle (ALV) navigation in indoor environments using circular landmark
information in an omni-directional image. To detect various landmarks in
omni-images, Ho and Chen [8] proposed an algorithm to detect ellipses, and Wang
and Tsai [9] proposed a method which uses an elliptic skin model to detect human
faces by color and shape features in images.
In this study, an integration of augmented reality and a video surveillance system
for various applications is developed. In a similar work, Grosch [10] proposed a
method to use panoramic images for navigation in a real environment. Also,
augmented reality for outdoor applications has been widely investigated in recent
years. In this aspect, Lee et al. [11] conducted a study on using omni-vision to track,
in large areas, the camera pose which simulates the user’s view in the augmented
reality environment; and Reitmayr and Drummond [12] proposed a model-based
hybrid tracking system for outdoor augmented reality in urban environments
enabling accurate, realtime overlays for a handheld device. In addition, techniques of
augmented reality can assist a driver in driving a car. For example, one can use the
augmented reality technique to create a head-up display device in a car. Sandor et al.
et al. [13] has proposed a method for doing this type of task in their study.
1.3
Overview of Proposed Methods
1.3.1
Terminologies
1. Omni-camera: a camera system with a traditional projective camera and a reflective mirror which can be used to capture images of 360o fields of view. 2. Omni-image: an image captured with an omni-camera.
3. Two-camera omni-imaging device: a camera system constructed with two omni-cameras connected back to back and coaxially.
4. Video surveillance vehicle: a car with a two-camera omni-imaging device equipped on the car roof as well as a laptop for use as a control unit and a pad
inside the car used to develop a tour guidance system.
5. Optical flow: a method to estimate the motions of shapes, surfaces, and edges of concerned objects between two sequential images.
6. Guidance map: a map to show the relative position of a car with respect to the entire guidance area.
7. Landmark: a circular-shaped red-colored flat object which we place on roadsides of the guidance area to get the information of the guidance map.
8. PTZ camera: a projective camera with a controllable configuration which can be used to pan, tile, and zoom.
9. Perspective-view image: an image acquired with the PTZ camera.
1.3.2
Brief Descriptions of Proposed System
There are four goals in developing the proposed system as described in the
following.
1. The system is able to create local maps using omni-images acquired with the two-camera omni-imaging device and perspective-view images acquire by the
PTZ camera, and convert the local maps into a global one.
2. Regardless of high or low terrains, the system is able to detect a landmark and obtain its 3D information, and compute accordingly the location of the video
surveillance car on the guidance map.
3. The proposed system is able to compute the position of the information to be displayed on the iPad which, together with the names of nearby buildings at the
current position, is then projected onto the windshield of the video surveillance
vehicle.
4. The system is able to analyze the acquired omni-images to decide the car turning direction (left or right) when encountering a road cross or branch.
In order to achieve the above goals, the following are the major steps of the
system process of the proposed guidance system.
1. Set up the previously-mentioned two-camera omni-image device on the roof of the video surveillance vehicle on the front-right corner and an iPad inside the car.
2. Calibrate the omni-cameras for six outward view directions and use the pano-mapping technique to generate six corresponding pano-mapping tables.
3. Integrate the PTZ-camera coordinate system with the omni-camera coordinate system to create local maps in the guidance area.
4. Convert the local maps into a global one.
5. Detect any landmark in the surround of the video surveillance car using the two acquired omni-images by eliminating the ground regions in the two omni-images,
using the property of a circular shape in each omni-image, and getting the center
point of the landmark as its location in each ;omni-image.
6. Use the landmark location detected in each of two omni-images to compute the 3D information of the vehicle.
7. Organize the graphs in the guidance map and use a graph traversal method to create a navigation path, including road branches as well as turnings.
8. Calculate the relative positions of the image to be projected onto the windshield and display the names of the currently-visited buildings on two roadsides.
9. While the surveillance vehicle is going to turn, analyze its turning direction by an optical flow method, transform the extracted motion vectors into the world
coordinate system (WCS), and keep track of the nodes of the graph.
10. Repeat the above steps until the vehicle reaches a pre-selected destination. A brief illustration of the above system process is shown in Fig. 1.2.
1.4
Contributions
The following is a list of the major contributions made in this study.
1. A method is proposed to convert the PTZ-camera coordinates into the omni-camera coordinates, to help creating the global guidance map.
2. A local network is constructed, which integrates a two-camera omni-imaging device, a PTZ-camera, and two laptop computers for use in guidance map
creations.
3. A method for detecting an ellipse-shaped landmark and computing accordingly the accurate position of the car in the guidance map is proposed.
4. A method of projecting the screen of the iPad onto the windshield of the video surveillance vehicle to implement an augmented reality-based head-up display
device.
5. A method for computing the accurate position of the iPad image projected on the windshieldis proposed.
6. A method for computing the accurate position of the car in the guidance map and showing the names of the nearby buildings on the windshield is proposed.
7. A method for analyzing car turning directions is proposed.
8. A method for creating graphs from the guidance map and keeping track of the node being visited by graph traversal is proposed.
Start of Tour Guidance
Display guidance map and the name of buildings
Detection of the landmark
Estimating the position of the landmark on the
guidance map
Analyzing of the nearby buildings Creating guidance
map
Camera calibration
Figure 1.2 A flowchart of proposed system process.
1.5
Thesis Organization
In the remainder of this thesis, we introduce the system configuration and the
idea behind the proposed system in Chapter 2. The structure of the two-camera
omni-imaging device is also described. In Chapter 3, the proposed method for using
the two-camera omni-imaging device and the PTZ camera to help creating a guidance
map is described. In Chapter 4, the proposed method for detecting a landmark to
obtain the stereo data is described. In Chapter 5, the proposed method for projecting
tour guidance information on an iPad onto the windshield is described. In Chapter 6,
the proposed method for organizing graphs in the guidance map to conduct graph
for proceed car tours in the guidance area is described. In Chapter 7,
experimental results and discussions are included. Finally, conclusions and some
Chapter 2
Ideas of Proposed Methods and
System Design
2.1
Ideas of System Design
In order to monitor the surrounding environment of the video surveillance
vehicle, we affix a two-camera omni-imaging device and a PTZ camera, instead of
traditional projective cameras, on the roof of the surveillance vehicle in this study.
The omni-camera can be used to monitor 360 degrees of the car surround and enhance
acquisition of necessary scene information outside the car. The PTZ camera can pan,
tilt, and zoom by computer control. The aforementioned structure of the surveillance
vehicle used in this study is shown in Figure 2.1. Note that the two-camera
omni-imaging device includes two omni-cameras aligned coaxially and back to back,
as mentioned previously.
(a) (b)
Figure 2.1 The video surveillance vehicle used in this study with a two-camera omni-imaging device and a PTZ camera affixed on the car roof. (a) A front view of the vehicle. (b) A side view of the vehicle.
onboard camera system to everywhere, but we have to determine the best locations on
the car roof where the omni-imaging device and the PTZ camera should be affixed,
respectively. We discuss where to affix the omni-imaging device at first. As illustrated
in Figures 2.2(a) and 2.2(b), if we affix the device at the front middle of the car roof; a
half of the omni-image acquired with the device is undesirably the car body. But if we
affix it at the right-front position of the surveillance vehicle roof, only a quarter of the
omni-image taken with the same imaging device is the car body. Therefore, in this
study we decide to affix an omni-imaging device at the right-front of the surveillance
vehicle roof. Second, as illustrated in Figures 2.2(a) and 2.2(b), the PTZ-camera is
affixed at the border position of the surveillance vehicle roof. If the PTZ-camera were
affixed instead at the middle position of the surveillance car roof, it would cover
undesirably a half of the car body.
Furthermore, we analyze the images acquired with these imaging devices to
create a guidance map and extract information for tour guidance by detecting
landmarks appearing in the acquired images. The landmarks are detected by
algorithms proposed in this study, such as region growing, YCbCr color modeling,
ellipse fitting, etc. The details will be described in Chapter 4. The landmarks can be
used to navigate the vehicle in the guidance area, but they do not all lie on planes of
the same height. Using the two omni-cameras in the omni-imaging device, we can
solve this problem by estimating relevant 3D data of the landmarks.
Moreover, in order to create the guidance map, the PTZ-camera can be used at
first to get feature points of nearby buildings (the detail will be described in Chapter
3), then the positions of landmarks are obtained accordingly, and finally the location
of the video surveillance vehicle is computed (the detail will be described in Chapter
4). Also, we use an iPad-like mobile device (called a pad hereafter) to simulate a
the pad onto the windshield can be estimated so that the driver does not have to put
the pad into an accurate pose under the windshield (the detail will be described in
Chapter 5). The projected image is designed to include the names of the
currently-visited buildings on the left and right road sides, allowing the driver to
understand the current vehicle’s location in the guidance area. An example of the
guidance map and a displayed image with building names on the pad is shown in
Figure 2.3. (a) (b) Car (c) (d)
Figure 2.2 Positions of cameras affixed to the video surveillance vehicle roof and the corresponding FOV. (a) The omni-camera is affixed at the rear-middle of the car roof. (b) The omni-camera is affixed at the right-front of the car roof. (c) The PTZ-camera is affixed at the middle of the car roof. (b) The PTZ-camera is affixed at the border of the car roof.
method in acquired omni-images so that we can estimate the vehicle’s moving
direction when meeting a branching road. In this way, we will not get lost on any path
in the guidance map by keeping track of the graph nodes in the guidance map.
2.2
System Configuration
The proposed video surveillance system will be described elaborately in this
section. The description will be separated into three parts: hardware configuration,
software configuration, and network configuration. The hardware includes: 1) a video
surveillance vehicle, 2) a two-camera omni-directional imaging device and a
(a) (b)
(c)
Figure 2.3 An example of landmark detection and guidance map. (a) An omni-image of a landmark detected at a sidewalk. (b) A generated guidance map showing the relative position of the car. (c) A projected image on the windshield.
PTZ-camera device, and 3) two laptop computers and a pad. The software includes: 1)
a program used to integrate the vision-based system, 2) the drivers of the
omni-cameras and the PTZ-camera, and 3) the program developed by the ARTRAY
Company which is a provider of CCD cameras. The two-camera omni-directional
imaging device and the PTZ-camera are controlled by the laptop computer, and the
pad has to receive information sent by a laptop computer, so we construct a local
network to handle the task of communication among all the equipments.
2.2.1
Hardware configuration
The surveillance vehicle, named Delica, is made by Mitsubishi Co. It is a 469cm
×169cm×196cm vehicle with a working table and a power supply. System operators
may sit inside the surveillance vehicle to operate the laptop computers and monitor
the entire surrounding environment. Moreover, a steel frame is affixed to the car roof,
on which the omni-image device and the PTZ camera are affixed. And two extension
USB cords and a cross-over cable crossing the video surveillance vehicle were added
to facilitate transmitting images captured with the omni-imaging device and the
PTZ-camera. Detailed descriptions of the functions of the imaging devices will be
given in Sections 2.3 and 2.4. The entire video surveillance system is shown in Fig.
2.4.
In order to control the entire guidance system, we use two laptop computers and
a pad as control units, with the laptops handling the omni-imaging device and the
PTZ-camera. Both laptops are produced by TOSHIBA Computer Inc. The pad, named
Eee Pad Transformer, is produced by ASUS Computer Inc. We simulate a head-up
display device by projecting images appearing on the pad onto the windshield of the
Figure 2.4 Structure of the proposed surveillance system.
Table 2.1 Specifications of the laptop computers and the pad used in this study.
Tecra M11 Satellite A660 Eee Pad Transformer
CPU Intel Core
i7-620M2.66/3.33GHz
Intel Core i5-480M 2.66/2.93GHz
NVIDIA Tegra2.1.0 GHz
RAM 4G DDR3 1066MHz 2G DDR3 1066MHz 1GB
GPU nVidia NVS 2100M ATI HD5650 none
Network Gigabit LAN Fast Ethernet LAN WLAN 802.11 b/g/n 2.4GHz
To exchange commands and information of guidance between the two laptops
and the pad, we use an access point (AP) to connect them and set up a local network
2.2.2
Software configuration
We use a Borland C++ Builder (BCB) V6 as the development platform to build
our guidance system. The BCB is a program development tool for the operating
system of Windows by which we can create a graphic user interface (GUI)
conveniently and quickly. The programming language we use is C++. It is a widely
used language. One of the laptops, the Tecra M11 computer, uses the operating
system of Windows 7, and the other, Satellite A660, uses Windows XP.
The operating system of the pad is Android 3.2, and we develop the applications
by the use of the Eclipse. However, we need to install the JAVA development tool
(JDK) and Android development tool (ADT) in the Eclipse, so that we can develop
Android applications in this environment.
In order to use the camera devices, we have to install the drivers of the
ARTCAM-200SS cameras and ARIA into the laptops. The camera company also
provides corresponding software development kits (SDKs), in addition to, we can use
simple source codes to know the purpose of call functions in the program.
Accordingly, we can adjust the parameters of each camera, such as the value of
exposure or the global color gain, through the SDK. Moreover, the camera company
not only provides the BCB but also the C, VB.NET or C#.NET to the programmers.
2.2.3
Network Configuration
A network configuration is needed for communication between the two laptop
computers and the pad because two omni-images are acquired from the two-camera
omni-directional imaging device and the PTZ-camera, and each imaging device is
processed by a laptop, respectively. Moreover, the laptops also send data to the pad.
As a result, to communicate between the two laptops and the pad, we set up a local
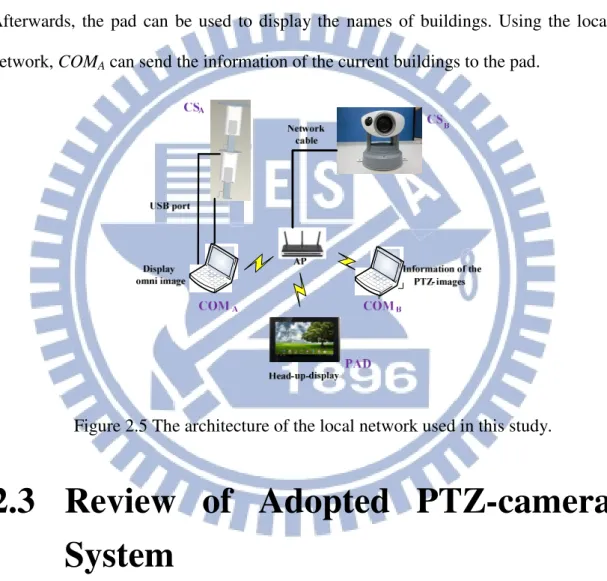
As shown in Fig. 2.5, the access point (AP) can provide a wireless environment;
and the devices can be connected to one another through the AP. The laptop computer
COMA can be used to create the guidance map and guide the navigation. Itcan be used
to acquire not only the data of the two omni-images by itself but also the data of the
PTZ image (the image taken by the PTZ camera). On the other hand, the laptop
computer COMB needs to receive these images from COMA through the local network.
Afterwards, the pad can be used to display the names of buildings. Using the local
network, COMA can send the information of the current buildings to the pad.
Figure 2.5 The architecture of the local network used in this study.
2.3
Review of Adopted PTZ-camera
System
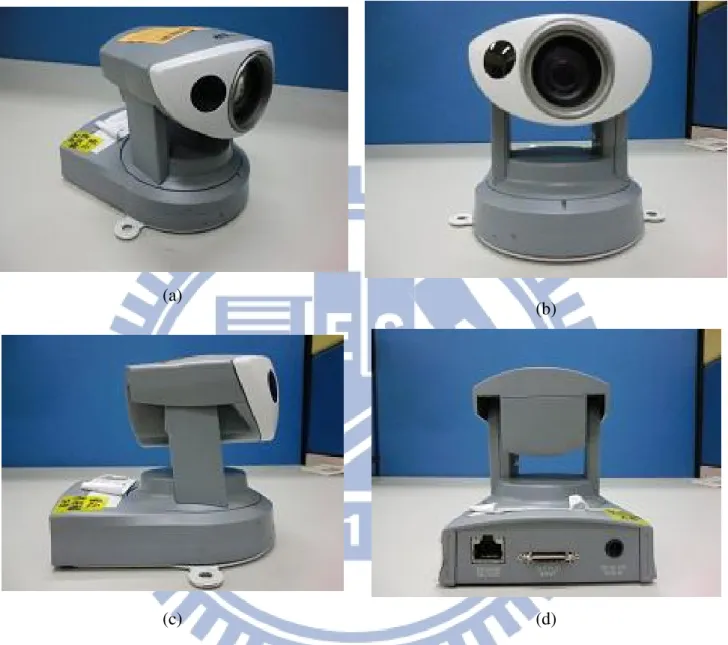
In this section, we review the adopted PTZ-camera system with panning,
tilting, and zooming capabilities. In this study we usean AXIS 213 PTZ camera
made by AXIS Inc. as shown in Figure 2.6. This is a camera with a height of
130mm, a width of 104mm, a depth of 130mm, and a weight of 700g. The pan
optical zooming and 12x digital zooming capabilities. The image captured is of
the resolution of 320×240 pixels.
(a)
(b)
(c) (d)
Figure 2.6 The pan-tilt-zoom camera used in this study. (a) A perspective view of the camera. (b) A front view of the camera. (c) A left-side view of the camera. (d) A back view of the camera.
2.4
Review of Adopted Omni-camera
System
In this section, we review the adopted omni-camera system which includes two
CMOS cameras of model ARTCAM-200MI. Table 2.2 lists the specifications of the
COMS cameras.
Table 2.2 Specifications of used COMS cameras.
ARTCAM-200MI
Resolution 2.0 M pixels(1600*1200)
Dimension 33mm × 33mm × 50mm
CMOS sensor size 1/2” (6.4×4.8mm)
Mount C-mount
Frame per second 5 fps
Direct show camera No
To produce an omni-camera, we need to combine a projective CCD camera and a
hyperbolical-shaped mirror together. The parameters of each of the
hyperbolical-shaped mirrors are described here. The radius r of the hyperbolic-shape
mirror is 4cm, the focal length f of the projective camera is 6 mm, and the sensor
width Sw of the camera is 2.4mm. Also, the axis of the camera is aligned with the axis
of the canterpoint of the hyperbolic-shape mirror.
As shown in Fig. 2.7, by the principle of similar triangles, the distance d between
the optical center and the mirror center can be computed by the following equation:
w
d f
r = S . (2.1)
Also, as shown in Fig. 2.7(a), the hyperbolic-shape of the mirror in the camera
coordinate system may be described as:
2 2 2 2 2 2 1, R Z R X Y a −b = − = + . (2.2)
The coordinates (X, Y, Z) specify a point P in the world coordinate system (WCS). Let
the projection of P into the image plane of the camera be the point p with image
coordinates (u, v) in the image coordinate system (ICS). In order to get the parameters
a and b of the hyperbolic-shape of the mirror, first we have to acquire the elevation
angle α in Figure 2.7(a) from the relation between the camera coordinate system (CCS)
and the ICS according to Wu and Tsai [7] as follows:
2 2 2 2 ( ) sin 2 tan ( ) cos b c bc b c
β
α
β
+ − = − (2.3)where
β
is the azimuth angle as shown in Fig. 2.8(a). To compute it, let the distance from the origin O of the camera coordinate system shown in Fig. 2.8 to the mirrorcenter Om be denoted as c, and let that from the lens center Oc of the camera to Om be
denoted as d which may be measured in advance. Then, we can compute c by the
simple formula d = 2c because O is defined to be at the middle point between Om and
Oc. Accordingly, in Eq. (2.3), let the omni-camera have the largest FOV, and the
incidence angle α be set 0. Then, the angle θ and thereby β, according to Fig. 2.8(a),
can be computed as follows:
1 tan , 2 2 r c
θ
π
β
θ
− = = − (2.4)where r is the radius of the circular area of the base of the mirror. Using Eq. (2.4), the
parameter b can be obtained by solving Eq. (2.3).Finally, the parameter a is derived
2 2
c= a +b . (2.5)
Each omni-camera was built with these parameter values, and a two-camera
omni-directional device can be constructed with two omni-cameras aligned vertically.
(a) (b)
Figure 2.8 (a) Relation between the worlds coordinates system and the image coordinate system. (b) Simple geometry between the mirror and the CMOS sensor in the camera.
2.5
System Processes
2.5.1
Learning Process
The first part of our guidance system is the learning process. The camera system
is useful to get feature points from captured images. In this study we use a
two-camera omni-imaging device to get stereo information using the extracted feature
points. For camera calibration, the pano-mapping method using pano-tables is applied.
The process will be introduced in Chapter 4. Moreover, the PTZ-image can be used to
obtain the angle between a PTZ-camera and a point of a building through an angular
mapping. The process will be introduced elaborately in Chapter 3.
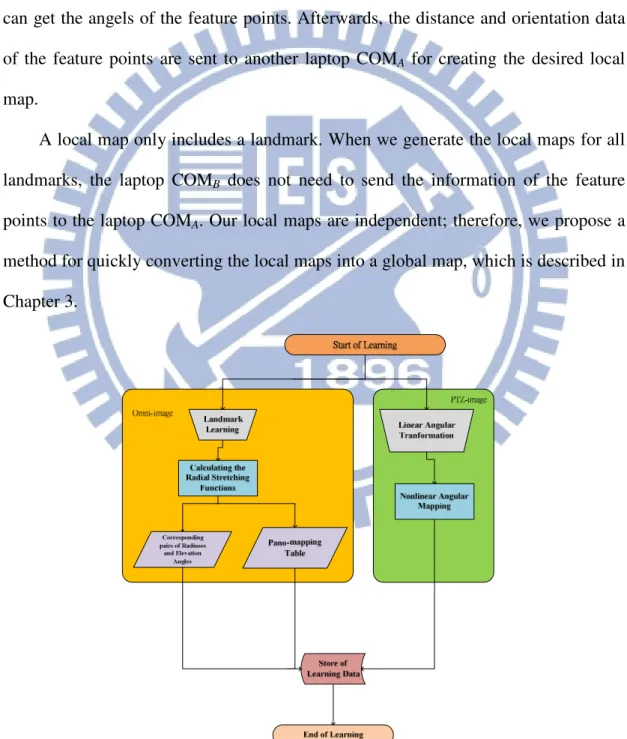
Therefore, we propose a learning strategy. As shown in Figure 2.9, the laptop COMA
is used to analyze acquired omni-images of the surrounding environment and compute
the position of the landmark in the omni-image through an ellipse fitting method. In
addition, the laptop COMB is used to capture PTZ-images of neighboring buildings,
and then we choose feature points of the buildings manually and use compute their
distances using the pano-table. Furthermore, through the angular mapping method, we
can get the angels of the feature points. Afterwards, the distance and orientation data
of the feature points are sent to another laptop COMA for creating the desired local
map.
A local map only includes a landmark. When we generate the local maps for all
landmarks, the laptop COMB does not need to send the information of the feature
points to the laptop COMA. Our local maps are independent; therefore, we propose a
method for quickly converting the local maps into a global map, which is described in
Chapter 3.
Figure 2.10 Flowchart of learning guidance map.
2.5.2
Navigation Process
The second part of our guidance system is the navigation process. In
Section 2.5.1, we mentioned how we create a guidance map through the learning
process. Accordingly, we can estimate the position of the video surveillance car
on the guidance map and implement our tour guidance system in the navigation
process. First of all, we use the captured omni-images to detect the landmarks at
the sidewalk. Then, by using the pano-mapping table, the 3D information of the
landmarks can be estimated. The process will be introduced elaborately in
Chapter 4. Next, the turning direction of the surveillance vehicle is checked by
an optical flow method. We use the turning direction to keep track the current
detailed process will be introduced in Chapter 6. After the laptop COMAreceives
the position of the currently-visited landmark and the vehicle turning direction,
we integrate these data to obtain the position of the video surveillance vehicle
and get the information of the neighboring buildings. Finally, we need to send
the names of buildings to the pad. For this, at first through the AP, we can use
the local wireless network to connect the laptop COMA and the pad. The laptop
COMA then sends the names of the nearby buildings to the pad. Then, we display
the names of the buildings as an image shown on the pad and project the image
onto the car windshield. Moreover, we propose a method to estimate the position
of the projected images on the windshield. The user can use the method to place
the pad conveniently. The detailed process will be introduced in Chapter 5. As
shown in Figure 2.11, we can know the flowchart of navigation process.
Chapter 3
Creation of Guidance Map
3.1
Introduction
In this chapter, we describe the details of the method we propose to generate the
guidance map for use in the proposed augmented reality based tour guidance. Using
the omni-camera device and the PTZ-camera device affixed to the roof of the video
surveillance vehicle, we can create the guidance map quickly.
The proposed guidance map includes the center points of the landmarks and
some feature points of objects of interests in the guidance area. We can use prominent
points on any objects, like buildings, lamps, chairs, etc., as feature points. However,
in this study, we just choose the corner points of buildings as the feature points
because buildings are the most obvious objects in the guidance area and we can get
prominent feature points of buildings conveniently in images.
In general, we use a ruler and a protractor to measure manually the distance
between the PTZ-camera and every feature point, as well as the orientation of the
camera direction with respect to the line from the PTZ-camera to the feature point. On
the other hand, in this study we use the omni-camera to detect and estimate the
location of each landmark automatically, which is defined to the position of the center
of the landmark. The detail will be described in Chapter 4.
In addition, Wang and Tsai [9] proposed a method for angular mapping for
camera calibration to compute the angular information of points in the PTZ-image.
The PTZ-camera can be used to estimate the directions of feature points by the
method. However, we have to combine the information of the landmark with that of
coordinates into omni-camera coordinates. The detail will be described in Sections 3.2
and 3.3.2.
By the aforementioned techniques, local maps of landmarks can be created. In
Section 3.3.2, we describe a graphical user interface (GUI) which we design in this
study for a user to create the local map of every landmark. Moreover, a method for
combining multiple local maps into a single global map is also proposed in this study,
which we describe in Section 3.3.3.
3.2
Integration of Information
Acquired by PTZ-camera and
Omni-cameras
3.2.1
Review of Adopted Calibration Method for
PTZ-camera
In order to get the orientation of every feature point with respect to the
PTZ-camera direction, Wang and Tsai [9] proposed a nonlinear angular mapping
method to conduct angular transformations between real-world space points and
acquired PTZ image points. The method is adopted for use in this study. It is reviewed
here at first.
First of all, we introduce the involved coordinate systems, as shown in Figure 3.1.
The image coordinate system (ICS) defined for PTZ-images is described by image
coordinates (u, v), and the spherical coordinate system (SCS) defined for the
real-world space is described by the space coordinates (
ρ
,θ
, φ). The SCS is a 3D polar coordinate system whose coordinates can be computed in terms of those of aalso the origin of the CCS, and the ij-plane of the CCS is parallel to the uv-plane of
the ICS. Reversely, the coordinates (i, j, k) of the CCS can be represented by the
coordinates (
ρ
,θ
, φ) of the SCS as well. Specifically, as illustrated in Fig. 3.1, a space point P with coordinates (i, j, k) in the CCS may transformed into a corresponding onein the SCS with coordinates (
ρ
,θ
, φ), whereρ
is the distance between point P and the origin S of the SCS;θ
is the longitude angle between the positive k-axis and the line from the origin S to point P projected onto the ik-plane, and φ is the latitude anglebetween the ik-plane and the line from the origin S to point P.
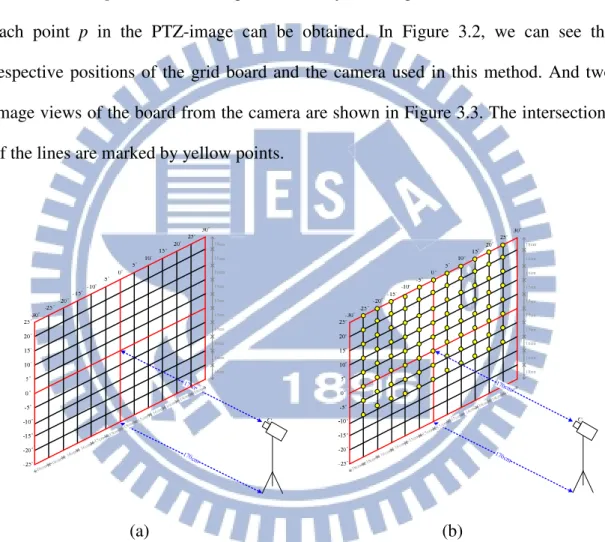
In order to calibrate the PTZ camera for the purpose of computing the longitude
and latitude angles of space points which appear in the acquired PTZ-image, a grid
board is used in this study. It has m vertical lines and n horizontal lines, and is
attached on a wall which is perpendicular to the ground. During the calibration
process, we measure the angles between the PTZ-camera direction and the lines from Figure 3.1 An illustration of transformation betweenimage coordinate system (ICS)
the camera to the intersection points in the grid board, so the longitude and latitude
angle values of all the intersection points can be known in advance. Then, we use an
interpolation method to compute the orientation
θ
of each non-intersection point p in the PTZ-image with respective to the PTZ camera direction. This orientationθ
is just the angle between the PTZ-camera direction and the line from the position of thePTZ-camera to p in the PTZ-image. In this way, the longitude and latitude values of
each point p in the PTZ-image can be obtained. In Figure 3.2, we can see the
respective positions of the grid board and the camera used in this method. And two
image views of the board from the camera are shown in Figure 3.3. The intersections
of the lines are marked by yellow points.
(a) (b)
Figure 3.2 Camera calibrations by a vertical grid board. (a) An illustration of attaching the lines on the wall. (b) The intersections seen by camera are marked by yellow points.
After knowing the longitude and latitude values of the non-intersection points in
the PTZ-image by nonlinear angular mapping, the PTZ-camera calibration work is
finally saved into a bmp image, like that shown in Figure 3.3(c).
(a) (b)
(c)
Figure 3.3 Camera views of Figure 3.2. (a) View of Figure 3.2(a). (b) View of Figure 3.2(b). (c) The bmp image with camera calibration information.
3.2.2
Conversion of PTZ-camera Coordinates into
Omni-camera Coordinates
The omni-camera coordinate system (OCCS) is regarded as the world coordinate
system (WCS) with coordinates (x, y, z), and the PTZ-camera coordinate system
(PCCS) as the SCS, in this study. However, we also have the PTZ-camera in the WCS;
therefore, in order to use the information of the PTZ-image coordinates integrally, we
scheme to convert the PTZ-camera coordinates into coordinates in the OCCS. In this
way, we can get the relative position between the omni-directional imaging device
and the PTZ-camera device easily.
In more detail, we use Figure 3.4 to show an illustration of the layout of the
video surveillance car roof where the distance between the omni-camera and the
PTZ-camera is obtained by manual measurement. The red circles in the layout are the
positions of the camera devices. Accordingly, if the front omni-camera device is
assumed to be located at the origin of the WCS, then the position of the PTZ-camera
device is (223, 0, 0). That is, the offset between the two devices is (223, 0, 0).
Figure 3.4 an illustration of the layout of the video surveillance car roof.
Furthermore, as shown in Figure 3.5, the practical field of view of the
omni-camera is limited. Nevertheless, even if a point P is too far from the practical
field of view of the omni-camera, we can still get it by the PTZ-camera. Therefore, we
have to convert the coordinates of the PCCS into corresponding ones of the OCCS.
Figure 3.5 The WCS used in this study which includes the SCS.
As shown in Figure 3.6, we can acquire the tilt angle
ϕ
c and the pan angleθ
cfrom the PTZ-camera device. The value
θ
c is the angle between the camera directionand the direction of the y-axis, and the value φc represents the vertical tilting angle of
the camera. The tilt angle
ϕ
and the pan angleθ
of a detected space point in a PTZ-image can be acquired through the calibration method mentioned previously.The distance D between the PTZ-camera and the detected point can be obtained by
manual measurement, and the distance
ρ
is the horizontal distance between the PTZ-camera and the detected point. Finally, we want to estimate the worldcoordinates (x, y, z), and the process we propose in this study is described as an
(a) (b)
(c) (d)
Figure 3.6 the angle between the detected point and the PTZ-camera (a) the PTZ-camera has a tilt angle of ϕc < 0 (b) the PTZ-camera has a tilt angle of ϕc > 0 (c)
the PTZ-camera has a pan angle of θc < 0 (d). the PTZ-camera has a pan angle of θc >
0
Algorithm 3.1: computing the world coordinates of a feature point.
Input: A feature point p captured by the PTZ-image and its distance D to the
PTZ-camera which is obtained manually in advance.
Output: The world coordinates (x, y, z) of the feature point in the PTZ-image.
Step 1. Calculation of distance
ρ
and height z ---Using thetilt angles
ϕ
c andϕ
, we can compute the distanceρ
and the height z in(a) if the
ϕ
c < 0 as shown in Figure 3.5(a), computeρ
and z by: cos( )ρ
=D×ϕ
c+ϕ
; (3.1) sin(ϕ
ϕ
) = × c+ z D ; (3.2)(b) if the
ϕ
c > 0 as shown in Figure 3.5(b), computeρ
and Z by:cos( )
ρ
=D×ϕ
c−ϕ
; (3.3)sin(
ϕ
ϕ
)= × c−
z D . (3.4)
Step 2. Calculation of x and y in the world coordinate system ---
Use the distance
ρ
and the pan anglesθ
c andθ,
compute the world coordinates xand y as follows:
(a) if
θ
c < 0 as shown in Figure 3.5(c), compute x and y by:sin( )
ρ
θ
θ
= × c− + x L; (3.5) cos( )ρ
θ
θ
= × c− + y K; (3.6)(b) if the
θ
c > 0 as shown in Figure 3.5(d), compute x and y by:sin( )
ρ
θ
θ
= × c+ + x L; (3.7) cos( )ρ
θ
θ
= × c+ + y K, (3.8)where the parameter L is the position of the PTZ-camera on the x-axis of the
WCS and K is the position of the PTZ-camera on the y-axis of the WCS, both
known in advance by manual measurement.
Using the above algorithm, we can get the world coordinates (x, y, z) of each
3.3
Creation of Guidance Map
3.3.1
Creation of Database for Guidance Map
The guidance map is important to the proposed augmented reality based
guidance system for use in tour guide driving. We have to navigate to visit the sites in
the guidance area precisely according to the guidance map, and monitor the entire
top-view guidance environment. A display of the guidance map proposed in this study
is designed to include various data, such as:
(1) the center points of landmarks which are labeled on the guidance map; (2) the feature points in the guidance area;
(3) the current position of the video surveillance car.
Landmarks are regarded as navigation points in this study. In order to recognize
the different landmarks, every landmark is assigned a label. We can use the labels of
landmarks to check the correct positions of detected landmarks and navigate in the
guidance area correctly. In the guidance map, we select a landmark to be the start
point of a guidance tour with the start label of 0.
On the other hand, feature points can be anything theoretically. However, in our
guidance system, we want to get the information of nearby buildings. So we choose
edge points of buildings to be our feature points, as mentioned previously. A user can
input the names of the selected feature points to the proposed system. Moreover, we
have designed a “learning GUI” for the user, which will be described in Section 3.3.2.
In addition, by using the camera devices, the position of a landmark can be computed.
Furthermore, we measure the distance between the PTZ-camera and each feature
point by hand, also mentioned previously. Accordingly, the position of feature points