行政院國家科學委員會專題研究計畫 成果報告
嵌入式網路通訊裝置評比技術與工具之研發--子計畫二:嵌
入式網路通訊裝置耗能評比基準與工具之研發(中心分
項)(2/2)
研究成果報告(完整版)
計 畫 類 別 : 整合型
計 畫 編 號 : NSC 99-2220-E-009-045-
執 行 期 間 : 99 年 08 月 01 日至 100 年 09 月 30 日
執 行 單 位 : 國立交通大學資訊工程學系(所)
計 畫 主 持 人 : 曹孝櫟
計畫參與人員: 碩士班研究生-兼任助理人員:陳冠中
碩士班研究生-兼任助理人員:郭宇宸
碩士班研究生-兼任助理人員:高至辰
博士班研究生-兼任助理人員:黃承威
博士班研究生-兼任助理人員:陳建臻
報 告 附 件 : 出席國際會議研究心得報告及發表論文
公 開 資 訊 : 本計畫可公開查詢
中 華 民 國 101 年 03 月 27 日
中 文 摘 要 : 本計畫的主要目的,在於設計與開發嵌入式網路通訊裝置之
系統層級耗電評估與評比之工具與標準測試流程及項目。不
同於傳統之實體量測工具或單純之 CPU 耗電評估工具,此工
具將可提供給系統發展者一個包含應用軟體耗電、作業系統
耗電、CPU 耗電,裝置與無線網路耗電等軟硬體耗電分析工
具,以提供系統發展者除錯與瞭解系統耗電問題,同時將開
發標準化測試工具、設計代表性之耗電效率參數,提供各種
系統之耗電評比。本計畫延續去年的研究成果,將行動終端
裝置之耗能剖析工具 PowerMemo,移植到 ITRI PAC Duo 嵌入
式平台,並且針對 Android 作業系統,進行耗能分析工具的
改良,能夠對各程序的 Dalvik 虛擬機器耗能做分析,並呈現
不同層級各程序的耗能結果給軟體開發者,提供軟體開發者
對其開發系統進行耗能的最佳化設計,進而達到減少軟體耗
能的成效。另外,我們加入了 Dynamic Instrumentation 的
技術,用以降低耗電資訊取樣時對整體效能的影響,並且將
原本修改核心的程式碼進行模組化的動作,增加耗能分析工
具對不同嵌入式平台移植的便利性,節省修改核心原始碼和
重新編譯等動作,只需要對剖析的嵌入式平台掛載核心模
組,即可在該平台上利用 PowerMemo 對各種軟體進行耗能分
析。
中文關鍵詞: 耗能剖析、耗能評比、嵌入式系統、行動通訊裝置、Android
英 文 摘 要 : In this project, we present architecture and
implementation of a measurement-based energy
profiling tool with software controllable wireless
environment for Android mobile devices, called
PowerMemo (power meter for mobile). The tool composes
of a software event profiler and power measurement
hardware to analyze the process-level and
function-level power consumption of Java programs on Dalvik
virtual machine. The control of signal attenuators
and RF-shielded chambers is also integrated to the
tool so that developers can emulate a real-life
mobility scenario that a mobile device may encounter.
The proposed tool overcomes the issue of power
consumption profiling of asynchronous I/Os and can
correlate energy consumption of I/O events with
software activities. This tool gives developers a
broader view of the software energy consumption and
network behavior so that the developers can optimize
the energy efficiency of their software by using the
tool.
英文關鍵詞: Energy Profiling、Energy Benchmarking、Embedded
System、Mobile Devices、Android
1. Introduction
Embedded mobile devices such as Android phone and Android pad are getting more and more popular recently. However, limitation of run-time due to battery capacity has turn into a problem for mobile devices. This limitation even becomes worse after the coming of the powerful mobile platform with multi-core CPUs and GPUs. Energy efficiency issues, then, have been increasingly important.
With the trend of cloud computing, complicated computation is usually accomplished by servers in cloud center. Wireless communication becomes more important than computation on mobile devices. On the other hand, many applications, which require for substantially wireless communication and human-computer interaction, intend to be I/O-intensive rather than CPU-intensive on mobile devices. Energy consumption of wireless interfaces such as 3G and WLAN and few other I/O components have been proved to be much crucial for the power consumption of mobile devices. In order to get much more detail and useful information of energy consumption on I/O devices, we, therefore, provide an energy profiling tool which focuses on I/O components for mobile devices.
Traditionally, energy profiling tools can be categorized into two approaches: simulation-based and measurement-based tools. We supply a measurement-measurement-based energy profiling tool. The measurement-measurement-based energy profiling tools instrument the target hardware and collect power measurements along with the profiling results. Accuracy of this kind of energy profiling tools is closely related with time synchronization between power measurement and system profiling, sampling rate of a measurement device, and type of data collected during profiling. One major problem that was criticized before is about demanding for an expensive and bulky measurement instrument. Nowadays, there have been relatively affordable, fast and portable digital signal and data acquisition cards with multiple measurement inputs, and the measurement hardware platform has been resolved.
In this project, the generic I/O energy profiling framework was proposed to associate power consumption with processes and functions, and to map the power consumption of asynchronous I/O activities with software functions. Thus, the proposed tool is able to indicate the I/O energy consumption at process level and/or function level, and provides visibility for the energy impact of software design choices. The proposed tool was implemented in the Android/Linux operating system running on a TI OMAP3/Beagle board platform [11]. In this tool, we implemented a two-layer-mapping technique within Dalvik virtual machine in order to evaluate the power consumption of Android applications.
Although wireless interfaces are considered as typical I/O devices like disks, the power consumption behavior of wireless interfaces is quite different from other I/Os. The distance between wireless interfaces and base stations or access points, channel contentions, noise and many other factors are significantly affect the transmission of packets and its power consumption. This exceptional I/O characteristic makes it quite a challenge to obtain a stable and
realistic energy consumption figure for a specific real-life wireless channel behavior. This problem may especially restrict developers from optimizing energy consumption and fine turning embedded software in a mobile environment. To tackle the challenge, our tool profiles energy consumption of applications while emulating the desired set of wireless channel behaviors in a controllable wireless environment.
The tool we proposed in this project makes three main contributions.
1. Provide a measurement-based energy profiling tool for Android application developers to develop energy-efficient software.
2. Propose a technique to map the power consumption of I/O devices to the asynchronous I/O events in Linux kernel and also to Android applications.
3. Emulate wireless environment so that developers can understand the power consumption behaviors of their software in real-life mobility scenarios.
2. Related Works
Many similar energy profiling tools exist. As the well-known representative of measurement-based tools,
PowerScope [1] uses a programmable multi-meter to statistically measure the total energy drained from the external
power source. It associates these measurements with active processes/functions of the measurement time. It has low accuracy because of measuring only total energy and using an external trigger mechanism to synchronize the time between the host and target. This low accuracy again limits usability for high energy optimization.
Another important example to the energy profiling tools that perform component-wise measurements comes from Xian et al. [2]. Their tool is the first one that assigns measurements of I/O operations to their initiator processes. Other tools either reported measurement results of I/O operations under a column called “interrupts” or did not consider them at all.This work also provides a more accurate synchronization method than the most common NTP or external triggering. However, the wireless network emulation and power consumption analysis in an emulated wireless environment were not yet been considered in their tool. .
In [3], the paper described the importance of energy efficiency of Android operating system. However, tools for Android mobile devices are still not common right now. In [4], Andrew Rice and Simon Hay provided a measurement framework for Android-based mobile devices. The main difference between our energy profiling tool and their tool is that they only offer a total energy of the executing application, but we show detailed energy
consumption of I/O software activities and the power consumption of software in process-level or function-level granularities.
An embedded system platform includes many I/O components, and a wireless interface is one of power-consuming and complex devices. Many factors impact the power consumption such as the packet size, the transmission rate, the RF power level, the distance of the wireless interface. Previous research considered various parameters to measure the wireless energy consumption [5][6][7]. However, very limited wireless environment emulation was used in the energy profiling. In our knowledge, noise from the environment and the distance between a mobile and base station both influence the results of the wireless energy consumption, but most of the former works ignored the effect of these factors [7]. Compared with laptops, hand held devices are often used in a changeable environment. The wireless environment emulation, therefore, shows the significance for the energy profiling.
Wireless environment simulation has been used for energy profiling on hand held devices [8]. Simulation, nevertheless, faces difficulties to interact with physical environment. Glenn Judd and Peter Steenkiste have presented a functional wireless emulator for few kinds of wireless behavior emulation [9]. We, then, first contribute to combine a complete emulation of heterogeneous wireless environment with the energy profiling of software.
3. Design and Implementation
Since the processes share hardware resources and operation of hardware resources consumes energy. The main purpose of this tool is to map energy consumption of I/O devices to corresponding software functions.
The functionality of the tool can be divided into two parts: the first part records the system activities by inserting kernel modules, and generates the system logs. The second part aims on logging the activities and I/O requests inside the Android Dalvik virtual machine [12].
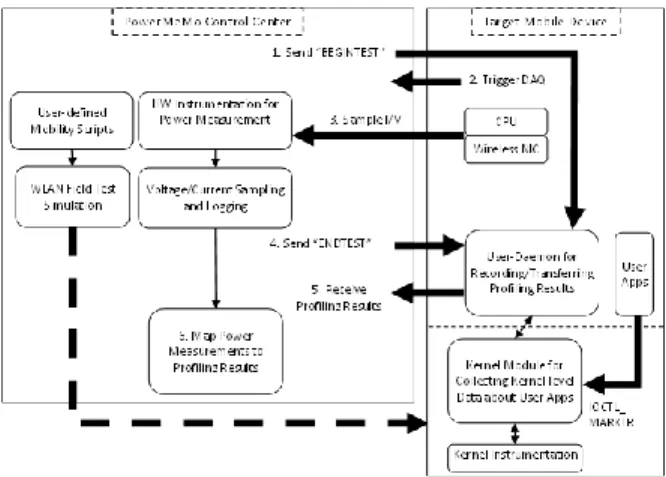
Figure 1. Operational overview.
3.1. System Architecture
As depicted in Figure 1, the tool consists of two different sets of hardware/software components, which could be categorized as target side components and host side components. The core of host side components is a graphical user interface (GUI) which act as a control center in our tool. The GUI is mainly responsible for collecting power measurement results from a data acquisition (DAQ) card, controlling the signal attenuator to emulate the mobile behavior in reality that user defined and mapping the power measurements with the results of target profiling to calculate the total energy for each system activity. The main component at the target side is the kernel module that provides the instrumentation functions to collect kernel level data logs. These functions basically store the time of system activities and some other necessary parameters. A user-space daemon keeps transferring these kernel level data from kernel-space to user-space as files, and periodically transfers these files to the host side for the mapping process. An operation overview of the tool can be seen in Figure 1 and system architecture in Figure 2.
Mobile Evaluation Board
TARGET Linux Kernel System Monitor As Kernel Module Profiling data to RAM NI DAQ Log to Disk Mobile Applications CPU WiFi WiFi Antenna RF Shielded Chamber Programmable attenuator WLAN AP LAN Et h er n et
Profiling Data I/V Log Time Sync(NTP)
G
P
IB
Energy Consumption Analyzer
E th e rn e t
Wireless Signal Calibration
Wireless Environment Emulator
Mobility Script Run Script
GUI
NTP Synchronization Data
Kernel Profiling Data
HOST Mea su rem en t D at a Result Et h er n et
WiFi Calibration Data
W iF i S ig n al
User Daemon/Patched Java Virtual Machine Et h er n et Programmable attenuator WLAN AP Programmable attenuator WLAN AP
Figure 2. System architecture of the proposed tool.
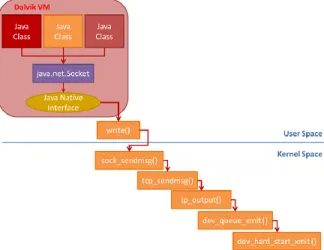
Figure 3. Mapping I/O activities in Java programs to Linux kernel through Java Native Interface.
3.2. I/O Energy Profiling
3.2.1. Java program mapping
Java programs use a mechanism called Java Native Interface (JNI) to transfer I/O requests to low-level system calls provided by the operating system. To record the I/O requests, the tool modified the Dalvik virtual machine [12] in order to trace all JNI operations triggered by the Java classes. When a JNI is called, the tool records the caller information together with the current time stamp. After that, it combines the result to the system logs generated to obtain the power consumption of Java programs. Figure 3illustrated the functionality of Java Native Interface and an example about how we can map a network socket operation in Java programs with the underlying system calls.
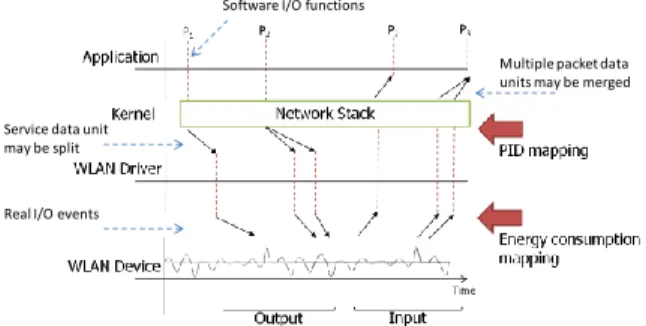
3.2.2. I/O behavior mapping
Figure 4 shows the I/O behavior between application levels and actual I/O events. The association of I/O events and applications could be one-to-one, many-to-one, and one-to-many mappings. Operating system may perform scatter and gather in order to optimize the I/O performance. For example, a service data unit generated by an application I/O function may be split into a number of packet data units sent to I/O devices. On the other hand, a number of packet data units may be received and merged into a service data unit to an application I/O function. According to the I/O behaviors, our tool inserts probes in kernel and drivers to link the I/O events to applications; it also inserts probe points inside the JNI entry point in order to track the I/O activities performed by Java program in Dalvik virtual machine [12]. The measurement-based approaches can refer to the profiling of I/O events to estimate energy consumption of I/O devices. After analyzing the collected profiling information, the related I/O events can
associate with process and Java classes. Finally, energy consumption of I/O events could correlate with the explicit process and Java programs.
One essential task on the host side GUI control center is to map, or correlate power measurements with system activities. After the test is finished, the user-daemon program transfers profiling results to host side. When the transfer ends, the energy consumption analyzer module in the control center analyzes the results file of system activities to check the process identify (PID) values that were collected during the test. Later on PID values are charged with energy values for both CPU and I/O peripherals activities. Figure 4 illustrates this analyzing process.
Software I/O functions
Service data unit may be split
Multiple packet data units may be merged
Real I/O events
Figure 4. Correlating energy consumption with system activities.
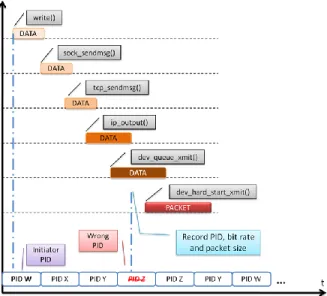
3.2.1. Asynchronous I/O problem
A duration value (∆t) is the key to calculate the power consumption of a system activity, but is insufficient to charge a correct process. We also have to identify the processes that are responsible for the energy consumed during a period. Achieving this for CPU is as simple as reading the task data structure, but generally for I/O components, it is more complicated due to the asynchronous nature of I/O operations. As illustrated in Figure 5, when a process writes data to a socket, this data travels down through the layers of kernel’s network stack and finally reaches the device driver as a packet data unit. At some time during this flow, when we sniff the packet when is formed, the current active process may have already been changed by kernel scheduler. If we simply record the current PID at this time, we may incorrectly identify the initiator of this system activity. To solve this problem for wireless I/O devices, we have added one more item, PID, to the socket data structure. When we record the time values for a packet, we simply access this item through the packet’s socket structure.
Figure 5. Asynchronous I/O problem.
3.3. Wireless Environment Emulator
Emulating wireless environment is achieved by using few wireless signal attenuators, RF-shielded chambers, and signal mixers. Developers can easily configure the location of each base stations or access points and the draw a mobility path of the target mobile device. Our current system only supports multiple WLAN APs shown in Figure 6 but the architecture can be further extended to support different wireless access technologies such as 3G, etc.
…… AP with shielded box Signal mixer Controllable attenuator Mobile device with shielded box
Figure 6. Wireless emulation with multiple access points. 3.3.1. WLAN channel model
A Wireless LAN channel model is employed to calculate the signal attenuation caused by the movement of a mobile device under test. Depending on the distance between the AP and mobile device, attenuator is set to a particular attenuation value. The mobile device gradually senses the attenuation as if it is moving away/close from/to
wireless AP. The channel model is shown below [10]. The channel model depends on the distance d from the target mobile device to the access point. n is the environment constant( between 1.6 and 5), and LOS is the signal attenuation that a mobile device can sense.
LOS(d) = 40.22 + 10n log(d)
3.1.2. Multiple homogenous and heterogeneous base stations or access points
The purpose for emulating multiple homogenous and heterogeneous base stations or access points is to evaluate the power consumption of a mobile device during handover or in mobility scenario in a homogenous and heterogeneous wireless environment. The GUI program on the host provides a registration form and a graphical control panel. Every new base station or access point needs to be registered first to the system before using. After registering, the GUI allows a user to easily drag their items on the panel to set up the location of each access point and target device, and then draw the path for the move track. After configuration, user starts to profile energy consumption through wireless network emulation.
4. Experiments and Results
4.1. Experiment Setup
We use Beagleboard [11] as our embedded platform, and measure both voltage and current of each I/O component by using a National Instruments PCI-6115 data acquisition board with voltage probes and current clamps. In order to get measurement point from WLAN interface, we choose a D-Link DWL-G122 USB Wireless NIC [14], rather than the WiFi module on Beagleboard. The wireless environment emulator is constructed with E-INSTRUMENT EPA-400BMG programmable attenuators [15], ANGLETON RF shielded boxes and D-Link DIR-600 wifi APs and connect to the host with an NI PCI-GPIB Interface card [16]. Figure 7 demonstrates the whole profiling system.
Mobile device Embedded evaluation board digital meter Control center RF Shielded Chamber Programmable attenuator BS emulator
Figure 7. Demonstration of the proposed power profiling system.
4.2. Experiments Result
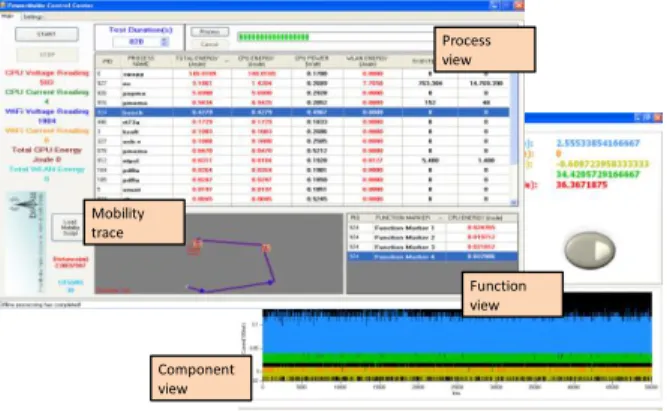
We tested our energy profiling tool by measuring the energy of a simple email client application. In this test case, it connects to an email server on internet and receives one email with a 10MB attachment. Results are listed in a tabular format like in Figure 8.
In our experiments, we used a simple mobility script shown in Figure 8. As can be seen, the embedded mobile device moves around a wireless AP. Unmodified version of a email client does not observe the wireless signal level. It immediately begins to download the email. On the other hand, our modified version of the email client periodically observes wireless signal levels to receive the email at the highest bit rate possible. If the WLAN signal level is below a certain threshold (-82dBm), it sleeps for a while. When it detects the level is above the threshold, it begins to download the email at a high bit rate. In total, we ran 20 sets of experiments and compare the unmodified and modified versions of the email client. Our experimental results demonstrate that about 30% energy consumption can be reduced but additional 380 seconds delay for email downloads is introduced. The case study shows that the proposed tool is useful and practical in optimizing software energy consumption.
Component view Process view Function view Mobility trace
Figure 8. The GUIs displaying energy profiling results for each process, function, and mobile mobility path.
5. Conclusions
In this project, we introduced our measurement-based energy profiling tool with software controllable wireless environment. This tool is capable to profile the power consumption of Java programs on Dalvik virtual machine [12] at process-level and function-level granularities, and to correlate energy consumption of I/O events to software functions. The tool was verified and implemented on the Beagleboard platform [11] with the Android system. The process-level and function-level energy reports enable developers to optimize energy consumption of their software.
During the three years project period, we have published 5 international journal papers, 9 international conference papers, and 4 patents. We also had 6 cooperation projects with industries vendors such as Industrial Technology Research Institute and MediaTek Inc. 2 technologies transfer/NTD 3,000,000 contracts had been signed under this project. We have also demonstrated our proposed energy profiling tool in world top conferences such as ACM MobiCom 2011 and ACM EMSOFT 2011. A number of student competition and paper awards such as 財團法人中 華民國資訊學會 2011 年碩博士最佳論文獎佳作, 國科會大專學生參與專題研究計畫研究創作獎, 九十九學年 度教育部補助大學校院嵌入式系統競賽創意應用組特優, 中國工程師學會學生分會工程論文競賽資訊組特優 獎, 教育部九十九學年度大學校院網路通訊軟體與創意應用競賽手機應用組第一名 are received.
6. References
[1] J. Flinn, and M. Satyanarayanan, “PowerScope: A tool for profiling the energy usage of mobile applications,” in
Proceedings of the 2nd IEEE Workshop on Mobile Computing Systems and Applications, 1999.
[2] Changjiu Xian, Le Cai, and Yung-Hsiang Lu, “Power Measurement of Software Programs on Computers With Multiple I/O Components,” IEEE Transactions on Instrumentation and Measurement, Vol. 56, pp. 2079-2086, 2007.
[3] K. Paul and T.K. Kundu, “Android on Mobile Devices: An Energy Perspective,” IEEE 10th International Conference on
Computer and Information Technology , 2010.
[4] A. Rice, and S. Hay, “Decomposing power measurements for mobile devices,” IEEE International Conference on Pervasive
[5] J. Ebert, B. Burns and A. Wolisz, “A trace-based approach for determining the energy consumption of a WLAN network interface,” in Proceedings of European Wireless, pp. 230-236, Feb. 2002.
[6] J.-P. Ebert, Stephan Aier and G. Kofahl, “Measurement and Simulation of the Energy Consumption of a WLAN Interface,”
TKN Technical Reports Series, June 2002.
[7] L.M. Feeney and M. Nilsson, “Investigating the energy consumption of a wireless network interface in an ad hoc networking environment,” in Proceedings of the Twentieth Annual Joint Conference of the IEEE Computer and Communications Societies, 2001.
[8] Mark STEMM and Randy H. KATZ, “Measuring and Reducing Energy Consumption of Network Interfaces in Hand-Held Devices,” IEICE Transactions on Communications, Vol. E80-B, No.8, pp.1125-1131, Aug.1997.
[9] Glenn Judd and Peter Steenkiste, “Using emulation to understand and improve wireless networks and applications,” in
Proceedings of the 2nd conference on Symposium on Networked Systems Design & Implementation, Vol. 2, 2005.
[10] T. S. Rappaport, Wireless communications principles and practices, Prentice-Hall, 2002. [11] “beagle board-xM platform,” http://beagleboard.org/
[12] http://developer.android.com/index.html
[13] “NI PCI-6115 DAQ Card”, http://sine.ni.com/nips/cds/view/p/lang/en/nid/11886
[14] “D-Link DWL-G122 USB Wireless NIC - FW Version 3.0”, http://www.dlink.com/products/?pid=334
[15] “ EPA-400 Programmable Attenuator”,
http://e-channel.com.tw/zencart/index.php?main_page=product_info&products_id=1175
表 Y04
行政院國家科學委員會補助國內專家學者出席國際學術會議報告
2011 年 09 月 01 日
報告人姓名
曹孝櫟
服務機構
及職稱
交通大學資訊工程系
時間
會議
地點
葡萄牙
波多
本會核定
補助文號
NSC 99-2220-E-009-045
會議
名稱
(中文) 第二屆嵌入式與即時系統分析工具與技術國際學術研討會
(英文) 2nd International Workshop on Analysis Tools and
Methodologies for Embedded and Real-time Systems
發表
論文
題目
(中文) 以硬體協助之多核心嵌入式系統耗電分析工具
(英文) Hardware-Assisted Energy Consumption Evaluation Tool for
Multi-core Embedded Systems
附
件
三
表 Y04