國立交通大學
材料科學與工程學系
奈米科技博士班
博士論文
應用奈米結構表面探討細胞介面的貼附行為與
功能性表現
Application of nanostructured interface to estimate the cell behaviors
and functional expression for biomedical engineering
研究生: 潘叙安
指導教授: 黃國華 教授
應用奈米結構表面探討細胞介面的貼附行為與
功能性表現
Application of nanostructured interface to estimate the cell behaviors
and functional expression for biomedical engineering
研究生: 潘叙安 Student: Hsu-An Pan
指導教授: 黃國華 教授 Advisor: Guewha Steven Huang
國立交通大學
材料科學與工程學系奈米科技博士班
博士論文
A Thesis
Submitted to Graduate Program for Nanotechnology
Department of Materials Science and Engineering
College of Engineering
National Chiao Tung University
In partial Fulfillment of the Requirements
For the Degree of
Doctor of Philosophy
in
Materials Science and Engineering
June 2012
Hsinchu, Taiwan, Republic of China
I
摘要
在細胞生長的過程中,細胞本身具有感知外在各式各樣的化學或物理信號並 整合與分析這些外在環境訊息的能力,進而改變其細胞形態及生長行為模式。此 外大多數細胞於偵測環境表面適於生長後,則開始進行貼附行為並表現該細胞的 生長模式與型態變化,因此對於細胞貼附基質的特性研究將是發展細胞工程中重 要的一環。目前在仿生基材的研究成果已廣泛應用於醫學領域,而最近的研究報 告指出,微米結構化的表面具有模仿天然細胞外基質的特性,能夠促進細胞生長 和分化,但細胞外基質是由微米與奈米結構所交織組成的天然結構表面,而目前 細胞對奈米結構的反應與行為機制仍處於摸索階段。為了進一步研究微米級細胞 對於奈米級結構表面的感知與行為反應,本研究利用直徑從10到200奈米的奈米 點陣列探討各式不同類型的細胞型態與行為,以評估細胞對奈米尺度的反應。奈 米點陣列以陽極氧化鋁為模板,製造於鍍上TaN的矽晶圓上,並濺鍍約 5奈米厚 的白金層以提供一個同質性與良好的生物相容性表面。 為了探討微米級細胞與奈米級基材之間的作用反應,我們將觀察細胞如何透 過貼附奈米結構基材,並展現其生長型態的變化與胞內的功能機轉,本研究中分 為四個部分: 本論文研究第一部分主要探討利用系統化的奈米尺度點陣列,範圍從10奈米 到200奈米的奈米點陣列,探討3T3纖維母細胞貼附行為與生長條件。我們發現 以奈米點陣列的基材表面可能會誘導3T3纖維母細胞異常的凋亡。異常的細胞形 態在培養於200奈米的點陣列24小時候被觸發,細胞自本體延展的偽足數目明顯 的減少。在利用纖維連接蛋白與第一型膠原蛋白預塗層處理後,則可以有效預防 奈米拓樸結構所引發的程序性細胞死亡,因此奈米結構觸發細胞異常凋亡的調控 程序主要是透過Focal adhesion的形成。 在本論文研究的第二部分,利用Cardiomyoblast (H9c2)培養於直徑介於10和 200 nm的奈米點陣列上進行觀察。我們發現H9c2細胞在50奈米的奈米點陣列上II 具有廣泛的偽足延展與面積分佈,並具有極佳的增生能力。相對於大尺寸奈米點 陣列,100奈米與200奈米則減少了53.7%和72.6%的細胞增生數目,並生成較少 的貼附蛋白與細胞骨架。而細胞纖維化和心肌肥大相關基因在培養於100奈米的 細胞基因表現分析中則具有顯著的提升,此外,在胞內蛋白質分析中,培養於50 奈米的細胞則具有大量Vinculin與PAI-1蛋白表現。根據這些分析結果我們可以藉 由調整奈米點的直徑,調節Cardiomyoblast的增生與相關功能性基因及蛋白質的 表現。 在本論文的第三部分,我們運用分析系列尺度的奈米點結構對於成骨細胞在 體外培養的反應,以提供牙根植體表面優化的策略與設計依據。在體外培養分析 中,利用直徑範圍從10奈米到200奈米的點陣列進行對類成骨細胞(MG63)的細胞 活性,自體凋亡,貼附行為以及細胞骨架組成進行評估。我們發現50奈米點陣列 相對於平面結構增加了44%的細胞活性,減少2.7%細胞凋亡程度,並促進30% 的肌動蛋白纖維束增長,同時增加了73%的細胞貼附程度,此外也加強了約50% 的細胞礦化程度。在本研究中,我們應用類成骨細胞模型系統可以評估出最佳的 奈米點結構表面,有利於改善牙根植體表面的設計以達到最佳的生物相容性。 在本論文的最後一部分,我們製備了一個具有快速分析並調控癌細胞的增生, 凋亡,侵襲能力以及胞內骨架重組的奈米表面平台。透過從一個平面至10奈米, 50奈米,100奈米和200奈米點陣列所組成的奈米點矩陣,我們能夠有效區分出子 宮頸癌細胞HeLa與較後期的C33A的細胞侵襲能力。在各類型的卵巢癌細胞株 (ES2, PA-1, TOV-112D, TOV-21G)體外培養分析中,癌細胞本身的類型與相關
期數也表現出相對差異性的生長模式。因此透過簡單與低成本的製造過程,我們
所建製的奈米點矩陣平台可有效用於評估各類型細胞生長的基本特徵,並能夠區 分不同期數與類型的癌細胞,同時也可以提供人工植入物的基本設計參數,因此 本研究中的奈米點陣列平台將可作為一個方便且快速的癌症檢測工具。
III
Abstract
Cells sense and respond to a wide range of external signals, both chemical and physical. Extra-cellular information penetrates cell membrane, transmits through cytoskeleton, affects muscle genes expression, and alters the cytoskeleton organization. Eventually, cell morphology is changed leading to better growth or death. The modification of biomimetic substratum has been wildly used to study the effects of bio-nano interface on cell adhesion and subsequent growth and function. Micro-structures direct cell migration; however the cellular response to nanostructures is yet to be explored. In the current study, nanotopology is defined by nanodot arrays with dot diameters ranging from 10 to 200 nm. The nanodot arrays were fabricated by AAO processing on TaN-coated wafers. A thin layer of platinum, 5 nm in thickness, was sputtered onto the structure to provide a well biocompatible and homogeneous surface.
The defined nanostructures utilized in this study significantly facilitate our understanding of cell-nanosubstratum interactions. Our results were separated into four sections in this dissertation.
In the first part of this dissertation, nanodot arrays ranging from 10 nm to 200 nm were utilized to study the cellular adhesion behavior and growth condition in 3T3 fibroblasts. We found nanotopography, in the form of nanodot arrays, induced an apoptosis-like abnormality for cultured 3T3 fibroblast cells. Abnormality was triggered after as few as 24 hours of incubation on a 200 nm dot array. The number of filopodia extended from the cell bodies was lower for the abnormal cells. Pre-coatings of fibronectin or collagen type I promoted cellular anchorage and prevented the nanotopography-induced programmed cell death. The occurrence of the abnormality was mediated by the formation of focal adhesions.
IV
In the second part of this dissertation, the cardiomyoblasts H9c2 were cultured on nanodot arrays. On the 50 nm nanodot arrays H9c2 showed maximum attachment and proliferation with largest cell area and extended lamellipodia. In contrast, 53.7% and 72.6% reductions of growth were observed on the 100- and 200 nm nanodot arrays. Immunostaining indicated that nanodots smaller than 50 nm induced cell adhesion and cytoskeleton organization. Expression of genes associated with fibrosis and hypertrophy was up-regulated in cells grown on 100 nm nanodots. The analysis of protein expression showed high levels of expression for vinculin and plasminogen activator inhibitor-1 for cells cultured on 50 nm nanodots. By adjusting the diameter of the nanodots, we could modulate the growth and expression of function-related genes and proteins in cardiomyoblasts.
In the third part of this dissertation, a strategy was proposed for the topologic design of dental implants based on the in vitro survey of optimized nanodot structures. An in vitro survey was performed using nanodot arrays with dot diameters ranging from 10 nm to 200 nm. Cell viability, apoptosis, cell adhesion, and cytoskeletal organization of MG63 osteoblasts were evaluated. Nanodots with a diameter of approximately 50 nm enhanced 44 % cell viability, minimized apoptosis to 2.7 %, promoted 30 % increase in actin filament bundles, and maximized cell adhesion with a 73 % increase in focal adhesions. Enhancement of ~50 % in mineralization was observed. We showed optimization for the biocompatibility of dental implants using nano-structures/MG 63 osteoblasts model system, providing a topologic approach beneficial for the design of dental implants.
In the last part of this dissertation, different sizes of nanodot arrays were integrated into a nanodevice for rapid modulation of proliferation, apoptosis, invasive ability, and cytoskeletal reorganization for cancer cells. The nanodevice composed of a matrix of nine nanodot arrays ranging from a flat surface to 10 nm, 50 nm, 100 nm,
V
and 200 nm arrays. The invasive ability of HELA versus later-staged C33A cells was distinguished. Ovarian cancer cell lines (ES2, PA-1, TOV-112D, and TOV-21G) exhibited differential growth parameters that are associated with cell type, grade, and stage. We have established a platform that can be used to assess basic parameters of cell growth. The device is capable of distinguishing among cancer cell lines at various stages and also provides basic design parameters for artificial implants. Our device will serve as a convenient and fast tool for tissue engineering and cancer treatment.
VI
致謝
阿潘哥~終於沒有成為宅男,順利畢業囉!! 交通大學!!我作夢都沒想到我會有機會到這裡完成我的博士學位,首先非常感謝 黃國華老師提供我最大的幫助以及最重要的建議與指導,讓我能夠更深入了解科 學的涵意與研究的精神,讓我能在如此豐富資源的環境下專心完成我的論文。實 驗過程雖然一路上跌跌撞撞,但多虧有師母洪孟燕 女士積極的指導與照顧,讓 我在生活規劃與為人處事方面精進許多,也得以順利完成這本論文,也才能有今 日的 Dr.潘。此外非常感謝實驗室大大小小的夥伴們,大勳學長與阿亮老師謝謝 你們讓我學到如何維持互動的帶人技巧與實驗設計邏輯。另外,實驗室所有的弟 弟妹妹們,超級感謝你們這些日子無論在實驗或生活上給予我許多的幫助,以及 傾聽我一張嘴的碎碎念,陪伴我走過無數的低潮期,並帶給我許多歡樂的回憶, 我想沒有你們,我的博士班生活是黑白的,敬大家~我的保肝丸!!讓我有如此酸 甜苦辣、永生難忘的彩色人生。最後感謝口試委員陳俊勳院長、歐陽盟教授、吳 啟瑞教授、林立偉教授對我論文的審閱與意見指導。 老爸~老媽~你兒子畢業啦!! 感謝你們生了一個我這樣的兒子,我很滿意你們給我的基因~MAGIC!,這些年讓 你們操心了,還得時常容忍我因壓力而造成的情緒化脾氣,爸媽、老姊 ~謝謝你 們 ^ε^ 叙安 謹誌 2012.06.26VII TABLE OF CONTENTS 中文摘要...I 英文摘要...III 致謝...VI 1 Introduction ... 1
1.1 Micron-scale surface topography ... 1
1.2 Biomimetics and nanotopography ... 2
1.3 Nanotopography alters cellular responses ... 3
1.4 Application of nanotopologic surface for implant ... 5
1.4.1 Design of stent for cardiovascular implant ... 5
1.4.2 Design of dental implant for osseointegration ... 6
1.5 Survey and control of cell behaviors by nanotopography ... 7
2 Materials and methods ... 9
2.1 Fabrication of nanodot arrays ... 9
2.2 Cell cultures ... 9
2.3 Measurement of cell attachment by cell density ... 10
2.4 Scanning electron microscopy (SEM) ... 10
2.5 Immunostaining ... 11
2.6 Bromodeoxyuridine (BrdU) proliferation assay ... 11
2.7 Caspase-3 activity assay ... 11
2.8 Quantitative real-time PCR ... 12
2.9 Western blot ... 14
2.10Dental implant ... 14
2.11von Kossa staining ... 15
2.12Alizarin Red S staining ... 15
2.13Statistics ... 15
3 Results and discussion ... 16
3.1 Fabrication of nanodot arrays ... 16
3.2 Nanodot array modulates cell adhesion and induces an apoptosis-like abnormality in 3T3 fibroblast ... 17
3.2.1 Cell response to nanodot arrays ... 17
3.2.2 Nanotextured surface triggers apoptosis-like events of fibroblasts ... 20
3.2.3 Cell adhesion and reorganization of the cytoskeleton were required for the nanotopography-induced cellular abnormality... 21
3.3 Topographic control of the growth and function of cardiomyoblast H9c2 cells using nanodot array ... 26
VIII
3.3.1 Cell attachment and proliferation of cardiomyoblasts grown on arrays of nanodots ... 26 3.3.2 Nanotopography-modulated morphology of cardiomyoblasts ... 29 3.3.3 Cell adhesion and cytoskeletal organisation of cardiomyoblasts ... 32 3.3.4 Expression of genes associated with cardiovascular function in cardiomyoblasts grown on
varied nanotopographies ... 34 3.3.5 Western blotting and confirmation of the topological control of PAI-1 and vinculin
expression ... 37 3.4 Optimization for the biocompatibility of dental implants using nano-structures/MG 63 osteoblasts
model system ... 39 3.4.1 The topology controlled the viability, apoptosis, and adhesion of MG63 osteoblasts ... 39 3.4.2 The mineralization of MG63 cells was associated with the nanotopology ... 44
3.5 A nanodevice for rapid modulation of proliferation, apoptosis, invasive ability, and cytoskeletal reorganization in cancer cells ... 53 3.5.1 Assessment of proliferation, apoptosis, cell adhesion, and cytoskeleton reorganization for
cancer cell lines ... 53
4 Conclusions ... 67
4.1 Nanodot array modulates cell adhesion and induces an apoptosis-like abnormality in 3T3 fibroblast ... 67 4.2 Topographic control of the growth and function of cardiomyoblast H9c2 cells using nanodot
array ... 68 4.3 Optimization for the biocompatibility of dental implants using nano-structures/MG 63 osteoblasts
model system ... 69 4.4 A nanodevice for rapid modulation of proliferation, apoptosis, invasive ability, and cytoskeletal
reorganization in cancer cells ... 69
5 References ... 71
IX
LIST OF TABLES
Table 1 Primer sequences ... 12 Table 2 Summary for the optimal size of nanodots and relative improvements derived from the in vitro
survey of nanotopography ... 46
Table 3 Characterization of the surface structures and chemistry for dental implants ... 49 Table 4 The duration of stabilization for individual dental implant in patients receiving multiple
implants ... 52
Table 5 Characterization of cell lines used in the current study ... 54 Table 6 VD50 , AD50 , FD50 and CD50 of cell lines employed in the current study ... 67
X
LIST OF FIGURES
Figure 1 Fabrication of tantalum-based nanodot arrays using AAO processing. (A) Schematic
representation of fabrication procedure. (B) SEM images of the fabricated nanodot arrays. (C) AFM images of the fabricated nanodot arrays. Images are arranged from left to right: unprocessed silicon (Si), 10 nm nanodot array (10 nm), 50 nm nanodot array (50 nm), 100 nm nanodot array (100 nm), and 200 nm nanodot array (200 nm). ... 17
Figure 2 SEM images of cells seeded on the nanodot arrays. NIH-3T3 cells were seeded on a flat
silicon surface, 10 nm nanodot array (10 nm), 50 nm nanodot array (50 nm), 100 nm nanodot array (100 nm), and 200 nm nanodot array (200 nm). The cells were harvested at 24 hr (Day 1), 48 hr (Day 2), 72 hr (Day 3), and 96 hr (Day 4) after seeding. SEM images were taken. Representative images are shown: (A) top view, (B) side view. ... 19
Figure 3 Apoptosis occurred in cells cultured on nanodot arrays. (A) The percentage of cells with
abnormal morphology calculated from SEM images. Bars depict percent apoptotic cells grown on the flat silicon surface (grey), 10 nm nanodot array (vertical line), 50 nm nanodot array (empty), 100 nm nanodot array (horizontal line), and 200 nm nanodot array (filled). (B) Caspase-3 activity for cells cultured 96 hrs on the nanodot arrays. Values were averaged from 6 sets of independent experiments and were expressed as mean value ± standard deviation. ... 20
Figure 4 SEM images of the used nanodot arrays. Nanodot arrays of 100 nm and 200 nm were
cleaned and washed thoroughly after culturing cells. SEM images were taken on the cleaned nanodot arrays of (A, B) 100 nm and (C, D) 200 nm. ... 21
Figure 5 SEM images of NIH-3T3 cells cultured on nanodot arrays to show the filopodia extended
from cells. Typical the cells were shown to elicit the detail of cellular structure. ... 22
Figure 6 SEM side-view images showing the poor cell attachment of NIH-3T3 cells grown on the
100 nm nanodot array. ... 23
Figure 7 Effects of BSA-, FN-, and type I collagen-coating on the nanotopography-induced
apoptosis-like abnormality. Cells were seeded on 100 nm nanodot arrays and flat wafers pretreated with BSA-, FN-, and type I collagen. Cells were harvested on day 4. SEM was performed to visualize the morphology of the cells (A). Apoptosis-like events occurred were quantified by the caspase-3 activity assay (B). ... 24
Figure 8 Immunostaining to show organization of actin filament and distribution of vinculin in
cells cultured on 10 nm, 50 nm, 100 nm, and 200 nm nanodot arrays and on flat surfaces. Cells were seeded on the arrays for 96 hours before harvest. The sample was incubated with anti-vinculin antibody (properly diluted in 0.5 % BSA) and phalloidin, followed by incubating with Alexa Fluor 488 goat anti-mouse antibody. ... 25
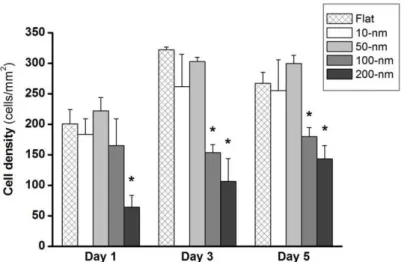
Figure 9 Time course experiments to determine the dependence on nanotopography of cell density
of H9c2 cardiomyoblasts. Cardiomyoblasts seeded on nanodot arrays of various sizes were harvested after 1, 3, or 5 days culture. Bar chart of cell density versus different sizes of nanodots. Cells were double-stained using DAPI and phalloidin. Cell density was calculated based on cell
XI
number counts. The mean ± SD from at least 3 experiments is shown. *p<0.05 when compared with flat control surfaces. ... 27
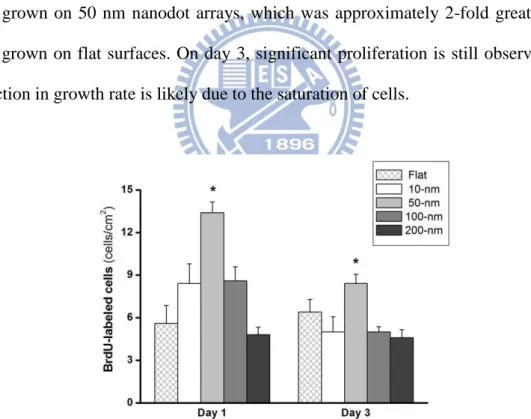
Figure 10 Time course experiments to determine the dependence on nanotopography of cell
proliferation of H9c2 cardiomyoblasts. Cardiomyoblasts seeded on nanodot arrays of various sizes were harvested after 1 and 3 days culture. Bar chart of proliferation versus dot size. Cells were incubated with BrdU and stained with a mouse anti-BrdU monoclonal antibody for 6 hours and subsequently examined under a fluorescence microscope. Newly proliferated cells were also counted. The mean ± SD from at least 3 experiments is shown. *p<0.05 when compared with flat control surfaces. ... 28
Figure 11 Morphology of H9c2 cardiomyoblasts cultured on nanodot arrays using SEM. H9c2 cells
are grown on flat, 10-, 50-, 100-, and 200 nm nanodot arrays for either 1, 3, or 5 days. High magnification SEM images (Hi-Mag) show lamellipodia present in cells cultured on flat, 10-, 50-, 100-, or 200 nm nanodot arrays for 3 days. Scale bar = 10 μm. ... 30
Figure 12 Time course experiments to determine the dependence on nanotopography of cell
spreading area of H9c2 cardiomyoblasts. Cardiomyoblasts seeded on nanodot arrays of various sizes were harvested after 1, 3, or 5 days culture. Plot of cell spreading area versus dot size. Cell spreading area was determined using SEM images of 50 cells per condition. The mean ± SD from at least 3 experiments is shown. *p<0.05 when compared with flat control surfaces. ... 31
Figure 13 Immunofluorescent staining shows distribution of vinculin (green) and actin filament
(red) in H9c2 cells cultured on nanodot arrays. H9c2 cells were seeded on flat, 10-, 50-, 100-, and 200 nm nanodot arrays for 1, 3, or 5 days. Scale bar = 50μm. ... 33
Figure 14 qPCR of genes associated with heat shock in H9c2 cardiomyoblasts. H9c2 cells were
cultured on flat, 10-, 50-, 100-, and 200 nm nanodot arrays for 3 days before qPCR was performed. The mean ± SD from at least 3 experiments is shown. *p<0.05 and **p<0.01 when compared with flat control surfaces. ... 35
Figure 15 qPCR of genes associated with apoptosis in H9c2 cardiomyoblasts. H9c2 cells were
cultured on flat, 10-, 50-, 100-, and 200 nm nanodot arrays for 3 days before qPCR was performed. The mean ± SD from at least 3 experiments is shown. *p<0.05 and **p<0.01 when compared with flat control surfaces. ... 36
Figure 16 qPCR of genes associated with hypertrophy, and fibrosis in H9c2 cardiomyoblasts.
H9c2 cells were cultured on flat, 10-, 50-, 100-, and 200 nm nanodot arrays for 3 days before qPCR was performed. The mean ± SD from at least 3 experiments is shown. *p<0.05 and **p<0.01 when compared with flat control surfaces. ... 37
Figure 17 Protein expression of H9c2 on nanodot arrays (a) Western blots analysis of vinculin and
PAI-1 for H9c2 cells cultured on nanodot arrays. Cardiomyoblasts were collected after 3 days culture. (b) Relative density of vinculin expression versus nanodot size. (c) Relative density of PAI-1 expression versus nanodot size. The densitometric analysis of each band was performed and relative density calculated using expression of GAPDH as a control. The mean ± SD from at least
XII
3 experiments is shown. *p<0.05 when compared with flat control surfaces. ... 38
Figure 19 Vinculin (green), actin filament (red), and cell nucleus (blue) high magnification
fluorescence image of MG63 cells after 3 days culture on 50 nm nanodot array. Cells exhibited well-defined actin filaments and focal adhesion with vinculin in the cytoplasm. ... 41
Figure 20 The cell viability versus dot diameters for cells cultured on nanodot arrays. Cells were
cultured on the nanodot arrays for 3 days. The percentage values relative to the cells that were cultured on a flat surface (0 nm) were calculated and plotted against the nanodot diameter. ... 42
Figure 21 The apoptosis-like events versus dot diameters for cells cultured on nanodot arrays. Cells
were cultured on the nanodot arrays for 3 days. The percentage values relative to the cells that were cultured on a flat surface (0 nm) were calculated and plotted against the nanodot diameter. ... 43
Figure 22 The microfilament bundles versus dot diameters for cells cultured on nanodot arrays.
Cells were cultured on the nanodot arrays for 3 days. The percentage values relative to the cells that were cultured on a flat surface (0 nm) were calculated and plotted against the nanodot diameter. 43
Figure 23 The focal adhesions versus dot diameters for cells cultured on nanodot arrays. Cells were
cultured on the nanodot arrays for 3 days. The percentage values relative to the cells that were cultured on a flat surface (0 nm) were calculated and plotted against the nanodot diameter. ... 44
Figure 24 Phosphate ion precipitation to detect the mineralization of cultured MG63 cells using
von Kossa staining. A correlation between the mineralization and the size of the nanodot arrays was observed. The optimal size was obtained at 46.3 nm with a maximal calcium deposition of 54.5 %. ... 45
Figure 25 The mineral calcium deposition of cultured MG63 cells visualized with Alizarin Red S
staining. MG63 cells were seeded onto nanodots and grown for 7 days. (a) Flat, (b) 10 nm, (c) 50 nm, (d) 100 nm, (e) 200 nm. The correlation between the degree of mineralization and the size of the nanodot arrays was observed. The relative mineralization is calculated relative to that of a flat surface. The optimal size was obtained at 46.7 nm, and the maximal calcium deposition degree is 44.6 %. ... 46
Figure 26 The dental implants and their surface structures. On the left are photographs of 4 types of
dental implants. The corresponding SEM images show the micro-(8,000X) and nano-(100,000X) structures of the dental implants. ... 48
Figure 27 SEM images for MG63 cells grown on dental implants. The cells were grown on
implants for 7 days and then harvested. The morphology of the cells indicated healthy growth for Implant B. The cell morphology in Implant A indicated apoptosis-like growth. ... 50
Figure 28 The stabilization time of the dental implants. Y-axis depicts days of stabilization for
corresponding implants. Patients are divided into nonsmoker (blank bars) and smoker (filled bars) groups. The number in the paranthesis indicates number of implants in the same group. Mean values of stabilization time is shown. Error bars represent standard deviation. ... 52
Figure 29 SEM images of cells seeded on nanodot arrays. HELA, C33A, ES-2, PA-1, TOV-112D,
XIII
array (10 nm), 50 nm nanodot array (50 nm), 100 nm nanodot array (100 nm), and 200 nm nanodot array (200 nm). Cells were harvested at 72 hours (day 3) after seeding. Representative SEM images are shown. ... 54
Figure 30 Immunostaining for distribution of vinculin in cells cultured on 10 nm, 50 nm, 100 nm,
and 200 nm nanodot arrays and on a flat surface. Cells were seeded on arrays for 72 hours before harvest. The sample was incubated with anti-vinculin antibody (properly diluted in 0.5% BSA), followed by incubation with Alexa Fluor 488 goat anti-mouse antibody. ... 55
Figure 31 Immunostaining for distribution of microfilaments in cells cultured on 10 nm, 50 nm,
100 nm, and 200 nm nanodot arrays and on a flat surface. Cells were seeded on arrays for 72 hours before harvest. The sample was incubated with phalloidin. ... 56
Figure 32 Viability versus dot diameter for cells cultured on the nanodevice. Cells are cultured on
the nanodevice for 3 days. The viable cells are counted and percent viability relative to cells cultured on a flat surface (0 nm) is calculated and graphed against the nanodot diameter. The graphs show viability of NIH-3T3 (left), HELA cells (center), and C33A (right). Each value is averaged from at least 6 independent experiments. The error bars are the standard errors. The curves for best fit are derived using SigmaPlot software. ... 57
Figure 33 Percent cells that have undergone apoptosis versus dot diameter for cells cultured on the
nanodevice. Cells are cultured on the nanodevice for 3 days and SEM images are taken. Cells of apoptosis-like morphology are counted and percent apoptosis is calculated then graphed against the nanodot diameter. The graphs show percent apoptosis of NIH-3T3 (left), HELA cells (center), and C33A (right). Each value is averaged from at least 6 independent experiments. The error bars are the standard errors. The curves for best fit are derived using SigmaPlot software. ... 58
Figure 34 Percent focal adhesions versus dot diameter for cells cultured on the nanodevice. Cells
are cultured on the nanodevice for 3 days and immunostaining using anti-vinculin antibody is performed. Number of vinculin stains per cell is counted and percent focal adhesions relative to cells grown on a flat surface is calculated, then graphed against nanodot diameter (A). The graphs show percent focal adhesions of NIH-3T3 (left), HELA cells (center), and C33A (right). Each value is averaged from at least 6 independent experiments. The error bars are the standard errors. The curves for best fit are derived using SigmaPlot software. Representative images used in the measurement are shown (B). ... 59
Figure 35 Percent microfilament bundles per cell versus dot diameter for cells cultured on the
nanodevice. Cells are cultured on the nanodevice for 3 days and phalloidin staining is performed. 3-d fluorescence images are obtained using a confocal microscope. The number of microfilament bundles per cell is counted and percent microfilament bundles relative to cells grown on a flat surface is calculated and graphed against nanodot diameter (A). The graphs show percent actin filaments of NIH-3T3 (left), HELA cells (center), and C33A (right). Each value is averaged from at least 6 independent experiments. The error bars are the standard errors. The curves for best fit are derived using SigmaPlot software. Representative images used in the measurement are shown (B).
XIV
1
1. Introduction
Environmental sensing by living cells displays mangy features that are usually ascribed to chemical or physical interface between cell and surface. In recent years, scientists have great interests about the interaction between cells and the underlying ligands such as extracellular matrix (ECM). Cells detect and respond to the specific ligands and the spatial organization of the scaffoldings. The ECM consists of collagen and elastin fibers of 10–300 nm diameters intertwined into a landscape of peaks, valleys, and pores [1]. Since ECM contains structures from micro-scale down to nano-scale, it is hypothesized that cells respond to both micro-structure and nano-structure. They have found that topography of micrometric scale could affect cellular gene expression, adhesion, migration, proliferation, and differentiation. Nowadays relying on progressive nanotechnology, numerous nanostructures have been developed and applied to the field of cell research. It’s believed that nanostructure is more close to the actual scale of the ligands interacted with cells.
1.1 Micron-scale surface topography
The cell adhesion–mediated sensing of the microtopographical environment displays a critical role in cellular processes including cell morphology [2], focal adhesion [3-4], proliferation [5-6], migration [7-9] and differentiation [10]. Recently, a growing number of studies have shown that introducing a microtopography to the substrate of both two and three dimensional cell culture systems promote cell adhesion [3-4]. Micro-scaled landscapes have been fabricated to direct growth of cultured cells. When cultured on ridges and grooves of nanoscale dimensions, cells migrated more extensively to the ridges than into the grooves. The cells’ shapes were aligned and extended in the direction of the grooves [4, 11]. It has been shown that a
2
three-dimensional micro-structure that mimics ECM provides an environment for the in vivo growth of cells. Although cellular response to microtopography has been extensivly investigated, the nanotopography that cells respond to and the molecular apparatus that senses and transmit the spatial signal from the membrane to the nucleus are not clearly defined at the present time.
1.2 Biomimetics and nanotopography
The recapitulation of natural cellular environments can be achieved at the nanoscale [12]. The three-dimensionality and nanostructure architecture of the ECM may represent essential element in signal transduction pathways and cellular physiology. Nanoscaled modification of a surface could contribute to the mimicry of cellular environments. For example, the structure of the epithelial basement membrane contains pores approximating 70–100 nm [13]. It is suggested that the surface roughness of bone is approximately 32 nm making it within the nanoscale range of current nanotechnology investigations [14-17]. The surface topology at the nanoscale encodes information that directs cell behaviour [18]. Increasing evidence indicates that physical structures affect cell behaviour by providing scaffolds and interacting with the integrins on the cell membrane. Nanoscale texture generated through the deposition of nanocoatings may be useful to improve biocompatibility because surface topography can promote vascular smooth muscle cell and endothelial cell adherence and proliferation [19-20]. In vivo, cells live in environment with specific three-dimensional features of micro- and nanoscale. The ECM that cells interact with displays nano-scaled topography [21-22]. Nanotopographies could control cell growth and function via mechanical mechanisms. The nanostructures such as nanopillar, nanowire, nanodot, and nanoflower have reported in promoting cell growth and functions [23-26].
3
Many studies indicate that various nanostructured surfaces can influence the in
vitro adhesion [27-29], morphology [30-32], proliferation [33], and gene expression
[34] of different cell types. The cellular response to a nanostructured substrate depends on the size arrangement of the topographic features and cell type [35-36]. Cell adhesion and spreading were severely impaired on nanotube layers with tube diameters larger than 50 nm, resulting in dramatically reduced cellular activity and high degrees of programmed cell death. The 15 nm-spaced TiO2 nanotubes optimizes cell adhesion and differentiation [37]. Highly ordered surfaces of 120 nm nanopores significantly reduce cell adhesion by modulating filopodia formation and preventing focal adhesion formation [38-39]. It demonstrates the migration rates of human vascular endothelial cell to the ridge and groove topographic cues [40]. Nanofibers induce faster cellular migration and may be useful as biomedical implant to induce wound closure and tissue regeneration [41]. The correlation of gene expression regulated by nanotopography that controls cell growth and function remains to be explored. These results may be changed in physical properties including enhanced magnetic, catalytic, optical, electrical, mechanical, and biological properties when compared to conventional formulations of the same material [42].
1.3 Nanotopography alters cellular responses
Surface nanotopography alters cell behaviors and affects cell interactions when compared to conventional sized topography [43-45]. Different physical relationships exist between cells and nano- vs cell and micron-scale surface features. Nanotopography affects cellular behavior in a wide range of cell types including osteoblasts, epithelial cells, fibroblasts, myocytes, and stem cell [12]. Nanoscale features can increase adherent cell proliferation [46]. The topographical surface alters osteoblastic attachment, proliferation, differentiation, and matrix production [47-48].
4
Webster and colleagues [49] also observed increased osteoblast proliferation on nanoscale materials (alumina, titania, and calcium phosphate). Osteoblasts grown on a fibrous matrix composed of multiwalled carbon nanofibers (100 nm in diameter) exhibited increased proliferation compared to those grown on flat glass surfaces [50-51]. The use of nanostructures presents an opportunity to positively and negatively modulate cell adhesion and spreading. Cells that adhere to nanotopography may possess altered motility. Recent reports demonstrated that fibroblasts and mesenchymal stem cell (MSC) motility varied remarkably across a small range of nanostructures [35, 52].
An interesting feature of the nanoscale topographic surfaces is the selectivity for cell adhesion. Several investigators have demonstrated the relative diminution of fibroblast adhesion compared to osteoblast adhesion when nano- and micron-structured surfaces were evaluated [51, 53]. Nanotopography-induced cellular response has been explored using nanoislands [17]. Nanoislands were fabricated through varying the polymer blend and allowing spontaneous demixing [54]. Strong influences on the formation of focal adhesions, reorganization of cytoskeleton, and change in the mobility were observed [55]. The cells manage an initial fast organization of the cytoskeleton in reaction to the islands [56]. It has been observed that 13 nm-high islands induce cell spreading and proliferation, while 160 nm islands retard the attachment of filopodia. A gene expression study using a microarray indicates the down regulation of genes associated with the cytoskeleton for cells grown on 95 nm deep nanoislands. The cells responded to the islands with broad gene up-regulation, notably those involved in cell signaling, proliferation, the cytoskeleton, and the production of extracellular matrix protein [57].
5
1.4 Application of nanotopologic surface for implant
1.4.1 Design of stent for cardiovascular implant
Control of cell proliferation, adhesion, and function at the bio-surface interface is essential for the long-term stability of cardiovascular implants [58]. Conventional metals are generally not compatible with tissues. This poor biocompatibility can cause acute thrombosis and long-term restenosis. As a result, the metallic stent can fail due to the response of the vascular smooth muscle cells (VSMCs) or decreased function of the endothelial cells in the vessel [59]. A frequently used approach to improve the biocompatibility of the vascular stent is to coat the traditional metallic surface with materials such as hyaluronan [60], tantalum [61], expanded polytetrafluoroethylene [62], or silicon carbide [63]. These surface modifications all help improve the biocompatibility of the stent with the VSMCs and decrease the interactions of the vascular stent with blood cells. Other options have been suggested to alter the original surface of the metallic vascular stents to enable them to interact with cells [64]. The modification of physical structure may be beneficial in the long-term to design of artificial implants.
The biocompatibility of stents requires design optimisation. The biocompatible material gold is thought to be ideal for coating coronary stents because of its radio-opaque properties [65]. Some studies evaluating the biocompatibility of gold-coated stents suggest that they are equivalent to uncoated steel stents [66]. However, other studies, albeit with patients enrolled who were at higher risk for restenosis, concluded that these stents may increase neointimal hyperplasia compared to uncoated stents [67]. Silicon carbide is an inert semiconductor that can also be coated onto prosthetic surfaces and has been known to be relatively biocompatible and hemocompatible in in vitro studies [52]. Stents coated with silicon carbide also
6
appear to be less thrombogenic than bare metal stents when implanted in human coronary arteries [68]. Overall, observational studies examining gold-coated stents show conflicting results, and the restenosis rates are no better than those obtained with uncoated steel stents [69].
In addition to biocompatibility, cellular function is another important concern in the design of artificial implants [70]. Biocompatibility does not guarantee optimal cell function. In many situations, biocompatibility must be balanced with cell function, such as when stimulation of VSMC proliferation causes restenosis in cardiovascular stents. Restenosis results from the proliferation of smooth muscle cells in the vessel wall in response to acute vessel wall injury induced by angioplasty. Recurrent stenosis and late-stage thrombosis remain significant limitations to successful stent function after stenting peripheral or coronary atherosclerotic lesions [71]. A nanotopographical platform with continuously varied structure could help achieve an implant surface topography that balances biocompatibility and function.
1.4.2 Design of dental implant for osseointegration
For dental implants, surfaces are moderately roughened to promote osseointegration [51, 72]. Studies have shown that osteoblast-like cells favor microstructured surfaces [73-76]. Roughened surfaces enhance the focal adhesion and guide cytoskeletal assembly and membrane receptor organization [18, 77]. Moreover, rough implant surfaces have been shown in in vitro experiments to enhance the adsorption of fibronectin and albumin [78-79], which are important extracellular matrix molecules for cell focal adhesion. Methods including acid-etching, plasma-spraying, grit-blasting, vapor deposition, anodization, and other coating technologies have been developed to fabricate micro- and nanostructures. These different modifications, which result in a variety of surface chemistries and
7
topographies, have led to ambiguous responses by osteoblasts [80-81].There are considerable disagreements concerning the optimal physicochemical properties and surface geometries for the endosseous portion of a dental implant.
Identifying the optimal surface for the bio-implant interface is an important task in tissue engineering [82-83]. Nanoscale modification of the implant surface may alter the surface reactivity of endosseous implants. The surface roughness influences the production of growth factors, cytokines and mRNAs, suggesting that the substrate modulates the activity of the cells that are adjacent to an implant; this roughness subsequently affects the adjacent skeletal tissue response and implant success [84-85]. Moreover, surface topography affects the amount of bone that is deposited adjacent to the implants and bone, and its formation can be guided by the specific implant topography [86]. Thus, surface topography plays a critical role in the interaction of dental implants with the adjacent tissues [87-88]. Nanoscale topography may provide biomimetic surfaces that support hydroxyapatite mineral formation [89] and the related organic phase guidance of bone mineralization [90].
1.5 Survey and control of cell behaviors by nanotopography
The development of invasive and metastatic properties in cancer cells is complicated [91-94]. Invasion of cancer cells begins when cells break away from the primary tumor and penetrate the surrounding tissue, followed by movement into the circulatory system, transportation through the body, and the establishment of a secondary tumor. Changes in motility and the production of enzymes that break through surrounding tissue are characteristic of invasive cancer cells. A fast and convenient platform for cancer diagnosis should be beneficial in obtaining additional factors and parameters that control or manipulate the invasive properties of cancer cells. Thus, utilization of assemblies containing a range of nanostructures should be
8
capable of distinguishing among cancer cell lines of various stages and also provide optical parameters that are useful in the design and evaluation of artificial implants for tissue engineering.
Here we proposed to study cellular responds to nanotopography with different feature sizes and to analyze the differences in physical expressions of cells. The highly packed and uniformly distributed nanodot arrays with defined diameter and depth were fabricated by using aluminum nanopores as a template during oxidation of tantalum thin film [95]. The controllable pore size of aluminum oxide served as a convenient mold to fabricate tantalum into nanodot array of defined diameter. The 2D structure containing nanodots of uniform size have served as a defined nanolandscape to investigate cellular response to topological variation. We fabricated arrays of nanodot surfaces containing dot diameters ranging between 10 and 200 nm. This study is based on the hypothesis that nanotopography may modulate and control the growth, proliferation, and biological function of cells. We determined the nanostructure that achieved maximum cell growth and adhesion. Functional performance, indicated by the expression of representative genes, indicated that the optimized range of nanostructures derived balanced high biocompatibility and cell function.
An integrated nanodevice containing nanodot arrays with dot diameters ranging from 10 nm to 200 nm can be used to evaluate cell behavior. Nanodevices may be used as a detecting platform for the rapid modulation of proliferation, apoptosis, invasive ability, and cytoskeletal reorganization in different cell types. The topologic design of implant surfaces is one of the important factors for the fabrication of medical implants [11, 96]. We can use this platform to survey the optical parameters for various cells in vitro. This strategy will serve as a convenient and fast tool for tissue engineering and cancer diagnosis.
9
2. Materials and methods
2.1 Fabrication of nanodot arrays
Nanodot arrays were fabricated as described previously [95]. A TaN thin film of 150 nm thickness was sputtered onto a 6-inch silicon wafer, followed by the deposition of 3 µm-thick aluminum onto the top of the TaN layer. Anodization was carried out in 1.8 M sulfuric acid at 5 Volts for the 10 nm nanodot array, or in 0.3 M oxalic acid at 25 Volts, 60 Volts, and 100 Volts for the 50 nm, 100 nm, and 200 nm nanodot arrays, respectively. Porous anodic alumina was formed during the anodic oxidation. The underlying TaN layer was oxidized into tantalum oxide nanodots using the alumina nanopores as template. The porous alumina was removed by immersion in 5 % (w/v) H3PO4 overnight. A thin layer of platinum (~5 nm) was sputtered onto the structure to improve biocompatibility. The dimension and homogeneity of the nanodot arrays were measured and calculated from images taken by JEOL JSM-6500 TFE-SEM and by atomic force microscopy (AFM). The fabricated nanodot arrays were cut into 1 cm x 1 cm squares and integrated into a 3 x 3 matrix that was set in a PDMS frame. The PDMS frame was molded in a glass template fabricated by photolithography [97]. Before curing, the template-covered PDMS was held for one hour to allow all bubbles in the PDMS layer to escape. The curing process was performed by heating the PDMS to 75oC in an oven for approximately 45 minutes. The final matrix contained a flat-surfaced square at the center surrounded by nanodot arrays ranging from 10 nm to 200 nm.
2.2 Cell cultures
Characteristics of the cell lines are summarized in Table 5 HELA, PA-1, and MG63 cells were cultured in Dulbecco’s Modified Eagle’s Medium (DMEM)
10
supplemented with 10% fetal bovine serum (FBS) and incubated in 5% CO2 at 37ºC. ES2 cells were cultured in DMEM supplemented with 10% fetal calf serum (FCS) and incubated in 5% CO2 at 37ºC. C33A cells were cultured in MEM Alpha supplemented with 10% FBS and incubated in 5% CO2 at 37ºC. TOV-112D and TOV-21G cells were cultured in MCDB105 and Medium199 supplemented with 15% FBS and incubated in 5% CO2 at 37ºC. H9c2 rat cardiomyoblasts were purchased from BCRC (Bioresource Collection and Research Center, Hsinchu, Taiwan) and cultured on various nanodot arrays with Dulbecco’s Modified Eagle’s Medium (DMEM) containing 10% fetal bovine serum (FBS, Gibco) and supplemented with 4mM L-glutamine at 37 ºC in a humidified 5% CO2 incubator.
2.3 Measurement of cell attachment by cell density
Cells were double stained using 4',6-diamidino-2-phenylindole DAPI and phalloidin. Cells were harvested and fixed using 4% paraformaldehyde diluted in PBS for 30 min, followed by 3 washes in PBS. Cell membranes were permeabilised during 10 min incubation in 0.1 % Triton X-100, followed by 3 PBS washes. Cells were incubated with phalloidin and nuclei counterstained with DAPI for 15 min at room temperature. Samples were mounted and imaged using a Leica TCS SP2 confocal microscope. Cell number was counted using ImageJ software and expressed in terms of cell density.
2.4 Scanning electron microscopy (SEM)
Harvested cells were fixed using 1% glutaraldehyde in PBS at 4ºC for 20 min, followed by post-fixation in 1% osmium tetraoxide for 30 min. Ethanol dehydration was performed using a series of 10 min incubations in 50, 60, 70, 80, 90, 95, and 100% ethanol and air dried. The specimen was sputter-coated with platinum and
11
examined by JEOL JSM-6500 TFE-SEM at an accelerating voltage of 5 keV.
2.5 Immunostaining
Cells were harvested and fixed using 4% paraformaldehyde in PBS for 15 min followed by 3 PBS washes. Cell membranes were permeabilised using 0.1% Triton X-100 incubation for 10 min, followed by 3 washes in PBS. The membranes were then blocked using 1% BSA in PBS for 1 hr and washed again in PBS 3 times. The sample was incubated with anti-vinculin antibody (diluted in 1% BSA solution) and phalloidin for 1 hr, followed by incubation with Alexa Fluor 488 goat anti-mouse antibody for 1 hr and then 3 washes in PBS. Samples were mounted and imaged using a Leica TCS SP2 confocal microscope.
2.6 Bromodeoxyuridine (BrdU) proliferation assay
Cells were incubated with BrdU drug for 6 hours prior to harvest. Cells were then harvested and fixed using 4% paraformaldehyde in PBS for 15 min followed by 3 PBS washes. Cell membranes were permeabilised using 10 min incubation in 0.1% Triton X-100, followed by 3 PBS washes. A 2N HCl solution was applied to break the nuclear membranes. Next, cells were blocked using 1% BSA in PBS for 1 hr. Cells were incubated with anti-BrdU antibody (diluted in 1% BSA) for 24 hours at 4°C, followed by incubation with Alexa Fluor 488 goat anti-mouse antibody and DAPI for 1 hr and then 3 washes in PBS. Cells were then counterstained using BrdU and DAPI to image the nucleus. Samples were mounted and imaged using a Leica TCS SP2 confocal microscope. ImageJ software was used to determine BrdU-labelled cell numbers.
12
The EnzChek Caspase-3 Assay Kit #2 (Invitrogen, USA) was applied to evaluate the caspase-3 activity, using the procedures provided by the manufacturer. Cells were harvested and counted, followed by incubation with the lysis buffer for 30 minutes. The cell lysate was centrifuged, and the supernatant was transferred to microplate wells containing Z-DEVD–R110-substrate-working solution followed by a 30 minute incubation at room temperature. The fluorescence was measured using an ELISA microplate reader (Perkin Elmer, USA) with an excitation wavelength at 496 nm and an emission wavelength at 520 nm. The caspase-3 activity was normalized to cell counts.
2.8 Quantitative real-time PCR
Oligo primers used to amplify genes of interest were designed based on the sequences provided in previous reports (Table 1) [98-100]. The specificity of synthesised primers was verified by polymerase chain reaction (PCR) using reverse-transcribed mRNA extracted from cells as a template. The sizes of PCR products were resolved using agarose gel electrophoresis.
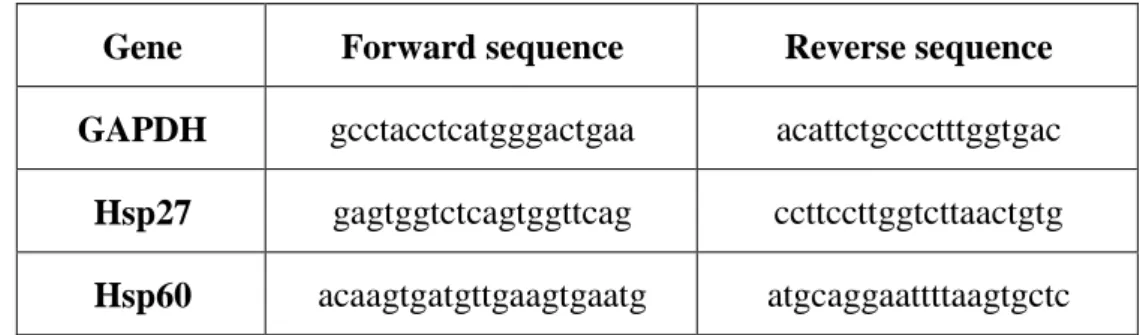
Table 1 Primer sequences
Gene Forward sequence Reverse sequence GAPDH gcctacctcatgggactgaa acattctgccctttggtgac
Hsp27 gagtggtctcagtggttcag ccttccttggtcttaactgtg
13
Hsp70 cctacttcaacgactcgcag cttcctcttgaactcctccac
Hsp90 gtcttctctcgcttctcactt vtatctgtgggaggggattct
beta-MHC gcctacctcatgggactgaa acattctgccctttggtgac
GATA-4 agaaggcagagagtgtgtca cagtgtggtggtggtagtct
PAI-1 gaacgccctctattgtgccgaac ctctgttggattgtgccgaac
ANF tgggctccttctccatcacc gccaaaaggccaggactgac
RAMP2 ttactgctgctgttgctgct aggaaagggatgaggcagat
RAMP3 acctggtcgtgtcaaagtcc ccacaccttccagatgacct
Bcl-2 gctacgagtgggatactgg gtgtgcagatgccggttca
Bax ctgcagaggatgattgctga gatcagctcgggcactttag
Total RNA was extracted from 1.8×10⁵ cells using TRI-reagent (Talron Biotech) according to the manufacturer's specifications. The RNA was isolated using chloroform extraction and isopropanol precipitation. The RNA extract was immediately purified using an RNeasy Mini Kit (Qiagen) to remove impurities and unwanted organic compounds. Purified RNA was resuspended in DEPC-treated water and quantified by OD260. The OD260-to-OD280 ratio usually exceeded 2.0 at this stage. For cDNA synthesis, 1 µg total RNA was annealed using 1 µg oligo-dT primer, followed by reverse transcription using SuperScript® III Reverse Transcriptase (Invitrogen) in a total volume of 50 µl. Between 0.2 and 0.5 μl of the reverse transcription reactions were used for quantitative qPCR using SYBR Green I performed on an iCycler iQ5 (Bio-Rad Laboratories). The cycling conditions were as follows: 1 cycle of 5 min at 95°C and 50 cycles of 20 s at 95°C, 20 s at 55°C, and 40 s at 72°C. Fluorescence was measured after each 72°C step. Expression levels were obtained using threshold cycles (Ct) that were determined by the iCycler iQ Detection
14
System software. Relative transcript quantities were calculated using the ΔΔCt method. The gene GAPDH was used as a reference gene and was amplified along with the target genes from the same cDNA samples. The difference in threshold cycles of the sample mRNA relative to GAPDH mRNA was defined as the ΔCt. The difference between the ΔCt of the control cells and the ΔCt of the cells grown on nanodot arrays was defined as the ΔΔCt. The fold change in mRNA expression was expressed as 2ΔΔCt. The results were expressed as the mean ± SD of six experiments.
2.9 Western blot
Cultured cells were lysed and centrifuged at 12000g for 2 min at 4°C. The supernatants were transferred to new Eppendorf tubes and protein concentrations were defined using UV/VIS spectroscopy. After the protein concentrations were defined, solutions were mixed with 4X sample buffer and lysis buffer to a final concentration of 1 μg/μL protein. Samples were heated at 95°C for 3 min and cooled at 0°C for 3 min; this step was repeated twice. Proteins were separated using 10% SDS-PAGE gels and transferred to PVDF membranes. Nonspecific protein binding was blocked using a 5% milk solution at 4°C overnight. The membranes were subsequently blotted at 4°C overnight using the specific antibodies indicated for each experiment, which were diluted in blocking buffer. Specific primary antibodies were blotted using second antibodies in the blocking buffer at room temperature for 1 hr. Chemiluminescent detection was performed using western blotting luminol reagent and oxidising reagent (U.S.A.).
2.10 Dental implant
The following implant surfaces were investigated: a titanium substrate with a calcium phosphate (CaP) treatment (Implant A), a titanium substrate with CaP
15
plasma-sprayed coating (Implant B), a titanium surface having a titanium plasma-sprayed coating (Implant C), and an uncoated titanium substrate with a machined surface (Implant D). Four types of commercially available dental implants were employed in the clinical tests. Electron microscopy was performed to examine the microstructures and nanostructures of the implants.
2.11 von Kossa staining
MG63 cells were harvested and fixed with 95 % ethanol for 1 hour and then washed three times with DI water. The samples were treated with a 5 % silver nitrate solution, exposed to UV light for 20 minutes, and then washed three times with DI water. The samples were treated with a 5 % thiosulphate solution for 5 minutes and then washed three times with DI-water [101-102]. We randomly picked 50 cells for each condition and calculated the area of the nodule per cell relative to the area of the nodule per cell cultured on a flat surface.
2.12 Alizarin Red S staining
The MG63 cells on the substrates were washed with PBS and fixed with 4 % paraformaldehyde for 10 min. The fixed cells were soaked in 0.5 % Alizarin Red in PBS for 10 minutes at room temperature and then washed with water to remove the remaining stain [103-104]. After staining, the specimens were visualized with an objective microscope. We randomly picked 50 cells for each condition and calculated the area of the stain per cell relative to the area of the stain per cell cultured on a flat surface.
2.13 Statistics
16
Student’s t-test was employed to determine data sets that differed significantly from one another, and significance was defined as a p-value < 0.05.
3. Results and discussion
3.1 Fabrication of nanodot arrays
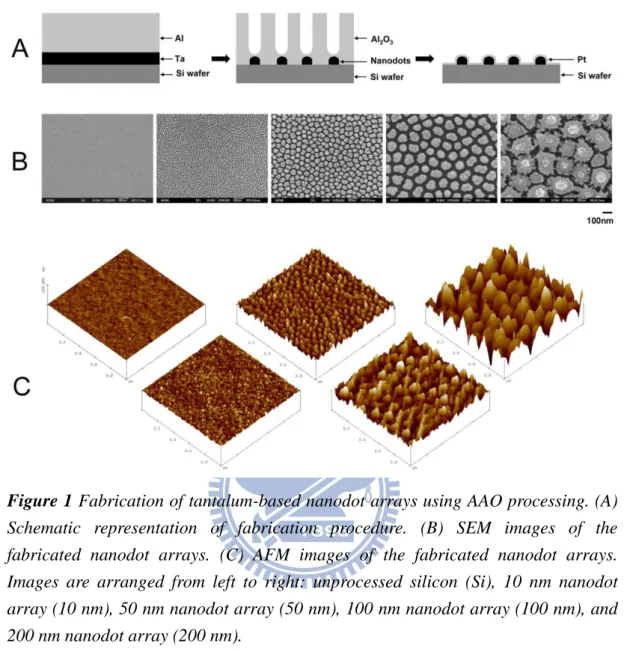
Nanodot arrays were fabricated, as described previously, by AAO processing on tantalum-coated wafers. Tantalum oxide nanodot arrays with dot diameters of 10 nm, 50 nm, 100 nm, and 200 nm were constructed on the silicon wafers. To provide a biocompatible and unique interacting surface, ~5 nm-thick platinum was sputter-coated onto the top of the nanodots. Scanning electron microscopy (SEM) and AFM images showed diameters of 15±2.8 nm, 58.1±5.6 nm, 95.4±9.2 nm, and 211.5±30.6 nm for the 10 nm, 50 nm, 100 nm, and 200 nm dot arrays, respectively (Figure 1). The average heights were 11.3±2.5, 51.3±5.5, 101.1±10.3, and 154.2±27.8 nm, respectively. Dot-to-dot distances were 22.8±4.6 nm, 61.3±6.4 nm, 108.1±2.3 nm, and 194.2±15.1 nm, respectively. The dimensions of the nanodots were well-controlled and highly defined.
17
Figure 1 Fabrication of tantalum-based nanodot arrays using AAO processing. (A)
Schematic representation of fabrication procedure. (B) SEM images of the fabricated nanodot arrays. (C) AFM images of the fabricated nanodot arrays. Images are arranged from left to right: unprocessed silicon (Si), 10 nm nanodot array (10 nm), 50 nm nanodot array (50 nm), 100 nm nanodot array (100 nm), and 200 nm nanodot array (200 nm).
3.2 Nanodot array modulates cell adhesion and induces an apoptosis-like abnormality in 3T3 fibroblast
3.2.1Cell response to nanodot arrays
NIH-3T3 cells were cultured on fabricated nanodot arrays and on flat wafers at a density of 1,000 to 5,000 cells per square centimeter. Cells were harvested at 24 hr (day 1), 48 hr (day 2), 72 hr (day 3), and 96 hr (day 4) after seeding. SEM was performed to examine the morphology of the cells (Figure 2). The side-view of the
18
SEM images provided alternative angles for evaluating the morphological change of cultured cells. Cells grown on the control surface and the 10 nm nanodot array remained flat and extended throughout the course of incubation. Cells grown on the 50 nm nanodot array began to show an abnormal appearance on day 4. The abnormal cells underwent a transformation of the main cell body into sub-cellular spheres of ~5 microns in diameter. On day 4, spherical sub-cellular cell bodies were visible. For cells grown on the 100 nm nanodot array, a comparable morphology occurred as early as day 3, while for the 200 nm nanodot array, the morphological aberration started from day 2. The proportion of cells undergoing this morphological change was higher, and the event was triggered earlier, on the 100- and 200 nm nanodot arrays (figure 3A).
19
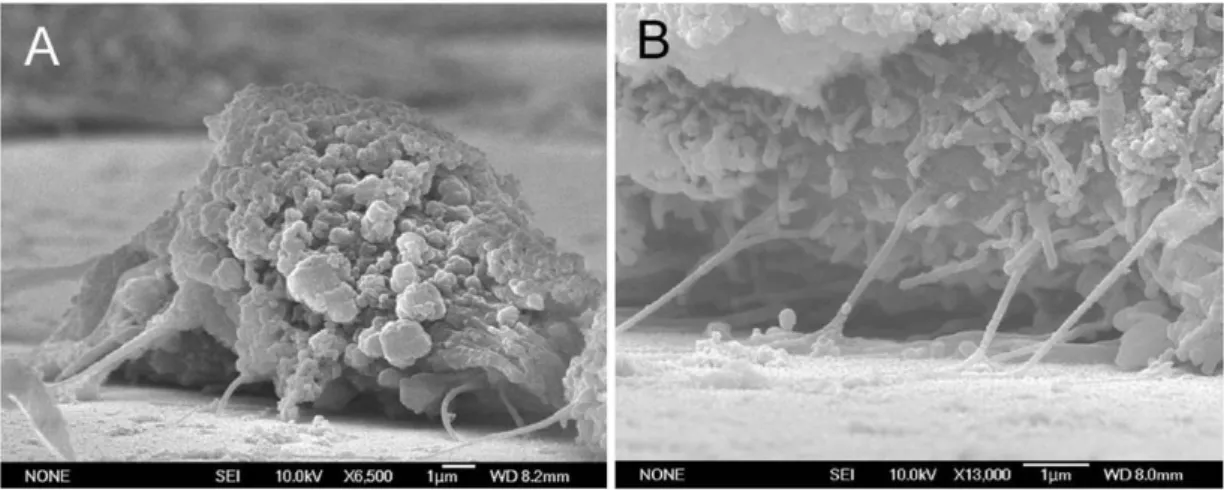
Figure 2 SEM images of cells seeded on the nanodot arrays. NIH-3T3 cells were
seeded on a flat silicon surface, 10 nm nanodot array (10 nm), 50 nm nanodot array (50 nm), 100 nm nanodot array (100 nm), and 200 nm nanodot array (200 nm). The cells were harvested at 24 hr (Day 1), 48 hr (Day 2), 72 hr (Day 3), and 96 hr (Day 4) after seeding. SEM images were taken. Representative images are shown: (A) top view,
20
(B) side view.
3.2.2Nanotextured surface triggers apoptosis-like events of fibroblasts
The morphology of the abnormal cells resembled cells proceeding in programmed cell death. Caspase activity is the hallmark for apoptosis. Thus, the occurrence of apoptosis-like events was verified by a caspase-3 activity assay performed on cells seeded on nanodot arrays following the time course (figure 3B). The onset, time-dependent accumulation, and size-dependent profile of caspase-3 activity matched the proportion of cells undergoing morphological transformation on the nanodot arrays. The nanotopography triggered apoptosis-like events for cultured cells in a size-dependent and time-dependent manner.
Figure 3 Apoptosis occurred in cells cultured on nanodot arrays. (A) The percentage of
cells with abnormal morphology calculated from SEM images. Bars depict percent apoptotic cells grown on the flat silicon surface (grey), 10 nm nanodot array (vertical line), 50 nm nanodot array (empty), 100 nm nanodot array (horizontal line), and 200 nm nanodot array (filled). (B) Caspase-3 activity for cells cultured 96 hrs on the nanodot arrays. Values were averaged from 6 sets of independent experiments and were expressed as mean value ± standard deviation.
Cells grown on the nano-scaled structure could engulf any loose nanoparticles. The endocytosis of the remnants might induce the observed abnormalities. To exclude
21
the possibility that the abnormality was due not to the growth on the nano-structure but to the endocytosis of nanodots, the used arrays were thoroughly cleaned and examined under an electron microscope. The SEM images indicated that the nanodot structures of the used 100 nm and 200 nm nanodot arrays were intact even after a prolonged culturing of cells (Figure 4).
Figure 4 SEM images of the used nanodot arrays. Nanodot arrays of 100 nm and 200
nm were cleaned and washed thoroughly after culturing cells. SEM images were taken on the cleaned nanodot arrays of (A, B) 100 nm and (C, D) 200 nm.
3.2.3Cell adhesion and reorganization of the cytoskeleton were required for the nanotopography-induced cellular abnormality
The formation of focal adhesions, reflected by the attachment of filopodia to the substratum, indicates normal growth for cultured cells [57]. The number of filopodia extended from the cells decreased for cells grown on nanodot arrays larger than 50 nm (Figure 5). For cells seeded on the 200 nm nanodot array, very few filopodia were found. Cells grown on larger-sized nanodot arrays lost the ability to establish filopodia attachment. Further examination indicated that cellular attachment was defective for cells grown on the 100 nm nanodot array (Figure 6).
22
Figure 5 SEM images of NIH-3T3 cells cultured on nanodot arrays to show the
filopodia extended from cells. Typical the cells were shown to elicit the detail of cellular structure.
23
Figure 6 SEM side-view images showing the poor cell attachment of NIH-3T3 cells
grown on the 100 nm nanodot array.
Topology and surface chemistry might share a common pathway for directing cell behavior. Focal adhesions are mediated by cell adhesion through receptor-ligand binding [105-106]. The inability of cells to establish filopodia attachment on a nanolandscape might be prevented by a surface modification with ligands. We coated the 100 nm nanodot array with BSA, FN, or type I collagen. Pre-treatment with BSA did not prevent the nanotopography-induced apoptosis-like abnormality, while FN and collagen I coating completely averted cellular abnormality (Figure 7). FN and collagen are native substrates of integrins, the key transmembrane proteins of focal adhesions. The prevention of programmed cell death by FN- or type I collagen-enforced cell anchorage indicates that the topography-induced apoptosis-like abnormality could be overridden by receptor-mediated cell adhesion.
24
Figure 7 Effects of BSA-, FN-, and type I collagen-coating on the
nanotopography-induced apoptosis-like abnormality. Cells were seeded on 100 nm nanodot arrays and flat wafers pretreated with BSA-, FN-, and type I collagen. Cells were harvested on day 4. SEM was performed to visualize the morphology of the cells (A). Apoptosis-like events occurred were quantified by the caspase-3 activity assay (B).
To evaluate the role of adhesion molecules in the nanotopography-induced apoptosis-like events, immuno-staining specific to actin filaments and vinculin was performed on cells grown on the nanodot arrays (Figure 8). Well-organized actin filaments were visible for cells grown on the flat wafer and on the 10 nm nanodot array. This tight arrangement was gradually lost in cells grown on the 50 nm array
25
and completely disappeared on the 100 nm and 200 nm arrays. Vinculin staining indicated formation of focal adhesions. Vinculin was detected and well-distributed for cells grown on the flat surface and on the 10 nm array. The amount of vinculin staining decreased for the 50 nm array and almost disappeared for the 100 nm and 200 nm arrays. This immunostaining indicated that the nanotopography retarded or inhibited the assembling of focal adhesions.
Figure 8 Immunostaining to show organization of actin filament and distribution of
vinculin in cells cultured on 10 nm, 50 nm, 100 nm, and 200 nm nanodot arrays and on flat surfaces. Cells were seeded on the arrays for 96 hours before harvest. The sample
26
was incubated with anti-vinculin antibody (properly diluted in 0.5 % BSA) and phalloidin, followed by incubating with Alexa Fluor 488 goat anti-mouse antibody.
Micro-topography has been shown to be advantageous to cell growth. Three-dimensional fibrous structures provide an in vivo-like environment that enhances the growth of cells. Micro-scaled grooves and valleys direct the growth of cells. In the current study, the nanotopography of the nanodot arrays generated an apoptotic signal leading to the suicide of cells. Since a micro-topography of 100 nm nanofibers promotes cell proliferation and adhesion, the apoptosis induced by the nanotopography is unexpected. For cells cultured on 13 nm deep nano-islands, increased cell adhesion, proliferation, cytoskeleton, and extracellular matrix remodeling were observed [107-108]. A reduced cell adhesion and cytoskeletal organization was shown for cells cultured on 95 nm deep nano-islands. Although the exact shape and topology is different for the nanodot arrays applied in the current study, the results from both studies shared a common theme that a dot-like nanotopology with dimensions at about 100 nm reduced cytoskeletal organization. Although cellular abnormality was not stated, the result from the nanoisland study is consistent with the current study.
3.3 Topographic control of the growth and function of cardiomyoblast H9c2 cells using nanodot array
3.3.1Cell attachment and proliferation of cardiomyoblasts grown on arrays of nanodots
To evaluate the attachment level of cardiomyoblasts to various nanodot arrays, H9c2 cardiomyoblasts were cultured on fabricated nanodot arrays or on flat wafers at