Optical properties and magnetochromism in multiferroic BiFeO
3X. S. Xu,1 T. V. Brinzari,1S. Lee,2Y. H. Chu,3L. W. Martin,3,4A. Kumar,5S. McGill,6 R. C. Rai,1,
*
R. Ramesh,3,4V. Gopalan,5S. W. Cheong,2and J. L. Musfeldt1
1Department of Chemistry, University of Tennessee, Knoxville, Tennessee 37996, USA
2Rutgers Center for Emergent Materials and Department of Physics, Rutgers University, Piscataway, New Jersey 08854, USA 3Department of Materials Science and Engineering, University of California, Berkeley, Berkeley, California 94720, USA
and Department of Materials Science and Engineering, National Chiao Tung University, HsinChu, Taiwan 30010
4Materials Science Division, Lawrence Berkeley National Laboratory, Berkeley, California 94720, USA
5Department of Materials Science and Engineering, Pennsylvania State University, University Park, Pennsylvania 16802, USA 6National High Magnetic Field Laboratory, Tallahassee, Florida 32310, USA
共Received 17 February 2009; published 21 April 2009兲
In order to investigate spin-charge coupling in multiferroic oxides, we measured the optical properties of BiFeO3. Although the direct 300 K charge gap is observed at 2.67 eV, absorption onset actually occurs at much
lower energy with Fe3+ excitations at 1.41 and 1.90 eV. Temperature and magnetic-field-induced spectral
changes reveal complex interactions between on-site crystal-field and magnetic excitations in the form of magnon sidebands. We employ the sensitivity of these magnon sidebands to map out the magnetic-field-temperature phase diagram which demonstrates optical evidence for spin spiral quenching above 20 T and suggests a spin domain reorientation near 10 T.
DOI:10.1103/PhysRevB.79.134425 PACS number共s兲: 78.20.Ci, 75.30.Kz
The interplay between charge, structure, and magnetism is the origin of rich physics in complex oxides. Because these interactions are so strong, oxides straddle several competing regions of physical, chemical, and size-shape phase space. An important consequence of this phase proximity is the physical property tunability and, in some cases, the opportu-nity to drive new functionality via modification of important energy and length scales in a material. Optical spectroscopy is a well-known probe of charge and bonding in solids. When charge and spin degrees of freedom are strongly coupled, it is also sensitive to magnetic excitations and spin ordering transitions.1,2Magnetochromism, the modification of a mate-rial’s optical constants with applied magnetic field,3,4 is an especially important tool for understanding magnetoelectric and multiferroic materials,5,6 for which spin-charge interac-tion is expected to be large.
In this work, we focus on bismuth ferrite, the only single phase room-temperature multiferroic. This rhombohedrally distorted perovskite7 is ferroelectric below 1100 K共T
c兲 due to Bi center displacement and a G-type antiferromagnet be-low 640 K共TN兲.7BiFeO3is a correlated oxide with a 2.67 eV
charge gap and electronic properties that are governed by strong hybridization and the Bi lone pair.8,9 Bulk BiFeO
3
displays a spatially modulated spin arrangement 共⬇620 Å兲 due to the coexistence of electric and magnetic order and the coupling between electric polarization and spin.10These spin spirals persist up to T
Nand disappear in a strong magnetic field共HC⬇20 T at 4 K兲.7,11Due to the ro-bust electric and magnetic order, large polarization 共⬃100 C/cm2兲, photoferroelectric coupling, and tunable
band gap, this polar oxide is attracting attention for energy harvesting applications.12,13
In order to investigate the interplay between charge and magnetism, we measured the optical and energy-dependent magneto-optical properties of multiferroic BiFeO3and
com-pare our spectral results to first-principles electronic structure calculations,8,9 the response of two similar ferrites 共Fe
2O3
and GaFeO3兲,14–17 and recent second harmonic generation
experiments.18 Temperature and magnetic-field-induced spectral changes reveal complex couplings between Fe3+
crystal-field and magnetic excitations in the form of magnon sidebands. We employ the sensitivity of these magnon side-bands to generate a magnetic-field-temperature phase dia-gram which displays spin spiral quenching at 20 T and sug-gests a spin domain reorientation at 10 T. These results demonstrate that charge dynamics coupled with static mag-netic order is an excellent probe of H − T phase space.
Rhombohedral single crystals with a 共012兲hex face were
grown by flux techniques. Both thick 共0.5 mm兲 and thin 共67 m兲 crystals were studied. A 500 nm rhombohedrally 共111兲 oriented thin film deposited on a 共111兲 SrTiO3substrate
was also used. Transmittance experiments employed the 67 m single crystal and the 500 nm thin film. The absorp-tion coefficient ␣共E兲 was calculated directly from transmittance.19 Near-normal reflectance experiments used the 0.5 mm thick crystal and a Kramers-Kronig analysis to determine the optical constants.19 Measurements covered a wide range of energy共30 meV–6.5 eV兲, temperature 共4–300 K兲 and magnetic field 共0–33 T兲, employing a series of spec-trometers in our own laboratory and at the NHMFL.6 Ab-sorption difference spectra emphasize small changes: ⌬␣ =␣共E,H兲−␣共E,H=0 T兲 at fixed temperature.
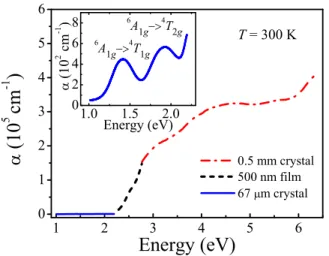
Figure 1 displays the 300 K absorption spectrum of BiFeO3. Here, we employed a combination of samples and
techniques to obtain the most reliable results across the full energy range of our investigation. This effort was necessary because the value of ␣共E兲 varies by 3 orders of magnitude between 1 and 6 eV.20 We assign the observed excitations based on recent first-principles calculations8,9 and by com-parison with similar results in Fe2O3 and GaFeO3.15–17 Dipole-allowed excitations appear above 2.2 eV as O p to Fe d charge transfer in the minority channel. Features at higher energy are majority channel charge transfer excita-tions from strongly hybridized O p and Fe d states to Bi p
PHYSICAL REVIEW B 79, 134425共2009兲
states. Via plots of 共␣E兲2 vs E, we extract a 300 K optical gap of 2.67 eV,13 in excellent agreement with recent ellip-sometry data.21–23 While the charge gap is at 2.67 eV, the onset of optical excitations is at lower energy. A shoulder centered near 2.5 eV关on the leading edge of␣共E兲兴 has been discussed previously.13Furthermore, a closeup view of␣共E兲 below 2.2 eV 共inset, Fig. 1兲 shows two peaks centered at
1.41 and 1.90 eV and an overall level that is 3 orders of magnitude smaller than that above the charge gap. Both peak positions and the low oscillator strength are consistent with assignment as on-site Fe3+ crystal-field transitions. Follow-ing previous work on Fe2O3and GaFeO3, we attribute these
peaks to 6A1g→4T1g and 6A1g→4T2g excitations.15–17 For-mally, these excitations are forbidden because they change the total spin of Fe3+from S = 5/2 to S=3/2. Spin-orbit cou-pling, however, relaxes the spin selection rule, giving rise to the small oscillator strengths observed here. The small octa-hedral distortion that breaks the parity selection rule makes it likely that the observed on-site excitations benefit from hy-bridization and are assisted by vibronic interactions involv-ing odd-parity phonons.14,15
Figure2共a兲shows a close up view of the Fe3+crystal-field
excitations in BiFeO3, the assignment of which is supported by an oscillator strength analysis. Taking the6A1g→4T1g
ex-citation as an example, we calculate oscillator strength using the partial sum rule: f⬅N2c
eបp2兰E1
E2
n␣dE. Here, Ne= 5 is the number of electrons per Fe site, n = 2.7 is the refractive index,22
pis the plasma frequency⬅
冑
e2m⑀0, e and m are the
charge and mass of an electron, ⑀0 is the vacuum dielectric
constant, is the density of Fe sites, c is the speed of light, and E1 and E2 are the energies of integration.24 Overall f follows phonon activation trends, described by f共T兲
= f0共1+e−ប/kBT兲, where f0 is the oscillator strength at
tem-perature T = 0 K andis the average phonon frequency.14,15 This behavior indicates that vibronic excitations are dominant.25From intensity and width considerations, we es-timate ប⬃40 meV and a Huang-Rhys electron-phonon coupling strength SH⬃3, indicative of intermediate
coupling.25 Since f
0⬀1−e−SH, a change in SHmay account for the 150 K anomaly. In this case, increasing T increases 共1+e−ប/kBT兲 but decreases f
0, resulting a minimum at 150 K.
Raman scattering highlighted a similar anomaly near 140 K which was interpreted as a spin reorientation transition.26,27 Sizable oscillator strength changes in BiFeO3 关Fig.2共b兲兴 vs
modest changes at the Morin transition in Fe2O3seem to rule out magnetic reorientation scenarios.14
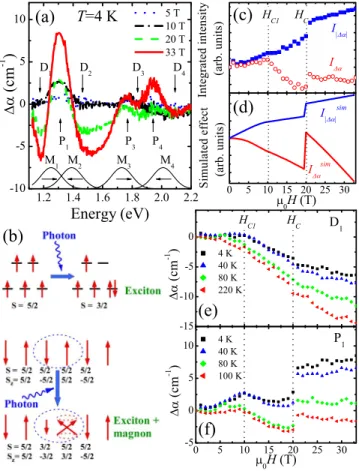
Figure 3 displays the field-induced absorption difference spectra of BiFeO3, ⌬␣共E,H兲⬅␣共E,H兲−␣共E,H=0兲, and
data extracted from these absorption coefficient changes at selected energies and temperatures. This magnetochromic re-sponse demonstrates that Fe3+d to d crystal-field excitations
are intrinsically coupled to the microscopic spin structure. Three peaks共P1, P3, and P4兲 and four dips 共D1to D4兲 can be
identified关Fig.3共a兲兴. As shown in TableI, these features can be grouped into pairs with similar EDip⌬␣-EPeak⌬␣ energy differ-ences. As illustrated in Fig.3共a兲, the pattern in⌬␣共E,H兲 and the energy differences in Table I can be simulated by the displacement of four model oscillators共M1to M4兲 with mag-netic field. Strikingly, the model oscillator positions 共EPeak␣ 兲 do not match the main peaks in ␣共E兲, indicating that they have a different origin than the vibronic excitations discussed previously. As detailed below, we assign M1 to M4 as
mag-non sidebands of the pure electronic excitations.2,28 Simple simulations of intensity and sideband displacement are in line with this assignment.
As depicted in Fig. 3共b兲, magnon sidebands can be viewed as crystal-field excitations on a Fe3+ site assisted by spin tilting on a neighboring site in a different spin sublattice that interact due to exchange interactions. In this case, both spin and parity selection rules are satisfied because the total spin is conserved and the initial and final states have differ-ent parities.29The shape of the magnon sidebands represents the joint density of states of pure crystal-field excition and magnons, for which the peak positions correspond to zone boundary energies, due to the high density of states there, different from the zone center magnon observed in Raman scattering.26,27
FIG. 1. 共Color online兲 300 K absorption coefficient ␣共E兲 as a function of energy. Inset: closeup view of␣共E兲 below 2.2 eV. Al-though this data was collected from a series of samples,␣共E兲 is an optical constant of the material.
FIG. 2. 共Color online兲 共a兲 Variable temperature absorption spec-tra in the range of the Fe3+d − d excitations.共b兲 Oscillator strength
共1–1.62 eV兲 as a function of temperature. Analysis of the 1.9 eV peak shows the same trends, but reliability is reduced due to overlap with the nearby charge transfer edge.
XU et al. PHYSICAL REVIEW B 79, 134425共2009兲
The microscopic origin of M1 to M4 and the essential
characteristics of the absorption difference spectra, ⌬␣共E,H兲, can be understood within the following scenario. Due to the rhombohedral distortion and local C3vsymmetry, the 4T1g and 4T2g states split into A2+ E and A1+ E levels,
respectively. This reduced symmetry also yields two magnon peaks 共M1 and M2兲 associated with the 6A1g→4T1g excita-tion and two magnon peaks共M3and M4兲 associated with the
6
A1g→4T2g excitation. It is well known that magnon
side-bands change position and intensity in a magnetic field.29,30 In contrast, vibronic excitations are less sensitive to applied field. Because spin antialignment favors magnon sidebands, sideband intensity is proportional to −兺Sជi· Sជj, as a first-order approximation, where Sជi 共Sជj兲 is the spin on the ith 共jth兲 Fe site. Since magnetic field tends to cant spins, an applied field generally reduces magnon sideband intensity. In addition, a magnetic field displaces magnon sidebands due to combined Zeeman effects and profile shape modifications, an effect roughly proportional to 兺Sជi· Hជ.
To quantify magnon sideband behavior in magnetic field, we calculated I⌬␣共H兲⬅兰1.1 eV2.2 eV⌬␣共E,H兲dE and I兩⌬␣兩共H兲 ⬅兰1.1 eV
2.2 eV兩⌬␣共E,H兲兩dE. These quantities represent the total
intensity change and displacement of the magnon sidebands, respectively 关Fig. 3共c兲兴. Overall, I⌬␣共H兲 decreases and
I兩⌬␣兩共H兲 increases, as expected. Interestingly, there are
anomalies at HC= 20 T and HC1= 10 T. HC corresponds to the well-known spin spiral to homogeneous antiferromag-netic transition.7,11 A sharp increase in I
⌬␣共H兲 is observed
because the transition enhances spin antialignment. The jump in I兩⌬␣兩共H兲 comes from alignment of the weak ferromagnetic moment due to spin spiral quenching. The origin of HC1 is still an open question, although it was observed previously in electron spin resonance 共and possibly magnetization兲 experiments.7 Magnon sideband behavior suggests that the spiral planes may rotate in the field along the polarization Pជ, becoming perpendicular to the Pជ⫻Hជ plane, which is the lowest energy configuration.7This scenario is consistent with a more negative slope of I⌬␣共H兲 for H⬎HC1, because the effect of the magnetic field is larger when the spiral planes are perpendicular to Pជ⫻Hជ plane. On the other hand I兩⌬␣兩共H兲 has a slight positive slope when H⬍HC1due to alignment of the weak ferromagnetic moment. Using this model, the be-havior of magnon sidebands can be qualitatively reproduced, as shown in Fig.3共d兲. HC1may therefore represent an energy scale for overcoming the anisotropy barrier for rotation of the spiral plane. The order of magnitude of HC1 is in line with theoretical predictions.31
Combining our ⌬␣共E,H兲 data at various temperatures 关Figs. 3共e兲 and 3共f兲兴, we construct the
magnetic-field-temperature phase diagram of BiFeO3 共Fig.4兲. Two critical
fields are observed. As expected, the magnitudes of both
FIG. 3.共Color online兲 共a兲 ⌬␣共E,H兲 for different magnetic fields at 4 K共Hជ⬜共012兲hexface兲. Dips and peaks highlight magnon
side-band displacements with field. Thin lines show proposed magnon peaks in␣共E兲 that shift to generate the observed shape of ⌬␣共E,H兲. Similar results are observed at higher temperatures.共b兲 Schematic illustration of magnon sidebands. The exciton and magnon are cre-ated together to satisfy selection rules. 共c兲 Integrated absorption intensity 共see text兲. 共d兲 Simulated total intensity change I⌬sim␣共H兲⬀ −兺Sជi· Sជj and displacement I兩⌬sim␣兩共H兲⬀兺Sជi· Hជ of magnon sidebands.
共e兲 ⌬␣ as a function of magnetic field for D1at various
tempera-tures. 共f兲 ⌬␣ as a function of magnetic field for P1 at various
temperatures.
TABLE I. Energies 共in eV兲 of features in the 4 K ⌬␣共E,H = 33 T兲 spectra 关Fig.3共a兲兴 related to magnon sidebands.
EDip⌬␣ EPeak⌬␣ EDip⌬␣-EPeak⌬␣ EPeak␣
6A 1g→4T1g 1.18共D1兲 1.31共P1兲 −0.13 1.25共M1兲 1.47共D2兲 1.31共P1兲 0.16 1.39共M2兲 6A 1g→4T2g 1.66共D3兲 1.80共P3兲 −0.14 1.73共M3兲 2.08共D4兲 1.94共P4兲 0.14 2.01共M4兲
FIG. 4. 共Color online兲 H−T phase diagram of BiFeO3
con-structed using⌬␣共E,H兲 data like that in Figs.3共e兲and3共f兲. OPTICAL PROPERTIES AND MAGNETOCHROMISM IN… PHYSICAL REVIEW B 79, 134425共2009兲
critical fields decrease with temperature because elevated temperature weakens magnetic order. HCcorresponds to the transition from spin spiral antiferromagnetic to homogeneous antiferromagnetic phase.7As discussed previously, H
C1 may be related to the rotation of the spiral plane. These results demonstrate that the optical properties of BiFeO3 are
sensi-tive to changes in field-induced spin structure.
Summarizing, we investigated the optical properties of BiFeO3, a 300 K single phase multiferroic, of interest for
fundamental cross-coupling studies and device applications. Although the 300 K charge gap is observed at 2.67 eV, ab-sorption onset actually occurs at much lower energy with Fe3+crystal-field excitations at 1.41 and 1.90 eV. In addition
to unusual temperature trends in the oscillator strength, energy-dependent changes in ⌬␣ are observed when the
magnetic field is applied. Magnetic sidebands are assigned according to their sensitivity to applied field. From the mag-netochromic response, we generate an H − T phase diagram which displays a quenching of the spin spiral above 20 T and suggests a 10 T spin domain reorientation. That magnon sidebands are sensitive to field-driven changes in the spin structure suggests future opportunities to investigate polar oxides.
This work was supported by the DOE 共DE-FG02-01ER45885 at UT兲, NSF 共0080008 at Rutgers, DMR-0654118 at NHMFL, DMR-0820404 and DMR-0507146 at Penn State兲, R.O.C. 共NSC 97-3114-M-009-001 at Chao Tung University兲, and the State of Florida 共NHMFL兲. We thank David Singh for useful conversations.
*Department of Physics, Buffalo State College, Buffalo, NY 14222, USA.
1A. Pimenov, A. A. Mukhin, V. Y. Ivanov, V. D. Travkin, A. M.
Balbashov, and A. Loidl, Nat. Phys. 2, 97共2006兲.
2R. L. Greene, D. D. Sell, W. M. Yen, and A. L. Schawlow, Phys.
Rev. Lett. 15, 656共1965兲.
3J. Choi, J. D. Woodward, J. L. Musfeldt, X. Wei, M. H.
Whangbo, J. He, R. Jin, and D. Mandrus, Phys. Rev. B 70, 085107共2004兲.
4J. Cao, J. T. Haraldsen, R. C. Rai, S. Brown, J. L. Musfeldt, Y. J.
Wang, X. Wei, M. Apostu, R. Suryanarayanan, and A. Rev-colevschi, Phys. Rev. B 74, 045113共2006兲.
5M. Fiebig, J. Phys. D 38, R123共2005兲.
6X. S. Xu, M. Angst, T. V. Brinzari, R. P. Hermann, J. L.
Mus-feldt, A. D. Christianson, D. Mandrus, B. C. Sales, S. McGill, J. W. Kim, and Z. Islam, Phys. Rev. Lett. 101, 227602共2008兲.
7A. M. Kadomtseva, A. K. Zvezdin, Y. F. Popov, A. P. Pyatakov,
and G. P. Vorob’ev, JETP Lett. 79, 571共2004兲.
8J. B. Neaton, C. Ederer, U. V. Waghmare, N. A. Spaldin, and K.
M. Rabe, Phys. Rev. B 71, 014113共2005兲.
9S. J. Clark and J. Robertson, Appl. Phys. Lett. 90, 132903
共2007兲.
10I. Sosnowska, T. Peterlin-Neumaier, and E. Steichele, J. Phys. C
15, 4835共1982兲.
11R. Przenioslo, A. Palewicz, M. Regulski, I. Sosnowska, R. M.
Ibberson, and K. S. Knight, J. Phys.: Condens. Matter 18, 2069 共2006兲.
12D. Lebeugle, D. Colson, A. Forget, M. Viret, P. Bonville, J. F.
Marucco, and S. Fusil, Phys. Rev. B 76, 024116共2007兲.
13S. R. Basu, L. W. Martin, Y. H. Chu, M. Gajek, R. Ramesh, R. C.
Rai, X. Xu, and J. L. Musfeldt, Appl. Phys. Lett. 92, 091905 共2008兲.
14L. A. Marusak, R. Messier, and W. B. White, J. Phys. Chem.
Solids 41, 981共1980兲.
15A. I. Galuza, A. B. Beznosov, and V. V. Eremenko, Low Temp.
Phys. 24, 726共1998兲.
16J. H. Jung, M. Matubara, T. Arima, J. P. He, Y. Kaneko, and Y.
Tokura, Phys. Rev. Lett. 93, 037403共2004兲.
17Y. Ogawa, Y. Kaneko, J. P. He, X. Z. Yu, T. Arima, and Y.
Tokura, Phys. Rev. Lett. 92, 047401共2004兲.
18M. O. Ramirez, A. Kumar, S. A. Denev, Y. H. Chu, J. Seidel, L.
Martin, S.-Y. Yang, R. C. Rai, X. Xue, J. F. Ihlefeld, N. Podraza, E. Saiz, S. Lee, J. Klug, S. W. Cheong, M. J. Bedzyk, O. Auciello, J. L. Musfeldt, D. G. Schlom, R. Ramesh, J. Orenstein, and V. Gopalan, arXiv:0803.3473, Phys. Rev. B 共to be pub-lished兲.
19F. Wooten, Optical Properties of Solids 共Academic Press, New
York, 1972兲.
20Absolute levels of ␣共E兲 underlie sample appearance: 100 nm
thin films are yellow,m-sized powders are red, and mm-sized crystals are black.
21J. F. Ihlefeld, N. J. Podraza, Z. K. Liu, R. C. Rai, X. Xu, T. Heeg,
Y. B. Chen, J. Li, R. W. Collins, J. L. Musfeldt, X. Q. Pan, J. Schubert, R. Ramesh, and D. G. Schlom, Appl. Phys. Lett. 92, 142908共2008兲.
22A. Kumar, R. C. Rai, N. J. Podraza, S. Denev, M. Ramirez, Y. H.
Chu, L. W. Martin, J. Ihlefeld, T. Heeg, J. Schubert, D. G. Schlom, J. Orenstein, R. Ramesh, R. W. Collins, J. L. Musfeldt, and V. Gopalan, Appl. Phys. Lett. 92, 121915共2008兲.
23A. J. Hauser, J. Zhang, L. Mier, R. A. Ricciardo, P. M.
Wood-ward, T. L. Gustafson, L. J. Brillson, and F. Y. Yang, Appl. Phys. Lett. 92, 222901共2008兲.
24The intensity analysis is less reliable for the 1.90 eV peak
be-cause of the charge transfer absorption background.
25K. Huang and A. Rhys, Proc. R. Soc. London, Ser. A 204, 406
共1950兲.
26M. K. Singh, R. S. Katiyar, and J. F. Scott, J. Phys.: Condens.
Matter 20, 252203共2008兲.
27J. F. Scott, M. K. Singh, and R. S. Katiyar, J. Phys.: Condens.
Matter 20, 322203共2008兲.
28Pure exciton intensities are much weaker due to their magnetic
dipole nature.
29V. V. Eremenko and E. G. Petrov, Adv. Phys. 26, 31共1977兲. 30R. A. Shatwell and A. J. McCaffery, Phys. Rev. B 12, 3815
共1975兲.
31C. Ederer, and N. A. Spaldin, Phys. Rev. B 71, 060401共R兲
共2005兲.
XU et al. PHYSICAL REVIEW B 79, 134425共2009兲