Interoperabihy
of
EFCl
and
ER
Switches
for
ABR
Services
in
ATM
Networks
Yuan-Cheng Lai and Ying-Dar
Lin
National Chiao Tung UniversityAbstract
With
the advances in switching technologies, ER switches are becoming popular since they perform better than EFCl switches. In the transitional period, EFCl and ER switches may coexist in the same ATM network. Hence, the efficiency of various ER schemes should be reevalualed in the mixed EFCI-ER environment, not only in the homogeneous ER environment. Also, some important implications are observed i n the heterogeneous environments. Because the location of an ER switch i n the topology is critical to its performance, some placement rules, which describe howto place the ER switches for network operators, are developed in order to achieve a better performance of the network. In summary, the results presented here should serve as a n operational reference for service providers.
synchronous transfer mode (ATM) is the most promising transfer technology for implementing the broadband integrated services digital network (B-ISDN). It supports applications with distinct quality of service (QoS) requirements such as delay, jitter, and cell loss, and distinct demands such as bandwidth and through- put, so it can enable multimedia communication over the net- worked environment. However, in or de r to support old applications or some applications that do not choose to use performance-guaranteed services, an ATM network also pro- vides best-effort services such as LAN emulation and IP-over- ATM. To provide these services for a wide variety of applications, the ATM Foruni has defined a family of service categories including constant bit rate (CBR) service, real-time variable bit rate (rt-VBR), non-real-time VBR (nrt-VBR), unspecified bit rate services (UBR), and available bit rate (ABR) service [l].
As we know, ABR service is suited for a wide variety of appli- cations since it can support data traffic economically [2]. Howev- er, when these applications, such as IP-over-ATM, transmit data packets in ATM networks, they segment each packet into ATM cells. The loss of any cell causes the retransmission of the entire packet. Under the condition of congestion, throughput collaps- es since too many packet retransmissions result from cell loss
[3]. Hence, it is necessary to adopt some congestion methods to decrease cell loss and increase throughput.
Recently, some feedback flow control schemes have been
presented in order to provide ABR services [4-111. Two
strategies have been proposed: credit-based [4, 51 and rate- based [2, 6-11]. The credit-based scheme is a link-by-link win- dow flow control scheme. Each link in t h e network independently runs the flow control mechanism. The rate- based scheme uses the feedback signal from the network to control the rate at which each source transmits cells into the network. In late 1994, the ATM Forum voted for rate-based control as ABR service.
In traffic management specification TM 4.0, the detailed and concise operations of rate-based flow control a r e described. The behavior of traffic sources and destinations is clearly defined in order to provide the baseline for vendors to follow. However, the methods the switches use to control the source rate are up to the vendors. Currently, most ATM ven- dors have already provided ATM switches equipped with explicit forward congestion indication (EFCI) functions rec-
ommended by the International Telecommunication Union -
Telecommunication Standardization Sector (ITU-T) [12]. These switches, which use EFCI marking, are called first-gen- eration switches [13]. With the advances in switching technolo- gies, second-generation switches, which have the explicit rate (ER) setting capacity, are becoming popular.
In the transitional period from first- to second-generation switches, interoperation of EFCI and E R switches becomes unavoidable. Because of the differences in their basic opera- tions, whether they can cooperate efficiently ialong the path of
0890-8044/98/$10.00 0 1998 IEEE IEEE Network JanuaqdFebruary 1998
the same virtual circuit (VC) is questionable. In this article, the performance of interoperating various ER schemes with EFCI is presented and compared. Although we know some properties of these ER schemes from many papers [2,6-111, the knowledge is obtained from an environment in which all switches use the same flow control algorithm. However, from our simulation, the behavior of these ER schemes in a mixed EFCI-ER environment is sometimes different from that in a pure E R environment. Hence, these E R schemes must be reevaluated.
In a mixed EFCI-ER environment, the location of ER is a critical issue for peformance. When a customer buys a switch equipped with an E R setting capacity, which EFCI switch should be replaced first to obtain the best perfor- mance? We pel-formed some siinulations with various net- work configurations. T he simulation results provide important implications on which E F C I switches to b e replaced. Therefore, from our results the network operators can have better insight to help themselves purchase proper ER switches to fit their needs. Also when they are about to install their E R switches, they can choose the appropriate EFCI switches to be replaced.
The remainder of this article is organized as follows. In the second section, we describe the operations of EFCI switches and various ER switches. Simulation environments are presented in the third section. In the fourth section, we present and discuss simulation results obtained in th e homogeneous and heterogeneous EFCI-ER environments. Some guidelines for placing ER switches are given in the fifth section. The final section points out some future work.
NI RA Reserved
'
- ER CCR MCRABR
Flow Confro1
Message type: no increase 7 5 1
Message type: requesVacknowledge 7 4 1
Message type: reserved 7 3-1
Explicit cell rate 8-9 All
!
Current cell rate 10-11 All
Minimum cell rate 12-13 All 1
First, we briefly introduce the basic operation of the closed- loop rate-based control mechanism [1]. When a VC is estab- lished, the source end system (SES) sends the cells at the allowed cell rate (ACR), which is set as the initial cell rate (ICR). In order to probe the congestion status of the network, the SES sends a forw.ud resource management (RM) cell (Table 1) every N , - 1 data cells. Each switch may set certain fields of the RM cell to indicate its own congestion status or the bandwidth the VC source should use. The destination end system (DES) returns the forward RM cell as a backward RM cell to the SES. According to the received backward RM cell, the SES adjusts its ACR, which is bound between peak cell rate (PCR) and minimum cell rate (MCR).
The RM cell contains a 1-bit congestion indication (CI) set to zero, and an explicit rate (ER) field is set initially to PCR by the SES. When the SES receives a backward RM cell, it modifies its ACR using additive increase and multiplicative
QL SN
DIR Message type: direction
BIN Message type: BECN cell
Queue length protocol identifier
14-17
11:;
,
Sequence number 1 8-2 1
1
CII
Message type: congestion indicationI
7I
6I
' Reserved Reserved Reserved 22-51 All
I
Reserved 52 8-3'
CRC-10I
CRC-10I
52I
2-11
53 All - CRC-I 0I
CRC-I .~ 0 .-W Table 1 . Fields and theirpositions in RA4 cells.
dccrcasc. The new ACR is computed as follows, depcnding on CI and ER fields in RM cells:
ACR = max(min(ACR
+
RIF . PCR,ER),MCR), if CI = 0,ACR = max(min(ACR
.
(1 - RDF),ER),MCR), if CI = 1,where R IF is the rate increase factor and R D F is the rate decrease factor.
According to the congestion monitoring and feedback,mech- anism, various switch mechanisms can be classified into two types. One is the EFCI switch, the other the ER switch. The components of rate-based flow control are shown in Fig. 1.
€FCI
SchemeIn this scheme 1141, when congestion occurs the switch sets the EFCI bit to one (EFCI = 1) in the header of each passing data cell. The DES, if a cell with EFCI = 1 has been received, marks the CI bit (CI = 1) to indicate congestion in each back- ward RM cell. In most cases, the queue length is used to decide whether consestion occurs or not. As the aueue length excceds a threshold, denoted Q , dongestioi is claimed. When the queue length falls below the threshold, congestion is relieved.
. . ~ -.
!
i
I
Explicit Rate Feedback SchemesIn E R schemes, the switch computes the fair share of bandwidth with which a VC can be supported, and determines the load and the actual cxplicit ratc. When cach RM cell pass-
e s , the switch sets the E R field to the deter- mined explicit rate. Note that each switch is not allowed to increase the ER field. Thus, a source shall receive the allowed MCR of all the switches along the path. Examples of E R switch mechanisms are the EPRCA, ERICA,
.- .- CAPC, Charny Max-Min, and Tsang Max-Min
schemes [E-191.
I
'
'
ER switch Reduce ER field of RM cells
W Figure 1
.
ABR rate-bmedflow control.A B !
: 1.1':
I
Enhanced Proportional Control Algo-
rithm (EPRCA) [
I53
- Each switchmaintains a mean allowed cell rate (MACR) using a running exponen- tial weighted average. When a switch receives a forward RM cell during t h e congestion period, MACR is updated as
MACR = (1 - a)MACR
+
aCCR,where a is the exponential averag- ing factor generally set to be 1/16 and CCR is the current cell rate o f
t h e V C recorded in the R M cell. The fair bandwidth share is comput- ed as a fraction of the MACR:
Fair share = DPF . MACR, where D P F is a switch downpres- sure factor set close to but below 1. When a switch receives a backward RM cell, it reduces the E R field to the fair share if its queue length is larger than Q,.
Expiicii Rate indication for Conges- tion Avoidance /ER/CA)
T
63 -ERICA uses a load factor, z, to indi- cate the overload or underload state
of t h e switch. T h e load factor is
defined as Input rate Taigct rate
% =
The input rate is measured over a fixed averaging interval, and the tar- get rate is usually set slightly below
I
I
Switch 1: A uncontrained 5witch 1: A uncontrained ER,A)?)..l h i t c h 2 B unconstrained
c unconstrained c unconsLr,riried FR'A)=10 -+ C constrained
kK(B)=' -'..
Wi'ichZ: B tinconsti-ained c tK(B'=5 ! u ncons tra i i led E '(" Lz
A.
-,.-I
C
- - - , r ; ~ ~ ~ ~ w 2 ~ ~ ~ r s w 3
-- -+t
B
A l s o m e t i m e instant: CCR(A) - ZOM, CCR(B) = SM, CCR(C) = 10M
-1
(cl! A -_I. TMM1
I
I II
. . - .. .. . .Switch 1: A uncontrained ER(A)=I 5 C constrained ER(B)=5 + Stable Switch2: B unconstrained ER(C)=5
C unconstrained
I I I
the link bandwidth. Because the goal o f this algorithm is to maintain the load factor close to one, the sources ought to change their current sending rates inversely proportional to the calculated load factor. The VC share and fair share are as follows: CCR VC share = -, Fair share = Z Target rate Number of active connections
A switch updates the E R field in the backward RM cell it received to the maximum value of the fair share and VC share.
Congestion Avoidance Using Proporiiona/ Controi JCAPC) [ 7
7
1
- Again, as in the ERICA scheme, the switches set a target
utilization slightly below 1 and compute the load factor. The main difference lies in the way the fair share is computed, which depends on whether z < 1 or z > 1. Thus, we have
Fair share = Fair share . min(ERU, 1
+
(1 - z).
Rup),if z < 1, and
Fair share = Fair share . max(ERF, 1 - (z - 1
.
R d n ) ,i f z > 1,
where R,,p is a slope parameter between 0.025 and 0.1, and
Rdn is between 0.2 and 0.8. E R U and E R F determine the maximum allowed increase and minimum allowed decrease, respectively. Usually ERU is set to 1.5 and ERF to 0.5. When
a returning RM cell arrives at the switch, the E R field is
updated to the fail- share.
The Charny Max-Min Scheme [ 7
81
~ The fair share is com-puted using an iterative procedure in this scheme. Initially, the fair share is set to the link bandwidth divided by the num- ber of active VCs. Some VCs cannot achieve the fair share at a switch because of the constraints imposed by the limited amount of bandwidth available at other switches along its path. For this switch, these VCs are called "constrained VCs." The switch can determine whether a VC is constrained or not by comparing the fair share with the CCR field in the received forward RM cell. If the CCR field is less than the fair share, the VC is a constrained VC. Otherwise, it is an unconstrained VC.
For high throughput, the available bandwidth which the constrained VCs cannot use should be utilized by the uncon- strained VCs. Hence the fair share is computed as follows:
Link bandwidth - CBandwidth of constrained VCs
Fair share =
Number of VCs - Number of constrained VCs
As a forward RM cell traverses the network, the switch determines whether the VC is constrained or not, recomputes the fair share, and reduces the ER and CCR fields of the RM cell down to their fair shares. The E R and CCR fields of a backward RM cell may be reduced further down to the most current fair share on the forward path.
The Tsang Max-Min Scheme (TMM) [
T
93 - This scheme is similar to the Charny Max-Min method, except for three dif- ferences:IEEE Network Januarypebruary 1998
The switch does not update the CCR field of the RM cell.
The switch determines a VC state depending on the E R field, instead of the CCR field, of the RM cell.
The switch determines the VC state and com-
putes the fair share on forward and backward RM cells, not just the forward RM cell.
The following parameters are set for the above
schemes in our examDle and simulation: Nrm =
1 km
I
G3-
~ (N3VCs) I sw3 - 100 km 100 kin s w 2 Link2 Link 1 sw1 151 km 151 kin GI (NI VCs)W Figure 3. Simulation model.
G2 (N2 VCs)
I
. -1600 1200 800 400 32, PCR = 155 Mbjs, MCR = 0 b/s, ICR =PCR/16, R I F = PCR/:!56, and R D F = 1/16. For EFCI, we used Qt = 1000 cells. For EPRCA, we set Q, = 1000 cells,
a
= 1/16, and DPF = 718. Target rate is set to be 95 percent of the link bandwidth for 13FICA and CAPC. Also, in the CAPC scheme we use the following parameters: ER U = 1.5, R,, =
0.05, ERF = 0.5, and R(in = 0.5.
An
ExampleWe show a simple example to illustrate the operation of the five E R schemes described above. The example is shown in Fig. 2. The network configuration consists of three switches
and three connections (.A, B, C), as shown in Fig. 2 a. Connec-
tions A and B traverse a link, and C traverses two links. The
operation of these schemes are exhibited in Fig. 2 b.
-
. .
-
Simulafion Environmenfs
We show the numerical results of these schemes in a homoge- neous environment in which all switches utilize the same con- trol scheme, and in a heterogeneous environment in which the switches utilize different control schemes. We first examine the network configuration and performance metrics.
Network Configuration
We use a simple three-switch configuration, as shown in Fig. 3, as our network topology. It is sufficient to exhibit the char- acteristics of various iswitches [20,21]. It consists of three
I MQL1 (cells:l
1
2 0 0 0 7 -I 16001
1200I
800I
400I
I
A Bf?q
C D ’ ? FI
U2 (%)switches and some connections grouped into three groups ( G l , G2, G3). G1 is the VCs traveling through link 1, only and Group 2 (G2) is the VCs traveling through link 2 only. Group 3 (G3) is the VCs passing through both links 1 and 2. There are N1, N2, and N3 connections in G1, G2, and G3, respectively. In our simulation, there are two VCs in each group (i.e., N1 = N2 = N3 = 2).
The link between two neighboring switches is 100 km long with 155 Mb/s capacity. For G3, the distance between a source and a switch is 1 km. On the other hand, the distance between a source and a switch is 51 km for G1 and G2. Hence, the propagation delay is the same for all groups. The reason is that we want to eliminate any unfairness caused by the differ- ent propagation delays. Also, all sources considered in the simulations are persistent.
Performance Mefrics
The following performance measures are reported in the sim- ulation.
M a x i m u m Queue Length (MQI) - Th e maximum queue length is directly related to the cell loss probability when the buffer at the switch is finite. Also, we can observe the situa- tion of ACR oscillation with this value. When this value is high, the ACR usually has larger oscillation.
Uti/ization (U) - From the value of utilization, we can know . .-
--
MOL2 (cells) U1 (Yo)
in
1
A B C D E F F (Yo) 100 80 60 40 20 A B C D E FI
100 80 60 40 20I
A B C D E Fi
~ A--
EFCI B -- EPRCA C -- ERICA D -- CAPC E --CMM F --TMM i - -. - .~ .- -W Figure 4. Comparisori of the various switch schemes in homogeneous environments.
how much bandwidth is wasted at the switch. Utilization is a clear measure of switch capacity.
Fairness (F) - Unfair behavior is
observed from the value of fairness, which is defined as
F = max(1- max(a1l Ixi - 1
I),
0)where xi is t h e ratio of t h e actual throughput to the fair throughput for source i. This definition is the maxi- mum ratio difference between ideal and achieved rates. We d o not use the commonly used definition [2, 6, 8, 221,
because only a few differences are observed. This is the major drawback of this metric.
As a n example, we consider th e case of 25 connections sharing the same bottleneck link in which band- width is 100 Mb/s. The fair solution is simply 4 Mb/s. If a scheme starves one connection completely and dis-
’ 37
~ EFCl
i
i
ER Ii
ERI
EFCl EPRCA ERI
CAI'C+
Simplicity .Does not need per- connection information
I
...-
ER ; T M MHigh oscillation ACR High maximum queue length Becl 1 dowri problcm
Parameter luniiig problem Achieves target load Sensitive t o CC8 errors -. ... " i
1
... Max-Min method using CCR Using Oscillation-free High utilization Fairness queue length A -- all EFCl B -- EFCI-EPRCA C -- EFCI-ERICA D -- EFCI-CAPC ... ~ Using MACRUsing load factor and CCR
Simplicity High oscillation of ACR High maximum queue length Serious beat down problem
I
Using load factor and
some parameters ' conncction information Parameter trrninq problem Does not need per..
i
Achievcstarger loadNeeds per-connection Sensitive t o CCR errors
information
i
Max-Min method Osci I lat io n4ree Needs per-connection using ER
j
High utilization iriformationFairness
. . .
-
. . .3 Table 2. Compaiisoii of the various switch schemes in homogeneous environments.
tributes its share evenly among other connections, the ratio commonly used definition gives a fairness value of 96 percent, whereas the new metric gives 0, which appears more appropri- ate for the case of starvation.
value (xl, x2 ... ~ 2 4 , "25) is (100196,100196, .... 100196,O). The
N u m e r i c a l Results
Homogeneous Environment
Simulation results in the homogeneous environment a re shown in Fig. 4. MQLl and U1 represent the maximum queue length and utilization at switch 1. Similarly, MQL2 and U2 represent the maximum queue length and utilization at the switch 2. Note that the results about switch 3 are not shown because it does not become a bottleneck at any
time.
F r o m t h e figure, i t is obvious t h a t t h e resulting behavior is m o r e unfair in t h e ho mo geneous E F C I environment t han in homogeneous E R environments. T he main reason is that the beat down problem occurs when we use pure EFCI switches. The beat down problem is that VCs passing through a
larger number of switches get less bandwidth
than VCs passing through a smaller number
of switches [2, 8, 221. This effect is because VCs traveling more hops have a higher prob- ability of getting their cells ma rk e d t h a n those traveling fewer hops. As a result, it is
likely th at long-hop VCs c a nnot increase th e ir rates, a n d consequently a r e b e a t e n down by the short-hop VCs.
Also, we observe that the MQL of EFCI and
EPRCA is large. This is caused by the large oscillation of ACR. Actually, in homogeneous environments the ACR of EFCI and EPRCA has large oscillation, the ACR of ERICA and CAPC has little oscillation, and the ACR of CMM and TMM is oscillation-free [9-111.
Regarding utilization, link capacity is not fully utilized because queue length threshold,
Q t , is set too low in the homogeneous EFCI
environment. However, if Qt is set high, the maximum queue length will be raised dramati-
cally [23, 241. Hence, we sacri- fice some bandwidth to keep the maximum queue length in the reasonable range. On the other hand, high utilization is achieved in the homogeneous ER environments. EPRCA has high utilization. E R IC A and CPAC achieve the target rate. TMM and CMM utilize almost the complete link bandwidth. We summarize these results which a r e observed in t h e homogeneous environments as listed in Table 2.
The noticeable thing is that CMM and TMM are sensitive to CCR errors. This sensitivity does not depend on whether or not the CCR value is actu- ally used by the algorithm, but r at h er o n t h e fact t h at both schemes are purely computa- tional algorithms with no rate measurements involved. It should be noted that this issue may be overcome by using rate measurements at the source.
Heterogeneous Environment
In this heterogeneous simulation we use an EFCI scheme on
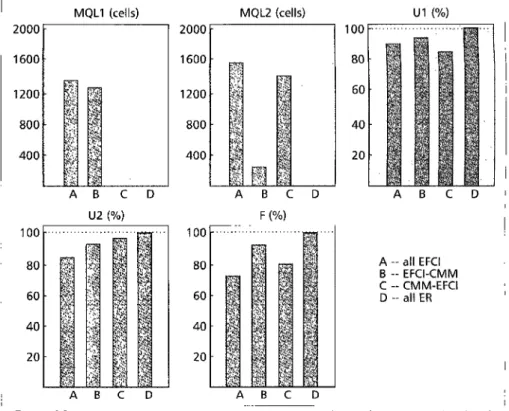
switch 1 and an ER scheme on switch 2. The results of inter- operating EFCI with various E R schemes are illustrated in Fig. 5. In order to compare performance in the heterogeneous environment, we also plot the performance in the pure EFCI and pure CMM environments, denoted A and G, respectively. Also, Fig. 6 shows typical ACR dynamics in the EFCI-ER environment. From the results, we observe some important
._ MQI.1 (cells)
zooo ~ - .
. .~ B C D E F G IOU'. 80 60 - - 40 -I
2o1
MQL2 (cells) 1ao
80 60 40 20 F (a,)r
A B C D E F ' G . 111 (9;) - . - LE Figure 5. Comparison of the various ER schemes in mixed EFCI-ER environ- ments (RIF =1/256).
IEEE Network * January/February 1998
__ ~ .. .. I 6000 4000 2000 I I 70
-
60l
z
er 40 ~ 2 3 0 20 Ii
1
$ 5 0 I I I 30i
20 10 Y I II
I I - - ! 0 0.05 0.1 0.15 0.2 0.25 0.3 Time (s)I
.i-
Figure 6. Typical A C R dynamics in the EFCI-ER environment.implications which are not shown in the homogeneous envi- ronments.
The Beat Down Problem Exists when the EFCl Switch Appears
-
In the mixed EFCI-ER environment, the beat down prob-lem still exists. This is due to the existence of the EFCI switch, as observed in Fig. 6. The ACR of VCs which pass EFCI and ER switches (G3) is not increased to a high level because it is restricted by E R switches. On the other hand, it must be decreased to a low level when congestion occurs in the EFCI switches. As a result, the beat down problem happens.
Actually, more EFCI switches cause a more severe beat down problem in ATM networks. On the other hand, more ER switches relieve the severity of the beat down problem.
Utilization of EFCI Switcnes Rises and Utilization of ER Switches
Drops - From Fig. 5 , this phenomenon is easily observed.
Simply speaking, because EFCI switches own the high oscilla-
tion of ACR, they can easily grab the unused bandwidth.
Hence, the utilization (of EFCI switches rises. On the other hand, the low oscillation of ACR in ER switches causes a slow
I MQLl (cells) 7
'
6000 I I 4000i
2000I
!
I A B C D E U2 (Oh) MQL2 (cells) A B C D E F (%) I 100 100I
80 801
60 60 40I
40 II
20 20!
A B C D E ..
, . . . . 01I
I I 0 0.05 0.1 0.15 0.2 0.25 0.3 Time ( 5 ) . .. . - . .Figure 7. ACR dynamics in the EFCI-TMM environment.
response to unused bandwidth. Therefore, much bandwidth is wasted, and the utilization of ER switches drops.
The CCR Field in thc RM Cells May Be Belated - In homo- geneous E R environments, this condition happens rarely. However, in the mixed EFCI-ER environment, it occurs often. When congestion of the EFCI switch occurs (i.e., there are at least Q, cells in the EFCI switch), the algorithm using the CCR field in t h e RM cells does not obtain the current cell rate because the R M cells are queued at the EFCI switch. Hence, the CCR fields of delayed R M cells are belated. As a result, the E R switch may use an inaccu- rate CCR field.
The E R Ficld Is Not Uscd i n the RM C c / / s - TM M is a representative algorithm using t h e E R field in t h e R M cells. We can observe th a t t h e utilization of t h e TM M switch is low in t h e mixed E F CI -ER environments. As
shown in Fig. 7, TMM does not obtain any E R information because the EFCI switch does not set the ER field. Hence, th e scheme loses responsiveness. Therefore, we suggest
A -- EFCl-EPRCA B
--
EFCI-ERICA C -- EFCI-CAPC D -- EFCI-CMM E--
EFCI-TMM - ~ ~. .~Figure 8. Comparison of the various E R schemes in the mixed EFCI-ER environ-
ments (RIF = 1).
t h a t all s c h em es d o not use t h e E R information in t h e R M cells if E F C I switches may coexist.
The Value of RIF Should Not Be Set to a
large Value - Some papers use the high RIF to reduce the length of the transient period in the homogeneous ER environ- ment [18-201. When using the high RIF, t h e ACR of t h e source can quickly achieve the level of the E R field, regard- less of the RIF value. Thus, the response time is reduced, especially for CMM or
TMM.
In order to understand the effect of RIF in the mixed EFCI-ER environment, we conducted the same simulation except with RIF = 1. The results are shown in Fig. 8.
We observe that all EFCI switches must endure very large MQLs. Also, the EFCI switches are often in a congested state. We do not like to see this situation. On the other hand, E R switches do not obtain any benefit
from
that.All ER
switchesmust endure larger MQLs. The utiliza- tion and fairness of all E R switches drop.
The Performance of CMM Is Better -
Finally, the performance comparisons in the homogeneous and mixed environ-
5 5 . . . I . 2 . '.' ... , : 3 3 5 5 5 4 4 ' . I . . ' ' ... 1 4 1 ... . . . 2 I ! EPKCA
I
CAPC CMM ' TMM j Ideal . , ' All EFCl itch: ER) _. ... it&: ER) . . . All CMM' _ I Table 3. Performance ranking of the various ER schemes in the homogeneous and mixed EFCI-ER environments.
51.83 25.92 25.92 j 100 I n this section, we want t o investigate the location at which ER switches should be placed in mixed EFCI-ER
50.35 ,29.10 118.47 i 7 1 . 3 environments. To save space, the CMM scheme is used to represent the various ER switches because of its good per-
49.39 25.33
I
23.13:
89.2-. I .--.; . formance. Some simulations are done on various configu-
40:43 26.ld.
;
28.25i
3S.u' , rations. From the simulation results, a few rules are given51.63 25.72
I
25.72I
99.2 ~...
. to help us place the ER switch in EFCI-ER environments.
;--I
... .... I I -. I 2000 1 GOO 1200 MOL1 (cclls):--y
2000 1 GOO:
1200 800 400I
A B C D U7 (I?!@ 401 -- I 2 0i(i
A F ('30) ... . ,..i j : .-l l
I.
B C -rl...h:
D A -- dll EFCl B EFCI-CMM C -- C M W E F C I D -- all ER j1
1i /
j i , l
B C D -. -. -Under this configuration, if thYe algo- rithm at the bottleneck switch is substan- tially more oscillatory than the algorithm at the nonbottleneck switch, the rate mis- match problem occurs, causing unfair- ness [20].
Most Critical vs. Least Critical: N I = 2,
N2 = 4,
1\13
= 2 ~ Under this configu-ration, the number of VCs passing through link 1 is 4, and the number pass- ing through link 2 is 6. First, we define the the term critical. The most critical
switch for a VC can be described as a switch that gives the source the lowest fair share based on the max-min fairness criteria. Similarly, the least critical switch
is the one that gives the highest fair share in th e VC's path. I n olur experiment, switch 1 is the least critical switch, switch 2 the most critical.
The simulation results are shown in Fig. 10. The total utilization of both switches (U1 +U2) of EFCI-CMM placement is higher than that of CMM-EFCI place- ment. Also, the fairness degree of EFCI- CMM is obviously larger than that of CMM-EFCI placement. Hence, we sug- gest that an ER switch ought to be placed at the most critical point first. This con- clusion is completely opposite to another
:& Figure 9. Comparison of the various switch schemes in the configziration ( N l = 0,
N2 = 2, N3 = 2).
IEEE Network Januarypebruary 1998 40
study in [21], which suggested that an E R switch should be placed a t the least critical point first because it can relieve the severe beat down problem more.
From Table 4, the throughput of G3 is actually higher when the E R scheme is imposed on the least criti- cal switch than when it is imposed on the most critical switch. Therefore, we
2000 1600 1200 800 400 ~~~ MQLI (cells)
2ooo1
1600 - - - . L 1200 800 400should place t h e E R switch a t the A B C D
least critical point in view of the beat down problem [21]. However, the
U2 (Yo)
100
extra bandwidth of G3 is mainly
obtained from the bandwidth released , 8o
by G1. In fact, much bandwidth is
60
wasted, while just a little bandwidth is used by G3.
40
Therefore, it is our opinion that an E R switch ought to be placed at the
20
most critical point first. This placement can produce smaller maximum queue length, a larger degree of fairness, and
:
higher throughput, although the beat I A B C D
MQLZ (cells) A B C D F (%) . . . . . . A U1 ~ B A -- all EFCI B -- EFCI-CMM C -- CMM-EFCI D -- all ER I
down problem remains serious.
Near Source vs. Netxr Destination:
N I =
2,
N2
= 2,N3
= 2 - I n this case, performance is better when theER switch is located near the source, from Fig. 11. This is because lots of E R schemes (except for CMM and TMM) record the information from the forward RM cell, and modi- fy the E R field on the: backward path. Hence, newer infor- mation is received at the ER switch, and quicker feedback is sent to the source when the E R switch is near the source. On the-other hand. the EFCI switch marks each forward
Figure 10. Conzparisoiz of the various switch scheines in the configuration (NI = 2, N2
= 4, N3 = 2).
data cell when congestion occurs, and does not do anything on th e backward path. Thus, when it is placed near th e source, the propagation delay increases, which causes slower response at the source.
Under the configurations described above, we can deter- mine how to place the E R switch. However, there may be some conflicts. For example, a backbone switch is generally the bottleneck and most critical Doint, and is
i
MQLl (cell:.) ; 1600'
I I:::\
400 I I I-
A B C CII
U2 (%) MQLZ (cells)2ooor---
1600 1200 800 400 A B C D F (%) A B C D ._ ._. also far from the source. Accoiding to the
simulation results (Figs. 9-11), we set the pri-
I
100 80 60 40 20 U1 ("h) A B C D A -- all EFCI D -- all ER B -- EFCI-CMM C--
CMM-EFCI . .-ority order as bottleneck > critical > dis- tance. That is, we feel that a backbone switch should be considered first to have ER capaci- ty. Nevertheless, ER switches should replace EFCI switches whenever possible everywhere in the network.
I There are a number of ways to further extend
research work on the interoperability issues dis- cussed in this article. The first is to conduct more simulation experiments in a larger vari- ety of configurations and under different traffic patterns. In particular, a performance compari- son in the presence of intermittent and greedy flows might be useful. Another is the interop- erability of the newly developed E R schemes and EFCI switches. Currently some new algo-
I
rithms to set the E R field have been devel-' oped [25-271. These algorithms should be
verified in heterogeneous environments. Last,
'
the interoperability among various E R switch-es is also worth research. After the transition from first- to second- generation switches, all
I
switches may be equipped with E R function.I
Figure 1 1. Comparison of the various switch schemes in tlze configuration (NI The cooperation
&
conflict among different ER schemes should be studied.= 2, N2 = 2, N3 =
L!).
References
[l ] ATM Forum, "ATM Forum Traffic Forum Traffic Management Specification Version 4.0," ATM Forum af-tm-0056.000, Apr. 1996.
[2] B. Flavio and W . F. Kerry, "The Rate-Based Flow Control Framework for the Available Bit Rate ATM service," I€€€ Nehvork, vol. 9, no. 2, Mar. 1995,
pp. 25-39.
[3] S . Floyd and A. Romanow, "Dynamics of TCP Traffic over ATM Networks," Proc. ACM Sigcomm '94, Sept. 1994, p[. 7:;88.
[4] C. M. Ozveren, R. Simcoe, and G. Varg ese Reliable and Efficient Hop-by- Hop Flow Control," lEE€ JSAC, vol. 13, no. 4, May 1995, pp. 642-50. [5] H. T. Kung and R. Morris, "Credit-Based Flow Control for ATM Networks,''
I€€€ Network, vol. 9, no. 2, Mar. 1995, pp. 40-48.
[6] R. Jain, "Congestion Control and Traffic Manu ement in ATM Networks: Recent Advances and A Survey," Comp. Nehvor% and ISDN Sys., vol. 28,
no. 13, Oct. 1996, pp. 1723-38.
[7] P. Newman, "Backward Explicit Congestion Notification for ATM Local Area Nehvorks," Proc. I€€€ GLOECOM, Dec. 1993, p
181 H. Ohsaki et al., "Rate-Based Congestion Control E r ATM Nehvorks," Comp.
71 9-23.
~~
Commun. Rev., Apr. 1995.
[9] D. Sisalem and H. Schulzrinne, "Switch Mechanisms for the ABR Service: A Comparison Study," http://www.lirmm.fr/utm/articles. html, June 1 996. [IO] A. Kolarov and G. Ramamurhy, "Comparison of ER and EFCl Flow Control
Scheme for ABR Service in Wide Area Networks," Proc. IFlP Broadband Commun., Apr. 1995.
[ I 1 1 L. Gerda and 0. Casals, "A Simulation Study of Switching Mechanisms for ABR Service in ATM Networks," interim rep. UPC-DAC-1996-21, Feb. 1996. [12] ITU-T SG 13, "Traffic Control and Congestion Control in B-ISDN," Draft
Rec. 1.371, Nov. 1995.
[13] H. Saito, ef al., "Performance Issues in Public ABR Service,'' I€€€ Commun. Mag., vol. 34, no. 1 1 , Nov. 1996, p
[14] N. Yin and M . G. Hluchy, "On &sed-Loop Rate Control for ATM Cell Relay Networks," Proc. F E E INFOCOM '94, 1994, pp. 99-1 08. [15] 1. Roberts, "Enhanced Proportional Rate Control Algorithm," ATM Forum
[16] R. Jain et al., "The ERICA Switch Algorithm: A Complete Description," ATM Forum 96-1 172, Aug. 1996.
[17] A. W . Barnhart, "Explicit Rate Performance Evoluotions," ATM Forum 94- 0983, Oct. 1994.
[18] A. Charny, K. K. Ramakrishnan, and A. Lauck, "Time Scale Analysis and Scalability Issues for Explicit Rate Allocation in ATM Networks," IE€€/ACM Trans. Nefworking, vol. 4, no. 4, Aug. 1996, pp. 569-81.
[19] D. H. K. Tsang and W. K. F. Wong, "A New Rate-Based Switch Algorithm for ABR Traffic to Achieve Max-Min Fairness with Analytical Approximation and Delay Adjustment," Proc. lE€E INFOCOM '96, 1996, pp. 1 174-81,
40-48.
94-0735R1, Aug. 1994.
[20] N. T. Plotkin and J. J. Sydir, "The Rate Mismatch Problem in Heterogeneous ABR Flow Control," Proc. IEEE INFOCOM '97, 1997.
[21] Y. Chang, N . Golmie, and David Su, "Stud of lnteroperability between EFCl and ER Switch Mechunisms for ABR Trafk in an ATM Network," Proc.
4th Inf'l Con[ Comp. Commun. and Nehvorks, 1995, pp. 31 0-1 5. [22] A. Arulambalam, X. Chen, and N. Ansari, "Allocating Fair Rates for Avail-
able Bit Rate Service in ATM Networks," IEEE Commun. Mug., vol. 34, no.
1 1, Nov. 1996, pp. 92-1 00.
[23] Y. C. Lai and Y. D. tin, "Performance Analysis of Rate-based Congestion Control Scheme and Choice of Hi h and Low Thresholds," Proc. 6th Int'l. Conf. Comp. Commun. and Nehvo$s, Sept. 1997, pp. 70-75.
[24] Y. C. Lai and Y. D. tin, "Performance Analysis of Rate-Based Flow Control under a Variable Number of Sources," Comp. Networks and ISDN Syst., to appear.
[25] F. M. Chiussi et a/., "Explicit Rate ABR Schemes Using Traffic Load as Con- gestion Indicator," Proc. 6th Int'l. Conf. Comp. Commun. and Nehvorks, Sept. 1997, pp. 76-84.
[26] L. Kalampoukas, A. Varma, and K. K. Ramakrishnan, "An Efficient Rate Allocation Algorithm for ATM Networks Providing Max-Min Fairness," Proc.
6th IFlP Inf'l. Conf. High Perf. Nehuorkhg, Sept. 1995. pp, 143-54. [27] A. Arulambalam, X. Chen, and N. Ansari, "An Intelligent Explicit Rate Con-
trol Algorithm for Available Bit Rate Services in ATM Networks," Proc. ICC
'97, June 1997, pp. 200-4.
5
iograph
ies
YUAN-CHENG LA ([email protected]) received B.S. and M.S. degrees in computer science and information engineering from National Taiwan University in 1988 and 1990, respectively. From 1992 to 1994 he was an associate researcher at the Computer and Communication Research Laboratories of the Industrial Technology Research Institute, Taiwan. He is currently finishin his Ph.D. in the Department of Computer and Information Science at Notional Cfiao Tung University. His research interests are in design, management, and analysis of ATM networks, queueing theoty, and multimedia communications.
YING-DAR LIN [MI ([email protected]) received a Bachelor's degree in com- puter science and information engineering from National Taiwan University in
1988, and M.S. and Ph.D. degrees in computer science from the University of California, Los Angeles, in 1990 and 1993, respectively. At the UCLA Computer Science Department, he worked as a research assistant from 1989 to 1993 and as a teaching assistant from 1991 to 1992. He ioined the faculty OF the Depart- ment of Computer and Information Science at National Chiao Tung University in August 1993 and is now associate professor. His research interests include design and analysis of high-speed LANs/MANs/WANs, traffic characterization, service and network management, ond network-centric computing.
IEEE Network Januarypebruary 1998