消費者間共鳴對購買意願之影響 - 政大學術集成
55
0
0
全文
(2) Acknowledgements I would like to express my great appreciation to those who give me a hand when I worked in my essay. First and foremost, I would like to thank to our supervisor of my essay, professor Shari Shang for valuable guidance and advice. She inspired me greatly to work in this project. Her willingness motivates us to contribute tremendously to my essay. Besides, I would like to thank her for showing us some example related to the topic of the essay. Without her effort, I couldn’t complete my essay on schedule. Second, I would like to thank the Management Information System in National Chengchi University for providing us with an excellent environment and atmosphere to study and complete my . 政 治 大. thesis. Department of MIS in NCCU is a good choice for everyone who wants to enrich himself or herself. Third, I would like to express my very great . 立. appreciation to my friends, including classmates in BPM lab, Nunu sisters for . ‧ 國. 學. their enthusiastic encouragement. In addition, I would like to offer my special thanks to senior students for giving me professional advice and valuable support. Finally, I would like to take this opportunity to thank my family for supporting . ‧. me during the preparation of my essay when I was in second year of graduate. . y. Nat. Moreover, I wish to thank Dennis Tu for his assistance with giving me advice on . n. er. io. al. sit. logistic skills and presentation tips used in essay. . Ch. engchi. 2 . i n U. v.
(3) 消費者間共鳴對購買意願之影響. 摘要 近幾年來,社群網路因為使用者的參與已逐漸熱門熱門,成為我們生活中不 可或缺的一部分。例如 Facebook、Youtube 以及 Flicker 都是目前使用者經常使 用的社群媒體平台,我們可以在平台上發表任何任何想法,並且透過平台與其他 使用者溝通。社群網路已經逐漸改變傳統人們的溝通方式,許多使用者再平台上. 政 治 大. 發表內容以及訊息,當訊息被許多使用者廣為討論以及分享,因此在平台上有著 所謂口碑的出現,也就是所謂的共鳴效應。本篇研究想了解使用者使用社群媒體. 立. 並是如何透過社群網路達到共鳴效應。. ‧ 國. 學. 本研究目的在於調查再社群網路上,何種因素會導致消費者去討論以及分享 訊息,也就是使用者間的共鳴,之後更進一步探討,當使用者間的共鳴發生時, 是否會影響到使用者的購買意願。本研究共蒐集了 410 份樣本並使用結構方程. ‧. 模型分析其樣本顯著與否。本研究結果發現其內容滿足、社會關係滿足與自我形. y. Nat. 象滿足都對共鳴有顯著影響,且共鳴對購買意願也有顯著影響。此外,本研究也. er. io. 意義。. sit. 執行分群分析將共鳴結果分為高共鳴與低共鳴兩族,分別探討其顯著指標與背後. al. n. v i n Ch 關鍵字:社群網路、消費者行為、使用與滿足、自我呈現、共鳴、購買意願 engchi U. 3 .
(4) An empirical study of the effects of customer resonance on purchase intention. Abstract In recent years, social network have become incredibly popular. Online communication platform such as Facebook, YouTube, and Flicker offer freely available user-generated content that enabled individuals to express their ideas and communicate their opinions to many people. People can create, modify, discuss, and share on social networks. Therefore, social networks have gradually become. 政 治 大. interpersonal communication platforms. Message resonated when information is shared among individuals. We want to have a better understanding of the use and. 立. gratification that users obtain from social networks when topic resonated among. ‧ 國. 學. them.. We collected the 410 sample and used the structural equation model analyzed our proposed model by using SPSS 21.0 and SmartPLS. Besides, we also used. ‧. K-means to partition our sample into two clustering and obtained the managerial. y. Nat. implications. In our research, we observed that content gratification, social relation. al. er. io. resonance also has influence on purchase intention.. sit. gratification and self-presentation gratification have impact on resonance and. n. v i n C h behaviors, UseUand gratification, Keywords: Social networks, Customer engchi Self-presentation, Resonance, Purchase intention. 4 .
(5) . Table of Contents. Acknowledgements ................................................................................... 2 摘要 ........................................................................................................... 3 ABSTRACT .............................................................................................. 4 TABLE of Contents .................................................................................. 5 List of Tables............................................................................................. 7 List of Figures ........................................................................................... 7 Chapter 1: Introduction........................................................................... 8 Chapter 2: Literature Review ............................................................... 11. 政 治 大 2.2 Use and Gratification 立 ............................................................................ 13. 2.1 Resonance .............................................................................................. 11. 2.3 Content Gratification ......................................................................... 15. ‧ 國. 學. 2.4 Social Relation Gratification ................................................................ 16 2.4.1 Tie Strength................................................................................................. 16. ‧. 2.4.2 Homophily .................................................................................................. 18. y. Nat. 2.4.3 Trust ............................................................................................................ 18. sit. 2.4.4 Interpersonal Influences .............................................................................. 19. al. er. io. 2.4.4.1 Normative Influences ........................................................................... 19. n. 2.4.4.2 Information Influences ......................................................................... 20. iv. n 2.5 Self-presentation Gratification ............................................................ 20 C i U. he. ngch 2.6 Purchase Intention ................................................................................ 21 Chapter 3: Methodology ........................................................................ 23 3.1 Research Design .................................................................................... 23 3.2 Research Variables ............................................................................... 24 3.3 Data Collection ...................................................................................... 24 3.4 Measurement ......................................................................................... 26 3.5 Data Analysis ......................................................................................... 26. Chapter 4: Research Results ................................................................. 28 4.1 Survey Administration ......................................................................... 28 4.2 Model Analysis ...................................................................................... 29 4.2.1 Measurement Model ................................................................................... 29 . 5 .
(6) . 4.2.2 Structural Model ......................................................................................... 32. 4.3 Cluster Analysis..................................................................................... 34 4.3.1 Cluster Method............................................................................................ 34 4.3.2 Cluster Results ............................................................................................ 35 4.3.3 Analysis Matrix of Demographic Information in Clustering...................... 37 4.3.3.1 Comparison and Differentiation of Clusters Based on Gender ........... 37 4.3.3.2 Comparison and Differentiation of Clusters Based on Platform Experience........................................................................................................ 38 4.3.3.3 Comparison and Differentiation of Clusters Based on Revenue ......... 38. 4.4 Summary Results .................................................................................. 39. Chapter 5: Discussion ............................................................................ 41. 政 治 大 5.2 Influence of Social-Network Sites on Customer Resonance.............. 41 立 5.3 Effects of Clustering on Customer Resonance ................................... 42 5.1 Overview of Research Finding ............................................................. 41. ‧ 國. 學. Chapter 6: Conclusions and Limitations ............................................. 44 6.1 Summary ................................................................................................ 44. ‧. 6.2 Research Limitations and Direction for Future Study ...................... 46 6.3 Research Contributions ........................................................................ 46. Nat. y. sit. n. al. er. io. Reference ................................................................................................. 48 APPENDIX. QUESTIONNAIRE ......................................................... 53. . Ch. engchi. 6 . i n U. v.
(7) . List of Tables Table 1.. Comparisons between resonance and word-of-mouth ........................... 11. Table 2.. Research design ............................................................................. 23. Table 3.. Research variables and definitions .................................................... 23. Table 4.. Data collection of different social network platforms ........................... 24. Table 5. Results of Pretest ........................................................................... 26 Table 6.. Demographic Information of Respondents ......................................... 27. Table 7.. Descriptive Statistics for Constructs .................................................. 29. Table 8.. Matrix of Individual Item Reliability ................................................. 29. Table 9.. Correlation Matrix of Key Construct ................................................. 31. Table 10.. Structural Equation Model Statistical Results of Research Model ......... 32. Table 11.. Clustering results by hierarchical clustering method ........................... 33. 政 治 大. Table 12. t-Test of Resonance in Dimensions ................................................. 34. 立. t-Test of Two Clustered Groups on Content Gratification ................... 34. Table 14.. t-Test of Two Clustered Groups on Social-Relation Gratification ......... 35. Table 15.. t-Test of Two Clustered Groups on Self-Presentation Gratification and. ‧ 國. 學. Table 13.. ‧. Purchase Intention ........................................................................................ 35 SEM Statistical Results of High Resonance Clustering ....................... 36. Table 17.. SEM Statistical Results of Low Resonance Clustering ..................... 36. Table 18.. Describing Resonance Clustering of Demographic in Gender Information. sit. y. Nat. Table 16.. er. io. .................................................................................................................. 37. al. n. v i n C.................................................................... Platform-Experience Information 38 hengchi U Table 20. Describing the Demographics of Resonance Clustering Based on Revenue Table 19.. Describing Resonance Clustering of Demographics in. .................................................................................................................. 38 Table 21.. The effect of demographic variables on resonance by Chi Square test. .................................................................................................................. 39 Table 22. Summary Results in Clustering....................................................... 40. List of Figures Figure 1.. Differentiation between resonance and word-of-mouth ....................... 12. Figure 2.. Constructs Definition and Research Framework ................................. 22. Figure 3.. PLS Research Results of Research model ......................................... 32. . 7 .
(8) . Chapter 1 Introduction Social media is referred to as consumer-dominated media that enables customers to converse online (Mangoldand Faulds 2009). There are many social media activities such as creating, modifying, discussing, and sharing Internet content (Kietzmann et al. 2011). Many types of platforms including blogging, microblogging, and social networks exist on social media (Hoffmanand Fodor 2010). In recent years, social networks have become incredibly popular. Social networks are generally defined as interactive communication environments that engage customers to express their opinions, exchange their experiences, disseminate messages, and share and reply to posts. We will discuss issues such as today news or characteristics of new products on. 政 治 大. close group of Facebook, Mobile 01 or other social network sites. These social networks have created a transition in interpersonal communication—away from. 立. traditional face-to-face and word-of-mouth interaction toward new forms of online. ‧ 國. 學. communication referred to as electronic word-of-mouth such as user-generated content (Goh et al. 2013; Mangoldand Faulds 2009). Previous studies have found that customers tend to trust user-generated content, such as recommendations of products. ‧. reviews from customers on social media more than messages posted by businesses in. y. Nat. traditional media (Goh et al. 2013). There is a shift of information control from. sit. business to customers (Mangoldand Faulds 2009). Customers feel empowered to. er. io. spread of information. One customer agrees with the information and then shares it. al. n. v i n and then separately share it withC others h eonline. h i U social media can rapidly n g cTherefore, facilitate information sharing on the social network (Stieglitzand Dang-Xuan 2013).. with others online. In some cases, hundreds of customers agree with the information. Messages resonate when information is shared among individuals. This resonance phenomenon means that people will provide feedback such as sharing or replying when they are interested and pay more attention to specific topics. Moreover, social media can influence various kinds of consumer behavior such as raise awareness, transfer information, express opinions, and purchasing behavior (Mangoldand Faulds 2009). Goh et al. (2013) indicate that word-of-mouth is one of the key drivers in customer purchases. Social media is a social platform that is available to anyone with Internet access. From the perspective of business, marketing on social media focuses on content that attracts attention from others and encourages them to share information. From the research of Goh et al. (2013), more then 1.5 million businesses set up fan pages on . 8 .
(9) . social networks to reach and engage customers to spread information about their products and services. This form of word-of-mouth marketing refers to marketing that results naturally from social media rather than from paid media from corporations. However, from the viewpoint of customers, resonance is more likely to occur on social networks, with more interaction and communication between individuals. User-generated content, which is the observed output of consumers’ engagement, is typically called word-of-mouth buzz generated by customers and is mainly composed of social networks (Goh et al. 2013; Kaplanand Haenlein 2010). Previous researchers have found that user-generated content has a strong impact on market-generated content (Goh et al. 2013). People will observe the number of reviews, replies, and the number of people sharing in user-generated content before they make purchases (Goh. 政 治 大. et al. 2013). Goh et al. (2013) indicate that people are more likely to believe user-generated content when they make repeat purchase decisions. Thus, comments or. 立. posts of specific messages of products from customers on social media may affect. ‧ 國. 學. other customers purchase intentions and decisions. However, Riegner (2007) found that online word-of-mouth does not always result in the intention to buy. Sixty-one percent of users were influenced by offline sources such as browsing in a retail store. ‧. rather than influenced by online word-of-mouth. This research suggested several. y. Nat. reasons why consumers are not affected by online word-of-mouth (Riegner 2007).. sit. First, consumers want to see and touch items that they want to buy (Riegner 2007).. er. io. Second, some user-generated content has too much emotional attachment to the. al. n. v i n personal and confidential detailsClimit U on purchasing decisions h euser-generated n g c h i content (Riegner 2007). For example, some customer reviews about drug use would not product resulting in people not believing the reviews (Riegner 2007). Third, some. directly affect other customer intentions to buy and use. The conclusion indicates that word-of-mouth does not affect individuals’ purchase intention. According to the above discussion, we want to learn whether customer resonance with another form of customer word-of-mouth behavior has an impact on intention to buy. As a new communication paradigm, social media plays an important role in promoting information dissemination on social networks (Stieglitzand Dang-Xuan 2013). The purpose of this study is to investigate what drives people to share or reply to content on social networks while customers’ resonance arises and understand the impact of customer resonance on purchase intention. Below are the research questions we will investigate:. . 9 .
(10) . RQ1. What factors may have an influence on customer resonance on a social network? RQ2. What effects does customer resonance have on purchase intentions? We want to have a better understanding of the use and gratification that users obtain from social networks when topics resonate with them. In order to do so, we created a research model based on a use and gratification perspective. We wanted to understand different types of gratification underlying social media usage. We predict that content gratification, social-relation gratification, and self-presentation gratification will have an influence on customer resonance. Content gratification is based on the perspective of Kaplanand Haenlein (2010), who state that user-generated. 政 治 大. content is the main component for people using social media. Social networks are made up of varieties of individuals’ relations. Hence, social-relation gratification is. 立. based on the viewpoints of Chuand Kim (2011), who state that people who use social. ‧ 國. 學. networks want to build and maintain social relations in their personal networks. People who want to communicate with others create personal pages as a form of self-presentation. Based on the perspective of Schauand Gilly (2003), many activities. ‧. on social networks could be viewed as a type of self-presentation. Once customer. y. Nat. resonance is generated, we want to learn whether the resonance arising between. sit. customers has an impact on purchase intention. We will conceptualize and develop. er. io. independent variables to explore different types of gratification, customer resonance,. al. n. v i n The outline of the researchC is h as follows. The firstUsection provided a literature engchi. and purchase intentions.. review on resonance with an emphasis on sharing and replying in customer online behavior regarding several factors arising from resonance and customer. online-purchase intentions. We also made some hypotheses. In the subsequent section, we then presented the methodology. Then we collected the data and analyzed it to make a conclusion.. . 10 .
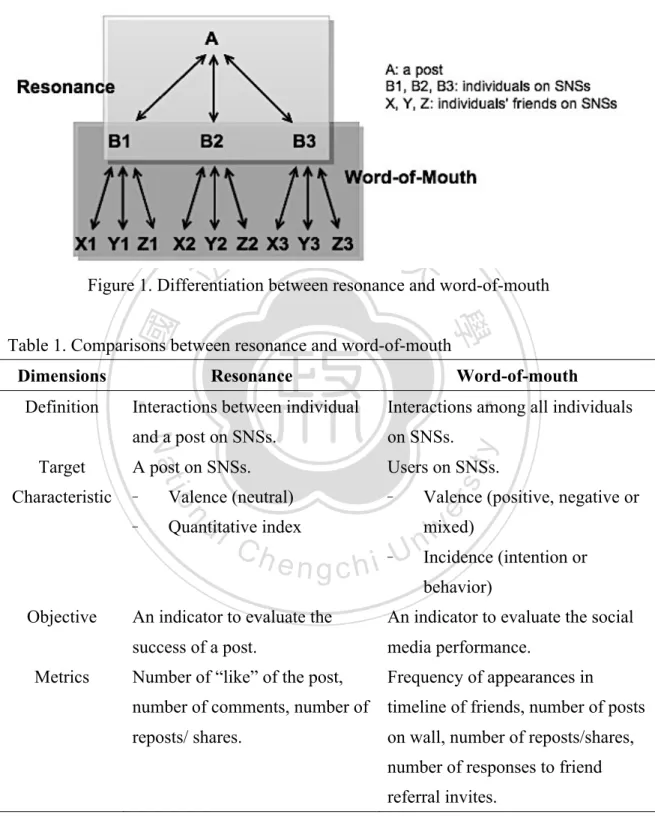
(11) . Chapter 2 Literature Review 2.1 Resonance Online communities such as Facebook, Youtube, and Flicker offer freely available user-created content that has enabled individuals to express their ideas and communicate their opinions to many people (Riegner 2007). When people are interested in a topic, they are more likely to discuss and share messages, thus creating resonance. The phenomenon of resonance is caused by massive responses that are triggered by someone who makes a posting and others react quickly (Gruhl et al. 2004). We will discuss the phenomenon of resonance from the perspectives of social media, business, and individuals.. 政 治 大. From the perspective of social media, Solis (2010) defines resonance as successfully sharing social objects such as posts, pictures, and videos. Resonance. 立. means the speed and degree at which social objects change hands (Solis 2010).. ‧ 國. 學. Regarding the Twitter platform, Liand Shiu (2012) stated that resonance is the interaction between users and sponsored tweets such as retweets, replies from the perspectives of advertising, and so on. From the perspective of business, Solis (2010). ‧. states that there are three critical-path stages of social media: relevance, resonance,. y. Nat. and significance to achieve social-media business goals. Businesses first need to make. sit. their message relevant concerning their products or services, which can then attain. er. io. resonance with customers (Solis 2010). The transition from relevance to resonance is. al. n. v i n empathy on social media (Solis C 2010). based on the viewpoints of h eAtnleast, gchi U. sharing, which is motivated by individuals incentivized by thoughtfulness, values, and individuals, resonance is a cognitive engagement when an audience participates in media (Russell 2009). In addition, resonance is a pre-conditional behavior of word-of-mouth. Word-of-mouth refers to a customer-to-customer interaction that describes interactions among customers in online environments (Libai et al. 2010). Once a customer is aware and engaged, he or she will have a willingness to communicate with others (Hoffmanand Fodor 2010). Word-of-month can be evaluated either from perspective of valence or incidence (De Matosand Rossi 2008). As for the perspective of valence, word-of-month is divided from positive, negative and mixed. Word-of-month could be seen a form of intention or behavior. Regardless of whether the person is satisfied or dissatisfied, they share their attitudes, opinions by posting, replying or even sharing. The differentiation of resonance and word-of-mouth is explained in Figure 1. Resonance is simply a behavior between user . 11 .
(12) . and a post on the social networks. Hence, resonance is focus on individual level. On the other hand, word-of-mouth is a form of interaction among all users on the social networks and indicate on large-scale groups on the social networks. We compare the resonance and word-of-mouth to make a conclusion in table 1.. 政 治 大. 立. Figure 1. Differentiation between resonance and word-of-mouth. ‧ 國. 學. Table 1. Comparisons between resonance and word-of-mouth. and a post on SNSs.. on SNSs.. A post on SNSs.. Users on SNSs.. Objective Metrics. al. . n. . Valence (neutral) Quantitative index. Ch. engchi. sit. . y. Interactions among all individuals. io. Characteristic. Interactions between individual. Nat. Target. Word-of-mouth. Valence (positive, negative or. er. Definition. Resonance. ‧. Dimensions. mixed) iv n U Incidence (intention or behavior). An indicator to evaluate the. An indicator to evaluate the social. success of a post.. media performance.. Number of “like” of the post,. Frequency of appearances in. number of comments, number of. timeline of friends, number of posts. reposts/ shares.. on wall, number of reposts/shares, number of responses to friend referral invites.. Based on the above perspectives, we defined resonance as the interactions such as pressing like button, sharing and replying between individuals and posts on a social. . 12 .
(13) . networks platform. Resonance is the phenomenon of a message going through on social media. So resonance could be seen as an indicator to evaluate the success of a post. When strong resonance occurs, messages resonate more and reach a larger audience on social media platform. Previous researchers have used the repost rate as an indicator to evaluate the behavior of sharing about resonance on online platforms (Liand Shiu 2012). Hoffmanand Fodor (2010) indicated that metrics such as the number of reposts/shares and number of responses could be seen as a performance evaluation of resonance on social networks. What is sharing and replying? Sharing is one of the functional blocks in social media and a process that exchanges, distributes, and receives information (Kietzmann et al. 2011). Sharing will lead individuals to converse and create a. 政 治 大. relationship. Moreover, sharing is a behavior of resending a message posted by another user. If a user finds an interest in a post written by another user and they want. 立. to share, they can share the message by copying the message or adding some. ‧ 國. 學. comments (Stieglitzand Dang-Xuan 2013). This sharing behavior may represent responding to one’s posting, agreeing with someone’s view, or entertaining a specific audience (Stieglitzand Dang-Xuan 2013). For example, retweeting on Twitter is a. ‧. mechanism of information-sharing behavior and users are more likely to retweet a. y. Nat. tweet that has a similar viewpoint (Stieglitzand Dang-Xuan 2013). Replying is one of. al. er. io. by others. It is mutual communication feedback.. sit. form of communication. People can add their opinion when they see content posted. n. v i n Ch discussions (Riegner 2007). Thus, people will reply toU e n g c h i messages to gain more information or they may share messages to spread information. Individuals that share Consumers who have emotional and useful benefits tend to participate in online. information with their friends enhance the resonance on network platforms because individuals select, judge and deliver information to their friends whose friend think they will like (Liand Shiu 2012). In addition, Libai et al. (2010) state that one of the most important results of customer engagement is that people are influenced directly or indirectly by engaged customers. So we want to study what factors motivate individuals to share and how those factors then affect other customers in online environments.. 2.2 Use and Gratification Use and gratification (U&G) theory was proposed by Katz (1959) and developed based on the social and psychological needs that generated expectations of the media . 13 .
(14) . (Chungand Austria 2010). The theory explains that people have different gratification needs that result in different patterns of media usages (Katz 1959). The most important thing is what people do with media not what media does with people (Katz 1959). In a new technology environment, there are many choices of mass communication venues such as the Internet to activate audiences to select and satisfy their needs (Ruggiero 2000). Therefore, U&G suggests that different choices of media usage are used according to peoples’ needs in order to satisfy their demands. In sum, different peoples’ motivations result in different media usage. Use and gratification theory speculates that people are goal directed with regard to their needs and motivations. Social and psychological literature has indicated five categories of use and gratification needs that result in people using mass media (Katz. 政 治 大. et al. 1973; Sangwan 2005). These needs include functions of cognitive, affective, social integrative, personal integrative, and tension release (Katz et al. 1973; Sangwan. 立. 2005). Cognitive needs are related to acquiring information for knowledge or a better. ‧ 國. 學. understanding. Affective needs are related to aesthetic, pleasurable, and emotional experiences. Social-integrative needs are related to contact with family, friends, and others. Personal-integrative needs are related to the desire for an individual to be more. ‧. credible and confident of their status. Tension-release needs are related to escape.. y. Nat. Hirschmanand Holbrook (1982) classify two dimensions that include utilitarian. sit. and hedonic value in the area of consumer consumption. Information is one of the. er. io. most important dimensions in use and gratification theory for users of social networks. al. n. v i n C himportant roles forUusers’ browsing information on and hedonic values in content play engchi (Bonds-Raackeand Raacke 2010). Jahnand Kunz (2012) mention that the functional social-network fan pages. Thus, cognitive needs and affective needs could be. categorized into two values of content gratification here. Chuand Kim (2011) stated that social relationship-related factors are crucially related to all activities on social network platforms. The components of social relationships on a social network are tie strength, homophily, trust, and interpersonal influence (Chuand Kim 2011). Therefore, social-integrative needs are related to social-relationship gratification. Tufekci (2008) states that people participate in activities on social networks because customer behavior could be recognized as a form of self-presentation as theorized by Goffman (2002). Hence, personal-integrative needs could be seen as self-presentation gratification. Exploring customer resonance, we think that the motivation of escape in tension-released needs is not feasible. So we discard this construct and do not discuss it here. Therefore, to view customer resonance on social media, we divide it into three . 14 .
(15) . dimensions of gratification: content gratification, social-relation gratification, and self-presentation gratification.. 2.3 Content Gratification The most important reason that people take part in social networking is to gather information or provide information to others (Foster et al. 2010). Without the limits of online space and time, information could be offered anytime or anywhere on the social network. According to Hirschmanand Holbrook (1982), consumer consumption is divided into utilitarian and hedonic by their perceived values. Hence, in the field of content area, we divide the utilitarian and hedonic function into two values delivered on the social network. For instances, people are more likely to talk about iPhone. 政 治 大. products on customer reviews online, because iPhone information is equipped with utilitarian value and hedonic value. For utilitarian information, the iPhone is easy to. 立. use, having a lot of useful functions and being portable. Discussing the iPhone may. ‧ 國. 學. make you feel as if you are a specialist in the field of iPhones on a social network. On the other hand, the iPhone has an attractive design. If you have an iPhone and discuss it online, it might make you feel cool. Therefore, people will discuss specific topics. ‧. with each other for utilitarian value as well hedonic value according to their purpose.. y. Nat. Utilitarian is one dimension through which to evaluate consumer attitudes. sit. (Batraand Ahtola 1991). Blochand Richins (1983) define utilitarian value as a. er. io. customer-involving process such as collecting information out of necessity rather than. al. n. v i n C h consumptive object (Babin et al. 1994). It is a cognitively e n g c h i U that means “how useful or recreation. Utilitarian value is mostly relevant to “an errand,” “work,” or “useful”. beneficial the object is.” Based on an information perspective, Jin et al. (2009) also define information usefulness as the degree to which information is perceived by. individuals to be helpful and informative. Thus, the utilitarian value of content means how useful or beneficial the information is on social networks (Batraand Ahtola 1991). For example, individuals are more likely to talk about topics when they feel they are well informed (Mangoldand Faulds 2009). Hence, we consider that when more detailed information exists, people might be more willing to discuss and share the message. Thus, the following hypothesis is developed: H1A: The utilitarian value of content is positively related to resonance on social networks.. . 15 .
(16) . The other dimension through which to evaluate consumer attitudes is hedonic value (Batraand Ahtola 1991). Hirschmanand Holbrook (1982) defined hedonic consumption as involving emotional arousal and feelings such as joy, jealousy, fear, rage, and rapture. It is a cognitively consumption object meaning “how pleasant and agreeable those associated feelings are.” Therefore, the hedonic value of content means how pleasant and agreeable the feelings associated with the benefits of information on social networks (Batraand Ahtola 1991). In the online environment, content often reflect an author’s emotional state such as someone’s evaluation or judgment about a topics or product (Stieglitzand Dang-Xuan 2013). In addition, content that is fun, surprising, highly visible, with emotional attributes is more likely to promote conversation and sharing of. 政 治 大. information (Mangoldand Faulds 2009). Mangoldand Faulds (2009) state that people like to discuss something that they feel is outrageous or something that makes them. 立. feel special. So emotional messages are a successful factor in getting customers to. ‧ 國. 學. pass messages along (Dobele et al. 2007). For example, Stieglitzand Dang-Xuan (2013) find that emotional Twitter messages tend to be retweeted quickly and more often than neutral messages. In other words, customers are more likely to tell others. ‧. things they are emotionally connected to. In sum, researchers have suggested that. y. Nat. emotional content is a main driver of information diffusion that results in user. sit. information-sharing behavior (Stieglitzand Dang-Xuan 2013). Thus, the following. n. al. er. io. hypothesis is developed to understand the relationship between information of. i n U. v. hedonic value on sharing and replying behavior in relation to customer resonance.. Ch. engchi. H1B: The hedonic value of content is positively related to resonance on social networks.. 2.4 Social Relation Gratification Chuand Kim (2011) developed a conceptual model of social relation that has an influence on customer engagement that includes five factors: tie strength, homophily, trust, and normative and informational-interpersonal influence are all important factors resulting in word-of-mouth behavior.. 2.4.1 Tie Strength Tie strength refers to ‘the potency of the bond between members of a network’ (Mittal et al. 2008). Researchers divided strength of a relationship can be divided . 16 .
(17) . strong and weak relation and users are connected not only by one type of relationship (Granovetter 1973; Kietzmann et al. 2011). Strong ties such as close friends or family means that we develop deep relationships with these people and a strong tie of social relation means that we are within an individual’s personal network in order to provide substantive and emotional support (Piggand Crank 2004). One the other hand, weak ties such as acquaintances seeking information on specific topic are those that we would not develop a deep relationship with and weak ties of social relation are often among weaker and less personal social relationships (Piggand Crank 2004). In terms of social media, relations that are associations between individuals that connect them and converse is an important function (Kietzmann et al. 2011). We can classify tie strength to strong ties and weak ties by previous research definitions of. 政 治 大. social ties on social networks (Granovetter, 1973). While customer browsing on social networks, choices of different kinds of products may be influenced by both stable and. 立. intimate “strong-tie” interactions and randomly or remotely connected “weak ties”. ‧ 國. 學. (Chuand Kim 2011). For example, friendships on YouTube could be seen as based on users’ interests and tastes (Susarla et al. 2012). Users can follow their friends or classmates to learn about their online actions. This is called a strong tie. On the other. ‧. hand, users can communicate with people whose identity they may not know to. y. Nat. acquire information. In other words, we consider that strong ties definitely have an. sit. impact between individuals or groups replying to posts from their friends, but the. er. io. anonymous characteristic of weak ties on social network sites will make individuals. al. n. v i n C hties of perceived tie-strength Based on strong ties and weak value would engchi U motivate individuals to exchange information with one another and to expand content more willing to express their opinions or share posts with their friends.. out, thereby creating resonance. Weak ties act as a bridge function that allows information to disseminate and propagate among people and strong ties are more likely to be activated for recommendation behavior (Chuand Kim 2011). Therefore, the following hypothesis is developed to understand the relationship between tie strength and customer resonance on social networks. H2A: The tie strength of a social relation is positively related to resonance in a social network.. . 17 .
(18) . 2.4.2 Homophily The definition of homophily is the degree to which individuals who interact with others have certain similar characteristics (Rogersand Bhowmik 1970). Prior research suggests that people and groups are likely to have same socio-demographic characteristics such as age, gender and race (Gilly et al. 1998). They also have and share the same attitudes and beliefs (Festinger 1962). So the connections that exist between them are often based on having similar characteristics such as attitudes or interests (Gremler et al. 2001). In an online environment, Sheldon (2008) indicates that individuals like to find others with similar interests and with whom they feel would be a member of their community. Sometimes people spread an online message because they want to meet. 政 治 大. others who share their interests (Riegner 2007). For example, on YouTube’s social network platform people who reply and share user-generated contents such as videos. 立. based on user interests could be characterized as a phenomenon of homophily. ‧ 國. 學. between users (Susarla et al. 2012).. From the perspective of sociology, people who feel a high level of similarity tend to form relationships (Gremler et al. 2001). In addition, individuals are more. ‧. likely to communicate and interact with those who share similar attributes (Mouw. y. Nat. 2006). In other words, interpersonal communication often happens under conditions. sit. in which two individuals have similar preferences (Chuand Kim 2011). According to. n. al. er. io. the above discussion, the following hypothesis is developed to understand the. i n U. v. relationship between homophily and customer resonance on social networks.. Ch. engchi. H2B: Homophily within a social relation is positively related to resonance in a social network.. 2.4.3 Trust Trust is defined as a willingness to rely on an exchange with partners in whom one has confidence (Moorman et al. 1993). Morganand Hunt (1994) also define trust as the perception of confidence in the exchange partner’s reliability and integrity and state that trust can be seen as an important factor to maintaining successful relationships. In an online virtual community, trust is an essential factor for individuals who take part in exchange messaging to other members (Jarvenpaa et al. 1998). In social media, reputation helps to identify the status of others and is considered a matter of . 18 .
(19) . trust, referring to people and content (Kietzmann et al. 2011). The reputation of a video may be based on the “counts of views,” “ratings” or “number of comments and replies” on the YouTube platform content (Kietzmann et al. 2011). Thus trust is one factor that affects customer-engagement behavior in a customer-based relationship (Van Doorn et al. 2010). From the users in online environments, Ridings et al. (2002) suggest that trust plays an important role in disseminating messages or exchanging information. Most individuals on social networks are relatively invisible rather face-to-face; thus, it is hard to communicate or share information. As a result, a higher level of trust will lead to a higher level of word-of-mouth behavior (De Matosand Rossi 2008). We assume that trust can create an open atmosphere in which communication and sharing are. 政 治 大. more likely to occur. Therefore, the following hypothesis is developed to understand the relationship between trust and customer resonance in social networks.. 立. ‧. ‧ 國. network.. 學. H2C: Trust within a social relation is positively related to resonance in a social. 2.4.4 Interpersonal Influence. y. Nat. Interpersonal influence is an important social factor that affects customer. sit. decision-making (Chuand Kim 2011; D’Rozarioand Choudhury 2000; Parkand Lessig. n. al. er. io. 1977). Interpersonal influence could be classified into two dimensions: normative. i n U. v. influences and informational influences (Bearden et al. 1989).. Ch. 2.4.4.1 Normative Influences. engchi. The definition of normative influences is the idea of corresponding to expectations from others, which affects attitudes, norms and values (Burnkrantand Cousineau 1975). People who have a high level of normative influence are more likely to correspond to others’ expectations and seek others’ approval (Chuand Kim 2011). In the online environment, Dholakia et al. (2004) have mentioned that individuals hope to receive acceptance and approval from other members. Many individuals take part in activities to escape their loneliness, find other members who have similar interests, or obtain approval from others (Dholakia et al. 2004). For instance, people taking part in YouTube could be seen as representing a form of. . 19 .
(20) . normative influence because users customize their personal pages in order to obtain peer recognition from interacting with other users (Susarla et al. 2012). From the perspective of users, Riegner (2007) mentions that people want to spread their message because their friends are talking about it. According to the studies discussed above, we consider that people who refer to a high degree of normative influence tend to communicate, reply, or share information because they want to be accepted or find others who have the same interests. Thus, the following hypothesis is developed to understand the relationship between normative influences and customer resonance on social networks. H2D: Normative influences of a social relation are positively related to resonance in a social network.. 立. 政 治 大. 2.4.4.2 Informational Influences. ‧ 國. 學. The definition of informational influence is the tendency to accept information from others and the degree to which an individual is directed to search topics, products, or brand (Bearden et al. 1989; Deutschand Gerard 1955). People who have a. ‧. high level of informational influence tend to gain more social benefits such as. y. addition, Chuand Kim (2011). state that people who with a high level of. sit. Nat. friendship, supports, or knowledge in an online environment (Dholakia et al. 2004). In. al. er. io. informational influence are likely to obtain information and acquire useful contacts. n. v i n C h people who refer According to the above viewpoints, e n g c h i U to a high degree of. from others while they seek or decide whether to buy.. informational influence tend to communicate, reply, or share information because they want to obtain more useful information from others in social networks. The following hypothesis is developed to understand the relationship between informational influences and customer resonance on social networks. H2E: Informational influences of social relation are positively related to resonance in a social network.. 2.5 Self-presentation Gratification Self-presentation is built as identity and social performance in Goffman’s theory and defined such that people want more self-assurance and personal identity in a. . 20 .
(21) . social environment (Jahnand Kunz 2012). People who display signs and symbols would communicate their desired impression to others (Schauand Gilly 2003). In recent years, social networks have become popular platforms for people to express themselves on. Tufekci (2008) has found that there are many activities on a social network that can be seen as a form of self-presentation according to the theory by Goffman (2002). People are willing to talk about certain topics online when those issues may present the way they want others to see them or sustain their desired self-image to others in a social network (Kaplanand Haenlein 2010; Mangoldand Faulds 2009). With the ease of creating a personal page, individuals engaging in the YouTube platform could be seen as self-expressive to others (Susarla et al. 2012). For example, users who upload videos and make comments could be seen as engaging in. 政 治 大. a self-image on YouTube (Susarla et al. 2012). We suppose that if people have a strong intention to intensify their self-image, they communicate through talking more. 立. often, replying to posts from others, or even sharing posts or messages. Thus, the. ‧ 國. 學. following hypothesis is developed:. H3: Self-presentation is positively related to resonance in a social network.. ‧ y. Nat. 2.6 Purchase Intention. sit. Purchase intention is a result of pre-purchase satisfaction (Chen et al. 2010). In. er. io. an online environment, consumers could be influenced by information on purchasing. al. n. v i n C h which is anotherUform of word-of-mouth that information generated by customers, engchi would influence both an online and offline purchase (Riegner 2007). Meanwhile, a decisions (Mangoldand Faulds 2009). In reality, user-generated content is online. previous researcher has suggested that word-of-mouth is more likely to affect purchase intention when an item is more expensive and valuable (Riegner 2007). Sharing action in resonance is one word-of-mouth content-creation activity that influences purchasing decisions (Riegner 2007). An example of this is the social-shopping service Groupon, which sells discounts to customers online. These types of corporate make use of mapping a user’s connectivity to share discount information on a social network (Kietzmann et al. 2011). The sharing of customer behavior leads to purchase intention and then to purchase. Form the perspective of customers, Mangoldand Faulds (2009) mention that using search information to make purchase intentions in social media is a trustworthy platform through which to obtain information about products and services. Jin et al. . 21 .
(22) . (2009) state that individuals read comments or opinions posted by other users before they make a purchase intention. Therefore, user clicking Like button, replying or even sharing posts means they read information from the post when they engage in social networks. Thus, we consider that people who search and see user-generated content with higher volumes of resonance behavior such as clinking Like button, replying or sharing will lead to a higher- purchase intention. So the following hypothesis is developed: H4: Resonance in a social network is positively related to purchase intention.. 立. 政 治 大. ‧. ‧ 國. 學. n. er. io. sit. y. Nat. al. . Ch. engchi. 22 . i n U. v.
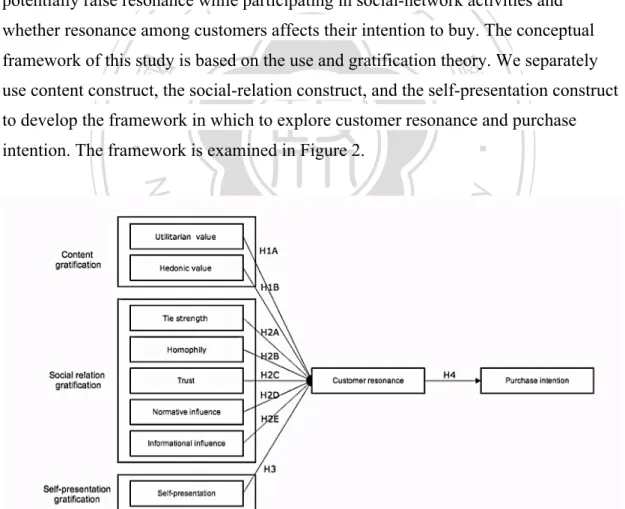
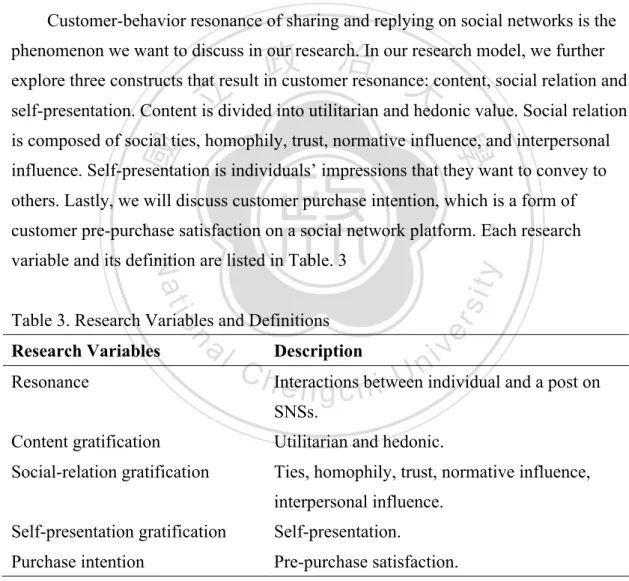
(23) . Chapter 3 Methodology 3.1 Research Design We conducted the experimental method, which is a subcategory in quantitative research to design our research. We used the online questionnaire tool - “Typeform” in virtual lab to invite the users who have experiences in using social networks sites to attend the survey. We disseminated the online questionnaire to social network platform such us Facebook, Mobile 01 and BBS. The collecting period was from March to April and we planed to collect the 400 samples. After collecting the sample, we adopt the two steps structural equation modeling approach to verify the relationships among the constructs. All details are in Table 2.. 政 治 大. This objective of study is to describe a better understanding of what factors potentially raise resonance while participating in social-network activities and. 立. whether resonance among customers affects their intention to buy. The conceptual. ‧ 國. 學. framework of this study is based on the use and gratification theory. We separately use content construct, the social-relation construct, and the self-presentation construct to develop the framework in which to explore customer resonance and purchase. ‧. intention. The framework is examined in Figure 2.. n. er. io. sit. y. Nat. al. Ch. engchi. i n U. v. Figure 2. Constructs definition and research framework. . 23 .
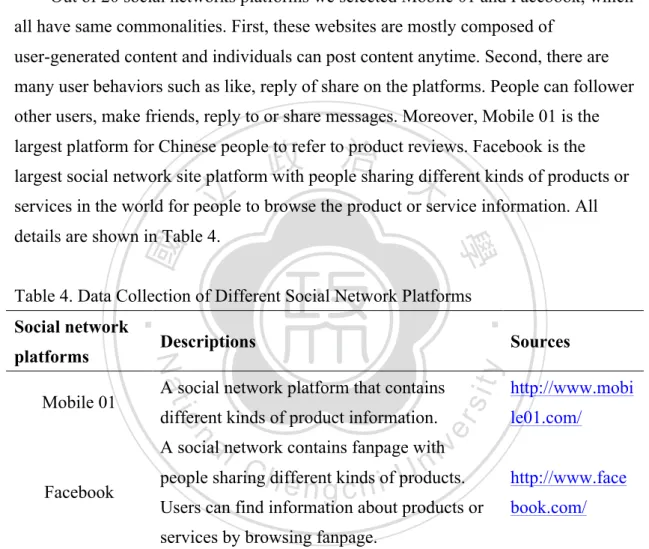
(24) . Table 2. Research design Dimensions. Research design. How. Adapting the experimental method research in virtual lab to disseminate the online questionnaire on SNSs.. Who. Targeting the users who have experiences in using SNSs.. Where. Social network sites such as Facebook, Mobile 01 and BBS.. When. March 2014 to April 2014.. Analysis Method. The two steps structural equation modeling approach.. 3.2 Research variables Customer-behavior resonance of sharing and replying on social networks is the. 政 治 大. phenomenon we want to discuss in our research. In our research model, we further explore three constructs that result in customer resonance: content, social relation and. 立. self-presentation. Content is divided into utilitarian and hedonic value. Social relation. ‧ 國. 學. is composed of social ties, homophily, trust, normative influence, and interpersonal influence. Self-presentation is individuals’ impressions that they want to convey to. ‧. others. Lastly, we will discuss customer purchase intention, which is a form of customer pre-purchase satisfaction on a social network platform. Each research. Resonance. al. n. Research Variables. sit er. io. Table 3. Research Variables and Definitions. y. Nat. variable and its definition are listed in Table. 3. v i n C hInteractions between e n g c h i U individual and a post on Description SNSs.. Content gratification. Utilitarian and hedonic.. Social-relation gratification. Ties, homophily, trust, normative influence, interpersonal influence.. Self-presentation gratification. Self-presentation.. Purchase intention. Pre-purchase satisfaction.. 3.3 Data collection We will focus on two social media platforms that provide user-generated content in which customer can discuss new products or recommendations for product categories. The social network platforms we selected not only have user-generated . 24 .
(25) . content but also comprise of many user behaviors such as like, reply of share on the platforms. We will then separately offer four kinds of questionnaires for each social network platform to customers. For each questionnaire, we will provide one type of user-generated content such as product reviews to other users who are engaged in social network platforms to browse and ask them to answer questions on the questionnaire. We assumed to collect a total of 400 questionnaires. Out of 20 social networks platforms we selected Mobile 01 and Facebook, which all have same commonalities. First, these websites are mostly composed of user-generated content and individuals can post content anytime. Second, there are many user behaviors such as like, reply of share on the platforms. People can follower other users, make friends, reply to or share messages. Moreover, Mobile 01 is the. 政 治 大. largest platform for Chinese people to refer to product reviews. Facebook is the largest social network site platform with people sharing different kinds of products or. 立. services in the world for people to browse the product or service information. All. ‧ 國. 學. details are shown in Table 4.. Table 4. Data Collection of Different Social Network Platforms Sources. y er. different kinds of product information.. sit. A social network platform that contains. io. Mobile 01. Descriptions. Nat. platforms. ‧. Social network. al. n. v i n C different kinds of products. people sharingh engchi U. http://www.mobi le01.com/. A social network contains fanpage with Facebook. Users can find information about products or. http://www.face book.com/. services by browsing fanpage. Questionnaires are developed to evaluate the relationships among different kinds of gratifications, customer resonance toward user-generated content, and purchase intention. For the constructs of our framework, data will be collected by online survey questionnaires according to different kinds of social network platforms and customers. The questions in the questionnaire would include five constructs. The first three are related to gratification that comprises content, social relation, and self-presentation on a social network. The next is concerned with customer-resonance behavior and the last is concerned with intention to buy on social networks.. . 25 .
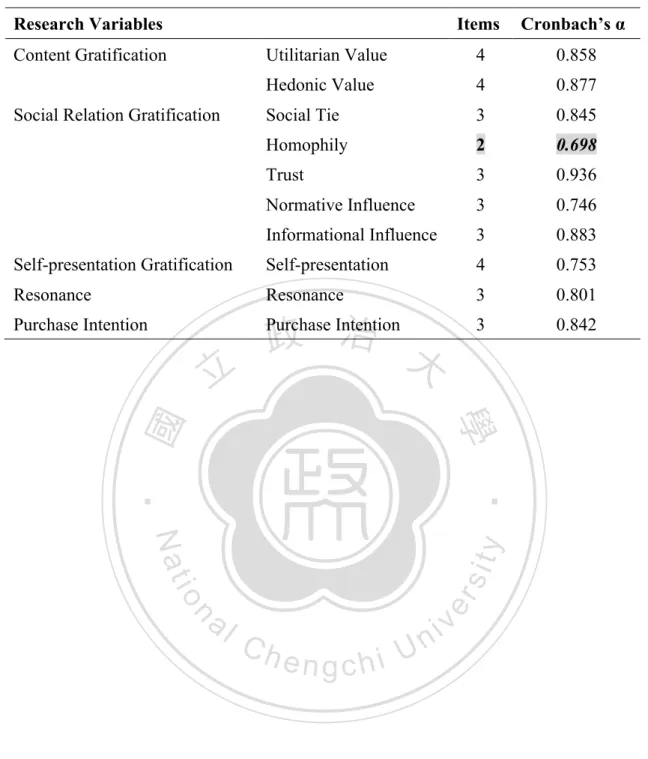
(26) . 3.4 Measurement We use multi-item scales to test the constructs in our model according to collected data from different social network platforms. Each construct is designed by adapting existing scales and modified to accommodate the research construct. The measurement of informational and hedonic value of content gratification is adapted from the scale from Jahnand Kunz (2012). The hedonic scales were also based on those designed by Babin et al. (1994). For tie strength, homophily, trust, interpersonal influence we adapted from the social-relation conceptual model via the social network from Chuand Kim (2011). Self-presentation gratification scales were based on the social-value component of customer-value framework from Jahnand Kunz (2012).. 政 治 大. Customer-resonance scales were based on Chiu et al. (2006) and this study. The measurement of purchase intention is based on the scale from Lu et al. (2010). The. 立. constructs contain several observable indicators that represent some questions on the. ‧ 國. 學. questionnaire (see Appendix for questionnaire). All survey items are evaluated by five-point interval scales, ranging from 1 (strong disagree) to 5 (strong agree). The objectives of this study are to empirically test the hypothesized relationship between. Nat. y. ‧. factors and resonance and resonance and purchase intention.. sit. 3.5 Data Analysis. er. io. A two-step approach was employed to analyze the data (Andersonand Gerbing. al. n. v i n C h reliability, and construct access the goodness of fit, composite e n g c h i U validity of the. 1988). In the first phase, confirmatory factor analysis (CFA) would be performed to measurement model. Confirmatory factor analysis will be conducted to verify the validity and estimate the competence of the measurement model. The goodness-of-fit statistic of the proposed model will show how reasonably the model fits the data. In the second phase of the analysis, we will test the proposed hypotheses by using a structural equation model with a maximum- likelihood method to test the relationship among constructs. All constructs are estimated by SPSS 17.0 and SmartPLS. The measures were pretested by online questionnaire with 36 graduate students, and they showed a high reliability expect for homophily in the analysis. The results of reliability are shown in Table 5. In order to meet the recommended significant level of Cronbach’s α test, homophily is social relation must add one more questions to satisfy the lowest level of items in each factor for customer answering questionnaire.. . 26 .
(27) . Table 5. Results of Pretest Research Variables. Items. Cronbach’s α. Utilitarian Value. 4. 0.858. Hedonic Value. 4. 0.877. Social Tie. 3. 0.845. Homophily. 2. 0.698. Trust. 3. 0.936. Normative Influence. 3. 0.746. Informational Influence. 3. 0.883. Self-presentation Gratification. Self-presentation. 4. 0.753. Resonance. Resonance. 3. 0.801. Purchase Intention. Purchase Intention. 政 治 大. 3. 0.842. Content Gratification Social Relation Gratification. 立. ‧. ‧ 國. 學. n. er. io. sit. y. Nat. al. . Ch. engchi. 27 . i n U. v.
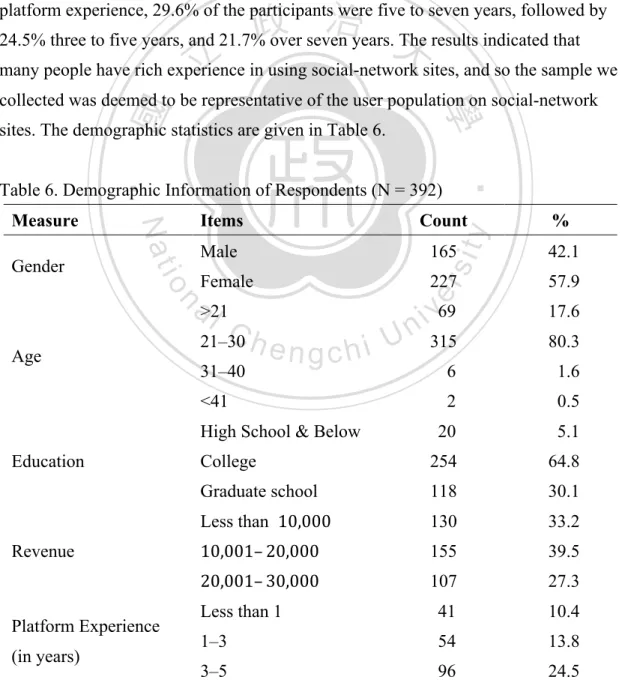
(28) . Chapter 4: Research Results 4.1 Survey Administration We collected the data using the online questionnaire tool Typeform from March to April. A total of 410 questionnaires were collected not only from social-network sites such as Facebook, Mobile 01, and BBS Platform but also by attending activities through scanning QR codes with smartphones. Participants completed the survey either for a cash coupon or as a requirement for attending an activity. The final sample of 392 respondents that we used for the data analysis included no incomplete data. The sample comprised 42.1% males and 57.9% females, and the participants’ ages mainly ranged from 21 to 30, especially for college and graduate students. As for. 政 治 大. platform experience, 29.6% of the participants were five to seven years, followed by 24.5% three to five years, and 21.7% over seven years. The results indicated that. 立. many people have rich experience in using social-network sites, and so the sample we. ‧. ‧ 國. sites. The demographic statistics are given in Table 6.. 學. collected was deemed to be representative of the user population on social-network. Table 6. Demographic Information of Respondents (N = 392). Count. %. Male. 165. 42.1. Female. 227. 57.9. i v69 n U 315. 17.6. 6. 1.6. 2. 0.5. 20. 5.1. College. 254. 64.8. Graduate school. 118. 30.1. Less than 10,000. 130. 33.2. 10,001– 20,000. 155. 39.5. 20,001– 30,000. 107. 27.3. Less than 1. 41. 10.4. 1–3. 54. 13.8. 3–5. 96. 24.5. sit. n. a>21 l C 21–30 h. y. Items. er. io. Gender. Nat. Measure. Age. 31–40. engchi. <41 High School & Below Education. Revenue. Platform Experience (in years). . 28 . 80.3.
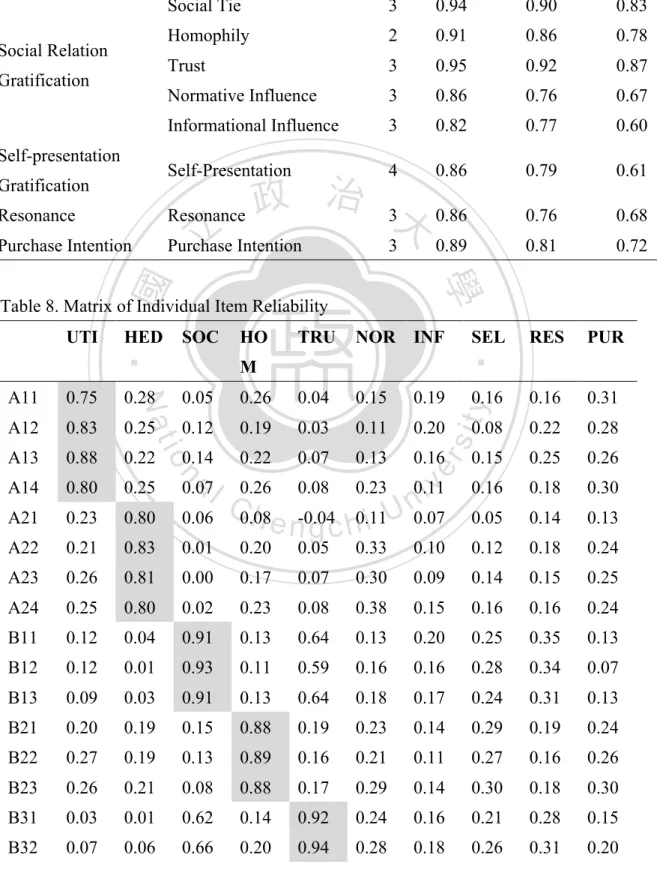
(29) . 5–7. 116. 29.6. <7. 85. 21.7. 4.2 Model Analysis Data analysis was performed using Partial Least Squares (PLS), which is a structural equation model to test Confirmatory Factor Analysis. In this study, the measurement model was first examined by SPSS 21.0, and then structural equation model was accessed by SmartPLS.. 4.2.1 Measurement Model Before testing the hypothesized relationships, we need to evaluate whether the. 政 治 大. scales achieved satisfactory levels of reliability and validity. We applied the two-step structural-equation-modeling approach because we developed the model by use and. 立. gratification theory and referred to questionnaires developed by previous researchers. ‧ 國. 學. (Andersonand Gerbing 1988). Hence, We used confirmatory factor analysis with SmartPLS software to test our proposed model. In the first step of the measurement. ‧. model, we verified the relationships such as the results of reliability and validity among observed variables. Afterward, we tested the hypothesized relationships in our. y. Nat. proposed model in an attempt to give an explanation for the data.. sit. As for the reliability test, we need to observe the composite reliability,. er. io. Cronbach’s α, and individual item reliability. We used composite reliability to. al. n. v i n C were the values of composite reliability all above 0.7, indicating that the scale had hen gchi U. evaluate the internal consistency of the measurement model, and as shown in Table 7 good reliability (Nunnally et al. 1967). Cronbach’s α measurements for all constructs were above the recommended 0.7 level which indicated that the scale had high reliability (Nunnally et al. 1967). In addition, we undertook an individual item-reliability test to determine whether each variable was significant. As shown in Table 8, the factor loadings in each construct exceeded the correlation between the construct and other constructs. Therefore, we conclude that all constructs in the model had adequate reliability.. . 29 .
(30) . Table 7. Descriptive Statistics for Constructs Research Variables. Items. CR. Cronbach’s α. AV E. Content Gratification. Social Relation Gratification. Self-presentation Gratification. Utilitarian Value. 4. 0.89. 0.83. 0.67. Hedonic Value. 4. 0.87. 0.79. 0.62. Social Tie. 3. 0.94. 0.90. 0.83. Homophily. 2. 0.91. 0.86. 0.78. Trust. 3. 0.95. 0.92. 0.87. Normative Influence. 3. 0.86. 0.76. 0.67. Informational Influence. 3. 0.82. 0.77. 0.60. Self-Presentation. 4. 0.86. 0.79. 0.61. 0.86. 0.76. 0.68. 0.89. 0.81. 0.72. 政 治 3大. Resonance. Resonance. Purchase Intention. Purchase Intention. 3. 學. ‧ 國. 立. SOC. A11. 0.75. 0.28. 0.05. 0.26. 0.04. 0.15. 0.19. A12. 0.83. 0.25. 0.12. 0.19. 0.03. 0.11. 0.20. 0.08. 0.22. 0.28. A13. 0.88. 0.22. 0.22. 0.07. 0.13. 0.16. 0.15. 0.25. 0.26. A14. 0.80. 0.25. 0.26. 0.08. 0.23. 0.16. 0.18. 0.30. A21. 0.23. 0.80. 0.06. 0.05. 0.14. 0.13. A22. 0.21. 0.83. 0.01. A23. 0.26. 0.81. A24. 0.25. B11. HO. TRU. NOR INF. n. al. 0.07. er. io. 0.14. SEL. RES. PUR. 0.16. 0.16. 0.31. sit. M. Nat. . HED. ‧. UTI. y. Table 8. Matrix of Individual Item Reliability. v 0.11 i n C0.08 h e n-0.04 i U 0.07 g c h0.11 0.20. 0.05. 0.33. 0.10. 0.12. 0.18. 0.24. 0.00. 0.17. 0.07. 0.30. 0.09. 0.14. 0.15. 0.25. 0.80. 0.02. 0.23. 0.08. 0.38. 0.15. 0.16. 0.16. 0.24. 0.12. 0.04. 0.91. 0.13. 0.64. 0.13. 0.20. 0.25. 0.35. 0.13. B12. 0.12. 0.01. 0.93. 0.11. 0.59. 0.16. 0.16. 0.28. 0.34. 0.07. B13. 0.09. 0.03. 0.91. 0.13. 0.64. 0.18. 0.17. 0.24. 0.31. 0.13. B21. 0.20. 0.19. 0.15. 0.88. 0.19. 0.23. 0.14. 0.29. 0.19. 0.24. B22. 0.27. 0.19. 0.13. 0.89. 0.16. 0.21. 0.11. 0.27. 0.16. 0.26. B23. 0.26. 0.21. 0.08. 0.88. 0.17. 0.29. 0.14. 0.30. 0.18. 0.30. B31. 0.03. 0.01. 0.62. 0.14. 0.92. 0.24. 0.16. 0.21. 0.28. 0.15. B32. 0.07. 0.06. 0.66. 0.20. 0.94. 0.28. 0.18. 0.26. 0.31. 0.20. 30 .
(31) . 0.08. 0.63. 0.20. 0.93. 0.36. 0.15. 0.25. 0.32. 0.22. B41. 0.16. 0.26. 0.19. 0.19. 0.34. 0.81. 0.27. 0.28. 0.29. 0.27. B42. 0.12. 0.30. 0.14. 0.24. 0.25. 0.87. 0.19. 0.28. 0.30. 0.26. B43. 0.18. 0.35. 0.08. 0.26. 0.16. 0.78. 0.26. 0.21. 0.20. 0.25. B51. 0.14. 0.09. 0.18. 0.08. 0.15. 0.23. 0.81. 0.11. 0.21. 0.14. B52. 0.16. 0.08. 0.12. 0.15. 0.11. 0.23. 0.77. 0.15. 0.15. 0.17. B53. 0.18. 0.14. 0.15. 0.13. 0.15. 0.21. 0.75. 0.09. 0.19. 0.20. C1. 0.14. 0.13. 0.34. 0.30. 0.29. 0.19. 0.11. 0.78. 0.30. 0.27. C2. 0.17. 0.07. 0.16. 0.21. 0.12. 0.19. 0.10. 0.78. 0.25. 0.22. C3. 0.07. 0.07. 0.19. 0.22. 0.19. 0.27. 0.10. 0.80. 0.25. 0.22. C4. 0.14. 0.21. 0.18. 0.27. 0.20. 0.36. 0.14. 0.76. 0.25. 0.22. D1. 0.17. 0.16. 0.34. 0.15. 0.24. 0.76. 0.29. D2. 0.18. 0.12. 0.26. 0.28. 0.84. 0.31. D3. 0.26. 0.21. 0.30. 0.26 0.13 0.06 治 0.22 政 0.14 0.27 0.32 大 0.20. 0.28. 0.34. 0.28. 0.31. 0.87. 0.37. E1. 0.29. 0.15. 0.17. 0.23. 0.19. 0.20. 0.22. 0.27. 0.32. 0.81. E2. 0.30. 0.27. -0.01. 0.23. 0.10. 0.30. 0.13. 0.26. 0.31. 0.85. E3. 0.29. 0.28. 0.13. 0.30. 0.23. 0.30. 0.20. 0.24. 0.37. 0.88. 立. ‧. ‧ 國. 0.09. 學. B33. y. Nat. As for the validity test, we needed to test the convergent validity and. sit. discriminant validity. Convergent validity examined the items of scales related to. er. io. each other in reality and was verified by examining the composite reliability (CR) and. al. n. v i n C h (Fornelland Larcker greater than 0.7 and 0.5, respectively e n g c h i U 1987). As Table 7 shows,. the average variance extracted (AVE). Acceptable values of CR and AVE should be all CR and AVE values of the items meet the recommended requirements.. Discriminant validity measured whether a construct is different from other constructs. It was used to determine whether the square root of average variance extracted for each construct should exceed the correlations between this construct and other constructs (Fornelland Larcker 1987). The results are shown in Table 9. The square root of average variance extracted for each construct surpasses the correlation between the constructs and all other constructs, demonstrating adequate discriminant validity.. . 31 .
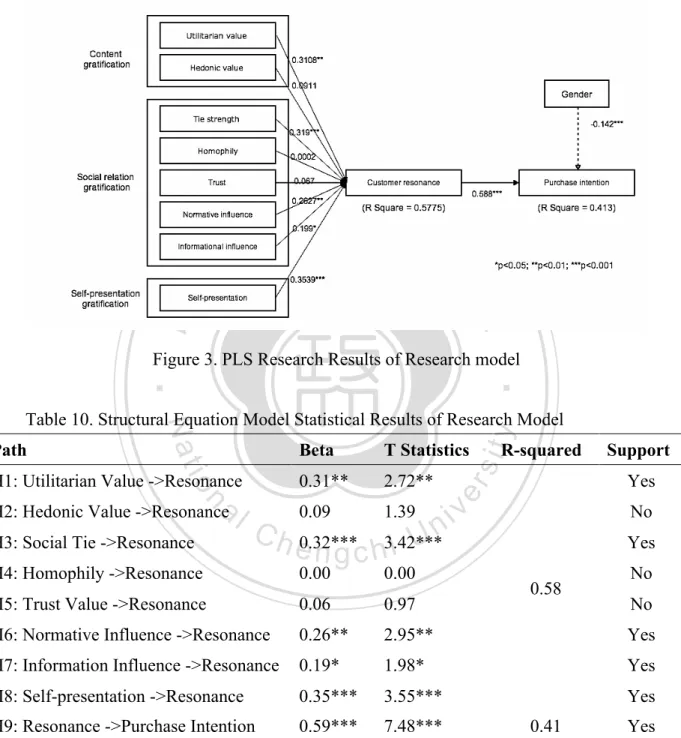
(32) . Table 9. Correlation Matrix of Key Construct UTI. HED. SOC. HOM. TRU. NOR. INF. SEL. RES. UTI. 0.82. HED. 0.30. 0.79. SOC. 0.12. 0.03. 0.91. HOM. 0.28. 0.22. 0.14. 0.88. TRU. 0.07. 0.06. 0.68. 0.19. 0.93. NOR. 0.18. 0.36. 0.17. 0.28. 0.32. 0.82. INF. 0.20. 0.13. 0.19. 0.15. 0.18. 0.29. 0.78. SEL. 0.17. 0.15. 0.28. 0.33. 0.26. 0.32. 0.15. 0.78. RES. 0.25. 0.20. 0.36. 0.20. 0.33. 0.33. 0.24. 0.34. 0.82. PUR. 0.35. 0.28. 0.12. 0.30. 政 0.21治 0.32大 0.22. 0.30. 0.39. 立. 4.2.2 Structural Model. PUR. 0.85. ‧ 國. 學. The examination of the structural model consists of estimating the path coefficients, which represent the strengths of the relationships among all constructs,. ‧. and the R-squared values, which stand for the amount of variance in dependent variables. In addition, Gender was our control variable representing purchase. y. Nat. intention in our research model. We tested the proposed hypotheses using a. sit. structural-equation model, and the results of the assessment with the overall. er. io. explanatory power, the estimated path coefficients, and the associated t-values of the. al. n. v i n C h since we assumed resonance is 0.575, which is reasonable e n g c h i U that all constructs were path are shown in Figure 3 and Table 10. The R-squared correlation for customer. influence factors for customer resonance. Also, the R-squared correlation for purchase intention was 0.468, which indicated that customer resonance is an influential factor for purchase intention after the control variable is added. Hence, both the path coefficients—including the loadings and the significance levels—and the R-squared values demonstrate how well the data validate the research model. As shown in Table 8, purchase intention was explained by resonance (Beta = 0.5887 and p < 0.001), providing support for Hypothesis 9. Resonance was also explained by self-presentation (Beta = 0.3593 and p < 0.001), informational influence (Beta = 0.199 and p < 0.05), normative influence (Beta = 0.2627 and p < 0.01), social ties (Beta = 0.319 and p < 0.001), and utilitarian value in UGC (Beta = 0.3108 and p <. . 32 .
(33) . 0.001). All coefficients of our proposed processing model except three were significant (p < 0.05). Surprisingly, the hedonic value in UGC, homophily, and trust had no significant influence on resonance. Thus, we can show that different motivations will influence customer resonance according to U&G theory.. 政 治 大. 立. ‧ 國. 學. Figure 3. PLS Research Results of Research model. ‧ y. n. al. H2: Hedonic Value ->Resonance H3: Social Tie ->Resonance H4: Homophily ->Resonance. T Statistics. 0.31**. 2.72**. i n C h 0.32*** 3.42*** engchi U 0.09. 1.39. R-squared. sit. io. H1: Utilitarian Value ->Resonance. Beta. Support Yes. er. Path. Nat. Table 10. Structural Equation Model Statistical Results of Research Model. v. No Yes. 0.00. 0.00. H5: Trust Value ->Resonance. 0.06. 0.97. H6: Normative Influence ->Resonance. 0.26**. 2.95**. Yes. H7: Information Influence ->Resonance. 0.19*. 1.98*. Yes. H8: Self-presentation ->Resonance. 0.35***. 3.55***. Yes. H9: Resonance ->Purchase Intention. 0.59***. 7.48***. Standard errors in parentheses. *p < 0.05; **p < 0.01; ***p < 0.001. . 33 . 0.58. 0.41. No No. Yes.
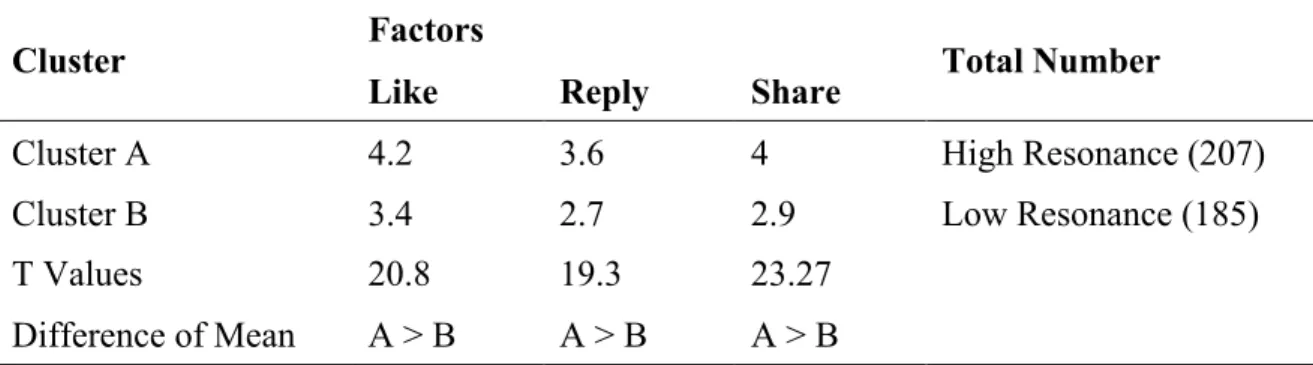
(34) . 4.3 Cluster Analysis Cluster analysis was performed using a two-stage cluster-analysis technique to derive content gratification, social-relation gratification and social gratification. Groups and clusters were formed using Ward’s method, followed by a K-means procedure to decide the adequate attributes of clusters. Finally, we will discuss the results of each cluster.. 4.3.1 Cluster Method We adapted the two-stage clustering approach to conduct the cluster analysis by using SPSS 21.0 software for our model. First, we used hierarchical clustering and Ward’s clustering method to decide the best number of clusters. The hierarchical. 政 治 大. clustering connects objects to form clusters based on their distance, and the Ward method is a hierarchical agglomerative technique that is used to identify the initial. 立. cluster solution. There are the means of each factor, and the best number of clustering. ‧ 國. 學. is two. The Clustering results are shown in Table 11.. Table 11. Clustering results by hierarchical clustering method. 14.3%. io. Change Rate. al. 4. 7199.15. 6768.25. 6471.41. 6.36%. 4.58%. 4.15%. y. 3. 5 6213.42. sit. coefficient. Nat. Agglomeration 8229.80. 2. er. 1. ‧. Cluster. n. v i n C h Ward solution were The cluster seeds formed by the e n g c h i U submitted to a K-means. procedure, which is an iterative partitioning technique that is used to group the data until the optimal solution is found. We used the K-means method to partition the input data set into two clusters according to the result of hierarchical clustering. We also conducted a t-test to identify the degree of resonance by different types of resonance dimensions using mean scores in three resonance-behavior dimensions. We separately labeled each cluster based on the results of resonance. Cluster A was labeled “high status” in resonance because the individuals in this cluster were more likely to engage in resonance behavior such as “like,” “reply,” and “share.” On the other hand, cluster B was labeled “low status” due to low scores on resonance. The results of each mean are shown is Table 12. As you can see, the amount in cluster A is more than in cluster B.. . 34 .
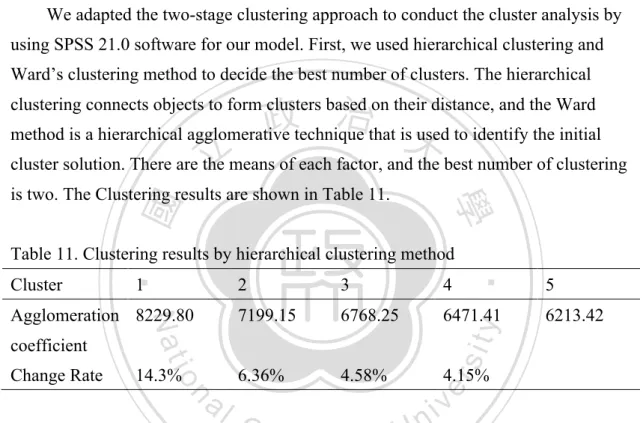
(35) . Table 12. t-Test of Resonance in Dimensions Factors. Cluster. Total Number. Like. Reply. Share. Cluster A. 4.2. 3.6. 4. High Resonance (207). Cluster B. 3.4. 2.7. 2.9. Low Resonance (185). T Values. 20.8. 19.3. 23.27. Difference of Mean. A>B. A>B. A>B. 4.3.2 Cluster Results The t-test results demonstrate that users in social networks have different levels of content gratification, social-relation gratification and self-presentation gratification.. 治 政 high-resonance clustering, has high degrees of homophily 大and trust (t = -11.5, A < B). 立 clustering is characterized by high degrees of On the other hand, high-resonance As can be seen in Tables 13–15, low-resonance clustering, in contrast to. ‧ 國. 學. content gratification, self-presentation gratification, and purchase intention.. Factors. y Hedonic Value. al. 4.02. er. 3.58. n. Cluster B. Utilitarian Value. io. Cluster A. Content Gratification. sit. Nat. Cluster. ‧. Table 13. t-Test of Two Clustered Groups on Content Gratification. 2.69. Ch. T values. 17. Difference of Mean. A>B. engchi. i n U. v3.95 9.3 A>B. Table 14. t-Test of Two Clustered Groups on Social-Relation Gratification Factors Cluster. Social-Relation Gratification Normative. Information. Influence. Influence. 3.52. 4.09. 4.27. 3.52. 3.74. 3.58. 3.84. 19.584. -12.05. -11.05. 15.516. 14.105. A>B. A<B. A<B. A>B. A>B. Social Tie. Homophily. Trust. Cluster A. 2.19. 3.19. Cluster B. 1.23. T Values Difference of Mean . 35 .
(36) . Table 15. t-Test of Two Clustered Groups on Self-Presentation Gratification and Purchase Intention Factors Cluster. Self-Presentation Gratification. Purchase Intention. Self-Presentation. Purchase Intention. Cluster A. 3.99. 4.1. Cluster B. 3.62. 3.42. T Values. 13.01. 16.006. Difference of Mean. A>B. A>B. After deciding the cluster of resonance, we separately applied the structural. 治 政 clustering to decide the dominated factors. All details are 大shown in Table 16. In high 立in gratifications are significant expect for homophily. resonance cluster, all factors. equation model to test the relationship in high resonance clustering and low resonance. ‧ 國. 學. Resonance is significantly related to purchase intention. Besides, the most significant variables to cause resonance are self-presentation, utilitarian value in content. ‧. gratification and social tie in social relation gratification. On the other hand in low resonance cluster, all factors in gratifications are significant expect for hedonic value. y. Nat. in content gratification, homophily in social relation gratification and trust in social. io. sit. relation gratification. The results of clustering results by structural equation model are. er. same with the structural equation model statistical results of research model.. al. n. v i n C h High Resonance U Table 16. SEM Statistical Results of e n g c h i Clustering. Path. Beta. T Statistics. H1: Utilitarian Value ->Resonance. 0.36***. 4.02***. Yes. H2: Hedonic Value ->Resonance. 0.11*. 1.78*. Yes. H3: Social Tie ->Resonance. 0.28***. 3.83***. Yes. H4: Homophily ->Resonance. 0.07. 0.02. H5: Trust Value ->Resonance. 0.08*. 1.56*. H6: Normative Influence ->Resonance. 0.21**. 2.02**. Yes. H7: Information Influence ->Resonance. 0.16*. 2.00*. Yes. H8: Self-presentation ->Resonance. 0.42***. 4.51***. Yes. H9: Resonance ->Purchase Intention. 0.67***. 8.74***. Standard errors in parentheses. *p < 0.05; **p < 0.01; ***p < 0.001 . 36 . R-squared. 0.67. 0.46. Support. No Yes. Yes.
數據
+7
相關文件
形成 形成 形成 研究問題 研究問題 研究問題 研究問題 形成問題 形成問題 形成問題 形成問題 的步驟及 的步驟及 的步驟及 的步驟及 注意事項 注意事項 注意事項
To improve the convergence of difference methods, one way is selected difference-equations in such that their local truncation errors are O(h p ) for as large a value of p as
The empirical results indicate that there are four results of causality relationship between Investor Sentiment and Stock Returns, such as (1) Investor
Schools can administer APASO-II scales/subscales at diff erent times of the school year to achieve different purpose s, e.g. to assess the effectiveness of an intervention progra m
Schools can administer APASO-II scales/subscales at diff erent times of the school year to achieve different purpose s, e.g.. to assess the effectiveness of an intervention progra
• All provisions of facilities such as trunks, conduits, cables, LAN ports and power points, shall be considered as fixture of the School venues and shall become the property of
The IEC endeavours to ensure that the information contained in this presentation is accurate as of the date of its presentation, but the information is provided on an
Such analysis enables valuable applications including social entity search en- gines and substitution recommendation systems. For a social entity search engine, existing work such
