1 Corresponding author: sinchelee@yahoo.com.tw *Current address: Department of Aquaculture, National
Pingtung University of Science and Technology, Pingtung 912, Taiwan
59
Genetic Differentiation of the Japanese Eel
M
ei-C
henT
seng*Institute of Zoology, National Taiwan University, Taipei 10764, Taiwan
W
ann-n
ianT
zengInstitute of Fishery Science, National Taiwan University, Taipei 10764, Taiwan
s
in-C
heL
ee1Institute of Zoology, Academia Sinica, Taipei 11529, Taiwan
Abstract.—Polymorphic microsatellite loci as genetic markers were used to reject the null hypothesis of panmixia for the Japanese eel, Anguilla japonica. Observed heterozygosity showed slight heterozygote deficiencies over all loci. One of the eight loci (MS-4) in one sample showed departure from Hardy-Weinberg equilibrium. Unbi-ased Nei’s genetic distances ranged from approximately 0.058 to 0.134. A slight genetic differentiation was determined by FST and RST statistics when adjusted with Bonferroni
correction. Although isolation by distance is often observed in marine species, its use as a null hypothesis seems questionable. Although the freshwater eel is categorized as a catadromous fish, the value of genetic diversity obtained fell within that of marine fishes. A higher correlation (P < 0.001) resulting from AMOVA supports the separation of Japanese eels into two management units: a low-latitude group (Shantou, Tanshui, and Fangliao) and a high-latitude group (Daecheon-myon, Yalu River, Hangzhou, and Mikawa Bay). Such a population subdivision will be useful for further applications of fisheries conservation and management in the northwestern Pacific Ocean.
Introduction
Although population structures of Euro-pean eel Anguilla anguilla, Japanese eel A.
japonica, and American eel A. rostrata have
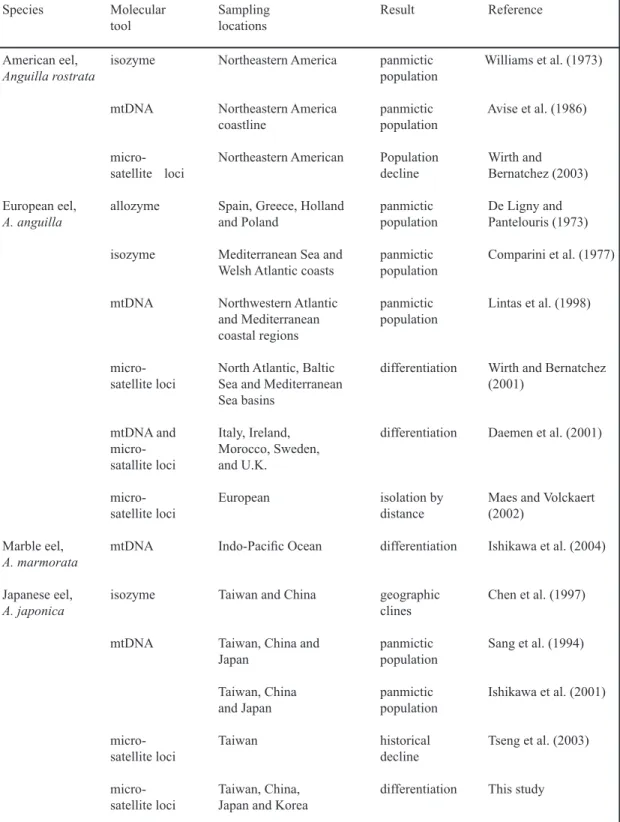
been studied intensively, controversy still ex-ists as to whether these species are made up of single panmixia or multiple geographical-ly based populations (Table 1). For European eel alone, protein electrophoresis and
se-quences of the mitochondrial DNA (mtDNA) control region support the hypothesis that eels from European and North African rivers belong to a panmictic population (De Ligny and Pantelouris 1973; Comparini et al. 1977; Lintas et al. 1998). Similar conclusions have been reached for American eel (Williams et al. 1973; Koehn and Williams 1978; Avise et al. 1986). Although results derived from both nuclear and cytoplasmic markers support the panmixia hypothesis for the genetic structure of Atlantic freshwater eels, Wirth and Bernat-chez (2001) challenged existing opinion con-cerning genetic structure. Slight genetic dif-© 2009 by the American Fisheries Society
Table 1. Studies of population genetics of freshwater eels (1973 to 2004).
Species Molecular Sampling Result Reference
tool locations
American eel, isozyme Northeastern America panmictic Williams et al. (1973)
Anguilla rostrata population
mtDNA Northeastern America panmictic Avise et al. (1986)
coastline population
micro- Northeastern American Population Wirth and
satellite loci decline Bernatchez (2003)
European eel, allozyme Spain, Greece, Holland panmictic De Ligny and
A. anguilla and Poland population Pantelouris (1973)
isozyme Mediterranean Sea and panmictic Comparini et al. (1977)
Welsh Atlantic coasts population
mtDNA Northwestern Atlantic panmictic Lintas et al. (1998)
and Mediterranean population
coastal regions
micro- North Atlantic, Baltic differentiation Wirth and Bernatchez
satellite loci Sea and Mediterranean (2001)
Sea basins
mtDNA and Italy, Ireland, differentiation Daemen et al. (2001)
micro- Morocco, Sweden,
satallite loci and U.K.
micro- European isolation by Maes and Volckaert
satellite loci distance (2002)
Marble eel, mtDNA Indo-Pacific Ocean differentiation Ishikawa et al. (2004)
A. marmorata
Japanese eel, isozyme Taiwan and China geographic Chen et al. (1997)
A. japonica clines
mtDNA Taiwan, China and panmictic Sang et al. (1994)
Japan population
Taiwan, China panmictic Ishikawa et al. (2001)
and Japan population
micro- Taiwan historical Tseng et al. (2003)
satellite loci decline
micro- Taiwan, China, differentiation This study
ferentiation among 13 samples of European eels from the North Atlantic, the Baltic Sea, and the Mediterranean Sea basins refutes the panmictic population hypothesis (Wirth and Bernatchez 2001).
The Japanese eel is a temperate freshwa-ter fish that is distributed in rivers of north-eastern Asian countries, including Taiwan, Japan, China, and Korea (Tesch 1977). As a catadromous fish, it spawns in the sea and grows and matures in freshwater rivers. The spawning grounds are thought to be to the west of the Mariana Islands, at 15°N 140°E (Tsukamoto 1992), evidenced by the occur-rence of newly hatched leptocephali in the area. Taking 4 to 6 months to drift passively to the coasts of northeast Asia by the Kuroshio Current, the leptocephali undergo metamor-phosis on the way to their freshwater desti-nations. The metamorphosis into translucent elvers is complete before upstream migra-tion. Eels live in rivers for 5 to 20 years, until they mature. Maturity occurs in late autumn, when they emigrate downstream to the ocean and return to the spawning grounds (Tesch 1977).
The Japanese eel is an important aquacul-ture species in northeastern Asian countries. Eel farmers in these countries catch large numbers of juveniles in estuaries from November to March during their upstream migration (Tzeng 1985). In these populations, the mitochondrial DNA sequences in the D-loop regions (Sang et al. 1994; Ishikawa et al. 2001) do not show interpopulation genetic differentiation, suggest-ing panmixia with low levels of genetic struc-turing due to high levels of gene flow. However, Japanese eels on the western Pacific fringe ex-hibit clear geographic clines when the IDHP and PGDH allozyme loci are used as genetic markers (Chan et al. 1997). A migration time lag from different parts of continents to the spawning grounds west of the Mariana Islands is hypothesized as a possible reason for the for-mation of this cline. However, the above results remain somewhat uncertain and controversial.
Previous studies of life cycles and popu-lation structures of aquatic animals have been limited due to the lack of proper markers. A possible solution to the question in the Japanese eel is the use of microsatellite DNA markers, which are characterized by high variability. The consistencies of microsatellite sequences include unique DNA sequences and tandem re-peats of 1 to 5 bases in length (Beckmann and Weber 1992).
Because of a tendency for higher vari-ability to be inherited in a Mendelian fash-ion and only the least amounts of tissue are required for PCR assay, microsatellites have been regarded as the most adequate genetic markers for solving many questions of biol-ogy (Wright and Bentzen 1994). The purpose of this study was to use eight polymorphic microsatellite loci to test genetic differentia-tion of Japanese eels in the northwestern Pa-cific Ocean.
Methods
Sampling
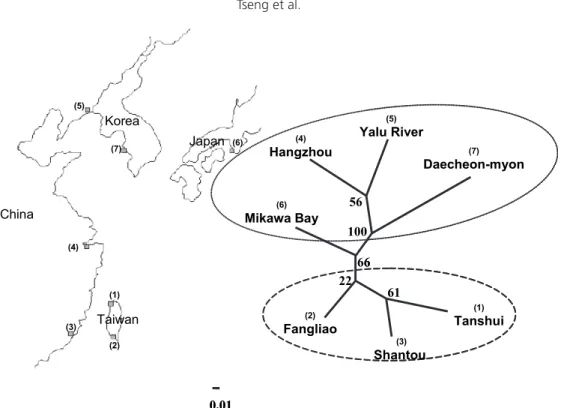
In total, 328 Japanese eel elvers were caught alive from seven distant locations throughout the species’ range in northeastern Asia in the winter and spring of 1999 to 2000. The collections came from Tanshui and Fan-gliao in Taiwan; the Yalu River, Hangzhou, and Shantou in China; Mikawa Bay in Japan; and Daecheon-myon in Korea (Figure 1). All specimens were preserved in 95% ethanol prior to DNA extraction.
DNA Extraction
Genomic DNA was isolated and purified from muscular tissue. Five hundred micro-grams of tissue with 1 mL lysis buffer was digested with 55 μL proteinase K solution (10 mM tris-HCl, pH 8.0, 2 mM ethylene diamine tetra-acetic acid (EDTA), 10 mM NaCl, 1% sodium dodecyl sulfate (SDS), 10
mg/mL dithiothreitol (DTT), 0.5 mg/mL pro-teinase K). DNA extraction was carried out twice with phenol, twice with phenol/chlo-roform/isoamyl alcohol (25:24:1), and once with chloroform/isoamyl (24:1) as described by Kocher et al. (1989). DNA was precipi-tated once with 95% ethanol and once with 70% ethanol and then dissolved in TE buf-fer (10 mM tris-HCl, pH 8.0, 1 mM EDTA) following a standard procedure outlined by Sambrook et al. 1989.
Screening and Analysis of Microsatellite Loci
We screened eight microsatellite loci from the Japanese eel genome. The se-quences submitted to EMBL under the accession numbers AJ297599-AJ297603, AJ297605, and AM062761-AM062762 (Tseng et al. 2001; Tseng et al. 2006) are listed in Table 2. Microsatellites were am-plified via the polymerase chain reaction
(PCR) and electrophoreses. Forward prim-ers were labeled with FAM, TAMRA, or HEX flu, and then PCR was performed in a volume of 25 μL, including 1 ng genomic DNA, 2 pmol reverse primer, 2 pmol la-beled forward primer, 25 mM dNTP, 0.05 to 0.1 mM MgCl2, 10X buffer, and 0.5 U Taq polymerase (supplied by Takara, Shuzo Co., Shiga, Japan 2003). Amplification was performed in a PC-960G Microplate Ther-mal Cycler (Corbett Research) programmed with the following schedule: initial dena-turing at 95°C for 4 min; and 38 cycles of 30 s each at successive thermal regimes of 94°C, 56–58°C, and 72°C. Eight microli-ters of product was precipitated with 95% alcohol. Semiautomated genotyping was performed by a capillary MEGABACE-500 Analysis system. Data were scored by Genetic profiler Software 1.5 (Amersham Biosciences). (1) Tanshui (3) Shantou (2) Fangliao (6) Mikawa Bay (4) Hangzhou (5) Yalu River (7) Daecheon-myon 0.01 56 66 22 61 100 Japan Korea China Taiwan (1) (2) (3) (4) (5) (6) (7) (1) Tanshui (3) Shantou (2) Fangliao (6) Mikawa Bay (4) Hangzhou (5) Yalu River (7) Daecheon-myon 0.01 56 66 22 61 100 Japan Korea China Taiwan (1) (2) (3) (4) (5) (6) (7)
Figure 1. Sampling localities and topological tree for Anguilla japonica. The UPGMA tree is drawn using Nei’s genetic distance measured for seven samples of Japanese eels.
Data Analysis
The observed (HO) and expected (HE) het-erozygosities were independently calculated for each locus (Yang and Yeh 1993). Expected genotypic frequencies under random mating were calculated using the algorithm by Lev-ene (1949), and likelihood ratio (G2) tests for
Hardy-Weinberg equilibrium were performed for each locus. To examine the relationship among populations, Nei’s unbiased genetic distances (Nei 1978) were computed between all pairs of populations. The original topology of the phylogenetic tree was inferred from the neighbor-joining method based on Nei’s unbi-ased genetic distances. One thousand bootstrap resamplings were used for evaluating support of the data set for the relationships.
FST and RST were used to examine popula-tion subdivisions (Weir and Cockerham 1984; Raymond and Rousset 1995). RST is an ana-log of FST that assumes a stepwise mutation model of repeat DNA (Raymond and Rousset 1995). The significance level was adjusted by
sequential Bonferroni correction (Holm 1979; Rice 1989; Sankoh et al. 1997).
We tested isolation by distance (IBD) as an indicator of an emerging population struc-ture by a typical regression of geographic distance on Nei’s genetic distance. We used Mantel tests for correlation of two parameters to examine the significance of IBD relation-ships (Mantel 1967; Smouse et al. 1986). The hierarchical genetic structure was investigated by analysis of molecular variance (AMOVA; Excoffier et al. 1992) based on an analysis of the variance of genetic distances.
Results
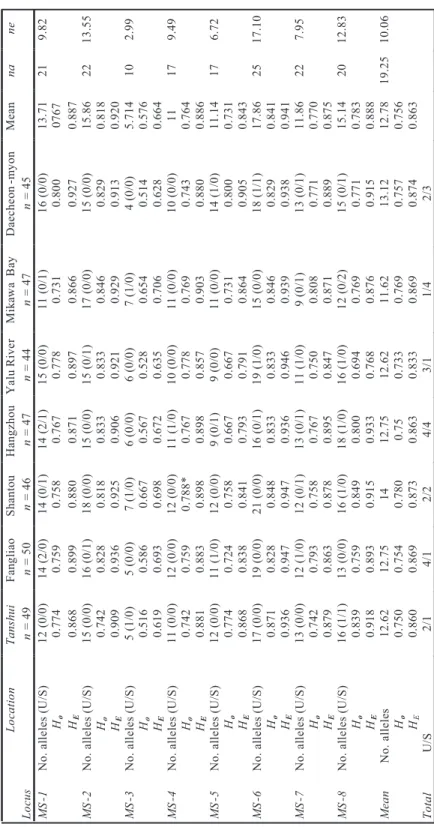
Primer sequences and PCR conditions, including different concentrations of MgCl2 and annealing temperatures of the eight poly-morphic microsatellite loci that were correctly amplified, are given in Table 2. All eight loci were highly variable, with the number of al-leles ranging from 10 in 3 to 25 in MS-6, with an average of 19.25. The sizes of the
Table 2. Locus name, repeat motifs, primer sequence, and PCR conditions of Japanese eel mic-rosatellite loci detected by PCR amplification.
Locus Repeat Primer sequence (5’–3’) Annealing MgCl2 Range of
motifs temp (°C) (mM) allele sizes
(bp) MS-1 (GT)16 F:TCGAGACACCAGATAGTCAC 58 0.5 188–230 R:ACATCCTAGGCTCACACC MS-2 (GA)15 F:ATTTCACGTCATCGGACCTGC 56 0.5 103–143 R:GCTGGGAGCGACGCTTTATC MS-3 (GT)10 F:GGTATGAATGCAGGCGTTTATG 56 0.5 79–97 R:GCAACCGATTTGATCTCCAG MS-4 (GT)15 F:CCTTCAGATTGCTAGCAC 58 0.5 117–155 R:CGGAGTCTAATTGTCTCCTC MS-5 (GT)19 F:ACAGAGCCAGACAAACAGAC 56 1.0 83–115 R:GGTCAGCAAGCAAAACGAAC MS-6 (GA)17 F:TGTCTAACACTAAGAAAAGGAGAGG 58 1.0 133–181 R:GGCTGCCAGTATCTTCTCAAAG MS-7 (GT)9 F:AGTAAAGAGTCCCACGCATTC 54 0.5 76–90 R:AAGGTGGATTTTTGCTGGCTC MS-8 (GT)12 F:AGGCTGAAGTGAGTATGCTCAG 56 0.5 100–120 R:AGATATGGAAGCAGGATGGAG
Lo ca tio n Ta ns hu i Fa ng lia o Sh an to u H an gz ho u Y al u R iv er M ik aw a B ay D ae ch eo n -m yo n M ea n na n e Lo cu s n = 49 n = 50 n = 46 n = 47 n = 44 n = 47 n = 45 M S-1 N o. a lle le s (U /S ) 12 (0 /0 ) 14 (2 /0 ) 14 (0 /1 ) 14 (2 /1 ) 15 (0 /0 ) 11 (0 /1 ) 16 (0 /0 ) 13 .7 1 21 9. 82 Ho 0. 77 4 0. 75 9 0. 75 8 0. 76 7 0. 77 8 0. 73 1 0. 80 0 07 67 HE 0. 86 8 0. 89 9 0. 88 0 0. 87 1 0. 89 7 0. 8 6 6 0. 92 7 0. 88 7 M S-2 N o. a lle le s (U /S ) 15 (0 /0 ) 16 (0 /1 ) 18 (0 /0 ) 15 (0 /0 ) 15 (0 /1 ) 17 (0 /0 ) 15 (0 /0 ) 15 .8 6 22 13 .5 5 Ho 0. 74 2 0. 82 8 0. 81 8 0. 83 3 0. 83 3 0. 84 6 0. 82 9 0. 81 8 HE 0. 90 9 0. 93 6 0. 92 5 0. 90 6 0. 92 1 0. 92 9 0. 91 3 0. 92 0 M S-3 N o. a lle le s (U /S ) 5 (1 /0 ) 5 (0 /0 ) 7 (1 /0 ) 6 (0 /0 ) 6 (0 /0 ) 7 (1 /0 ) 4 (0 /0 ) 5. 71 4 10 2. 99 Ho 0. 51 6 0. 58 6 0. 66 7 0. 56 7 0. 52 8 0. 65 4 0. 51 4 0. 57 6 HE 0. 61 9 0. 69 3 0. 69 8 0. 67 2 0. 63 5 0. 70 6 0. 62 8 0. 66 4 M S-4 N o. a lle le s (U /S ) 11 (0 /0 ) 12 (0 /0 ) 12 (0 /0 ) 11 (1 /0 ) 10 (0 /0 ) 11 (0 /0 ) 10 (0 /0 ) 11 17 9. 49 Ho 0. 74 2 0. 75 9 0. 78 8* 0. 76 7 0. 77 8 0. 76 9 0. 74 3 0. 76 4 HE 0. 88 1 0. 88 3 0. 89 8 0. 89 8 0. 85 7 0. 90 3 0. 88 0 0. 88 6 M S-5 N o. a lle le s (U /S ) 12 (0 /0 ) 11 (1 /0 ) 12 (0 /0 ) 9 (0 /1 ) 9 (0 /0 ) 11 (0 /0 ) 14 (1 /0 ) 11 .1 4 17 6. 72 Ho 0. 77 4 0. 72 4 0. 75 8 0. 66 7 0. 66 7 0. 73 1 0. 80 0 0. 73 1 HE 0. 86 8 0. 83 8 0. 84 1 0. 79 3 0. 79 1 0. 86 4 0. 90 5 0. 84 3 M S-6 N o. a lle le s (U /S ) 17 (0 /0 ) 19 (0 /0 ) 21 (0 /0 ) 16 (0 /1 ) 19 (1 /0 ) 15 (0 /0 ) 18 ( 1 /1 ) 17 .8 6 25 17 .1 0 Ho 0. 87 1 0. 82 8 0. 84 8 0. 83 3 0. 83 3 0. 84 6 0. 82 9 0. 84 1 HE 0. 93 6 0. 94 7 0. 94 7 0. 93 6 0. 94 6 0. 93 9 0. 93 8 0. 94 1 M S-7 N o. a lle le s (U /S ) 13 (0 /0 ) 12 (1 /0 ) 12 (0 /1 ) 13 (0 /1 ) 11 (1 /0 ) 9 (0 /1 ) 13 (0 /1 ) 11 .8 6 22 7. 95 Ho 0. 74 2 0. 79 3 0. 75 8 0. 76 7 0. 75 0 0. 80 8 0. 77 1 0. 77 0 HE 0. 87 9 0. 86 3 0. 87 8 0. 89 5 0. 84 7 0. 87 1 0. 88 9 0. 87 5 M S-8 N o. a lle le s (U /S ) 16 (1 /1 ) 13 (0 /0 ) 16 (1 /0 ) 18 (1 /0 ) 16 (1 /0 ) 12 (0 /2 ) 15 (0 /1 ) 15 .1 4 20 12 .8 3 Ho 0. 83 9 0. 75 9 0. 84 9 0. 80 0 0. 69 4 0. 76 9 0. 77 1 0. 78 3 HE 0. 91 8 0. 89 3 0. 91 5 0. 93 3 0. 76 8 0. 87 6 0. 91 5 0. 88 8 M ea n N o. a lle le s 12 .6 2 12 .7 5 14 12 .7 5 12 .6 2 11 .6 2 13 .1 2 12 .7 8 19 .2 5 10 .0 6 Ho 0. 75 0 0. 75 4 0. 78 0 0. 75 0. 73 3 0. 76 9 0. 75 7 0. 75 6 HE 0. 86 0 0. 86 9 0. 87 3 0. 86 3 0. 83 3 0. 86 9 0. 87 4 0. 86 3 To ta l U /S 2/ 1 4/ 1 2/ 2 4/ 4 3/ 1 1/ 4 2/ 3 Table 3. Levels of genetic variation observed at eight micr osatellite loci within seven Japanese eel samples: sample size (n ), number of alleles detected at each locus, observed (Ho ) and expected (HE ) heter ozygosity within samples, number of unique alleles (U) in each sample, number of solitary missing alleles (S) in each locus, observed number of alleles (na ), and ef fective number of alleles (ne ). *Indicates a significant Har dy-W
alleles over the eight loci ranged from 79 bp in MS-3 to 230 bp in MS-1. Among them, lo-cus MS-3 was the shortest (<100 bp, Table 2). The observed heterozygosity (HO) over all loci ranged from 0.514 6 0.068 (MS-3) to 0.871 6 0.031(MS-6), with an average of 0.756 6 0.075. The expected heterozygosity (HE) ranged from 0.619 (MS-3) to 0.947 (MS-6), with an average of 0.863 (Table 2). The result showed slight heterozygote deficiencies when tested with Hardy-Weinberg equilibrium.
For studying evolutionary relationships among seven spatial samples, unbiased Nei’s
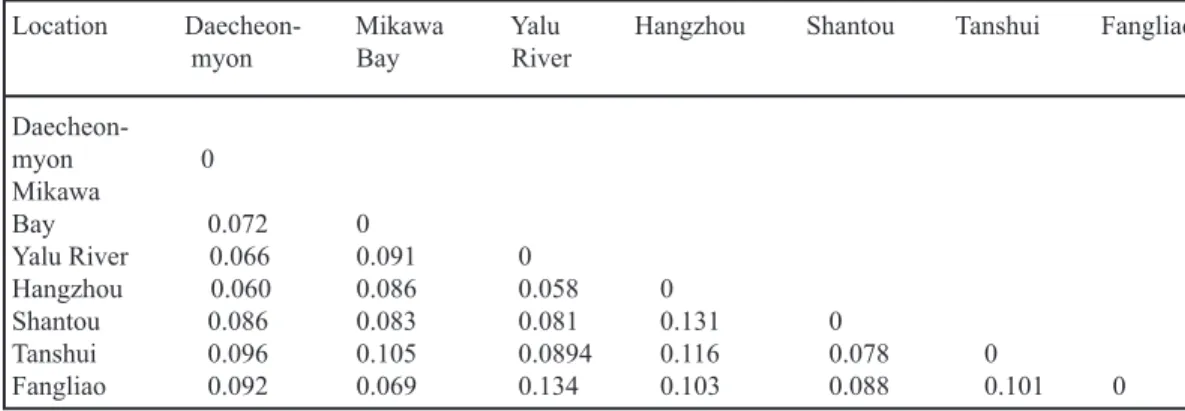
genetic distances were examined and shown to range from approximately 0.058 (Yalu Riv-er/Hangzhou) to 0.134 (Yalu River/Fangliao), with an average of 0.09 6 0.021 (Table 3). For further determination of population subdivi-sions, FST and RST were used to obtain respec-tive values of 0.002 to 0.015 (mean, 0.008) and –0.009 to 0.05 (mean, 0.016) (Table 4).
Nei’s unbiased genetic distance versus coastal geographical distances for all possible paired combinations of seven Japanese eel sam-ples showed no significant correlation (Figure 2). The Mantel test for correlation of
param-Table 4. Nei’s unbiased genetic distance for Japanese eel samples from seven locations.
Y = 0.000004X + 0.0876 R 2 = 0.0428 0 0.05 0.1 0.15 0.2 0 500 1000 1500 2000 2500 3000 3500 4000 4500 5000 N ei ’ s G en et ic D istance Geographic Distance (km) Y = 0.000004X + 0.0876 R2 = 0.0428 0 0.05 0.1 0.15 0.2 0 500 1000 1500 2000 2500 3000 3500 4000 4500 5000 N ei ’ s G en et ic D istance Geographic Distance (km)
Figure 2. Relationships between Nei’s genetic distance and geographic distance (km). Pearson correlation coefficients (r) and significance of the correlations (P) are given in text.
Location Daecheon- Mikawa Yalu Hangzhou Shantou Tanshui Fangliao
myon Bay River
Daecheon-myon 0 Mikawa Bay 0.072 0 Yalu River 0.066 0.091 0 Hangzhou 0.060 0.086 0.058 0 Shantou 0.086 0.083 0.081 0.131 0 Tanshui 0.096 0.105 0.0894 0.116 0.078 0 Fangliao 0.092 0.069 0.134 0.103 0.088 0.101 0
10.8) and freshwater fishes (mean 9.1) but slightly fewer than marine fishes (mean 19.9) (DeWoody and Avise 2000). The mean num-ber of alleles per locus per sample varied be-tween 11.62 and 14.00 in Japanese eels and between 9.6 and 12.4 (Daemen et al. 2001) or 12.9 and 21.2 (Wirth and Bernatchez 2001) in European eels, all of which are within the range for teleosts. These results imply a pro-gressive change in genetic variability among freshwater, anadromous, catadromous, and marine fishes. In addition, the significantly low mean heterozygosity of 0.54 assayed in freshwater fishes and the high value of 0.77 in marine fishes (DeWoody and Avise 2000) reveal that Japanese eels (0.75) are intermedi-ate with respect to mean levels of microsintermedi-atel- microsatel-lite variation. Although the freshwater eel is categorized as a catadromous fish, its genetic diversity is close to that of marine fishes.
One of eight loci showed a slight depar-ture from expected heterozygosity (HE) in one sample (Table 2). This may be associated with the Wahlund (1928) effect, where the decrease in heterozygosity is caused by a mixing of dif-ferentiated subsamples, and to the null allele effect, where the increase in homozygosity is caused by failure of amplification of an allele mutated in the primer region.
eters excludes a possible isolation-by-distance principle in Japanese eel samples (r = 0.123, P = 0.258). When Nei’s genetic distances were substituted by FST and RST values, results were similar. The neighbor-joining tree constructed on the basis of the genetic distance data set can be grouped into two clades.
When Japanese eels were grouped into two clades including high-latitude groups (Dae-cheon-myon, Yalu River, Hangzhou, and Mi-kawa Bay) and low-latitude groups (Shantou, Tanshui, and Fangliao), the hierarchical ge-netic structure tested by AMOVA indicated that 1.95% of the total genetic variation partitioned in the among-groups category (P < 0.05), 95.73% was within populations (P < 0.001), and 2.32% was among populations within a group. Nei’s genetic distance ranged from 0.058 to 0.091 in the high-latitude group, 0.078 to 0.101 in the low-latitude group, and 0.069 to 0.134 between high- and low-latitude populations. The tree to-pology suggested that dispersion of Japanese eel elvers to the coast does not occur randomly.
Discussion
As a catadromous fish, the Japanese eel has more alleles per unit of microsatellite lo-cus (mean 19.25) than do anadromous (mean
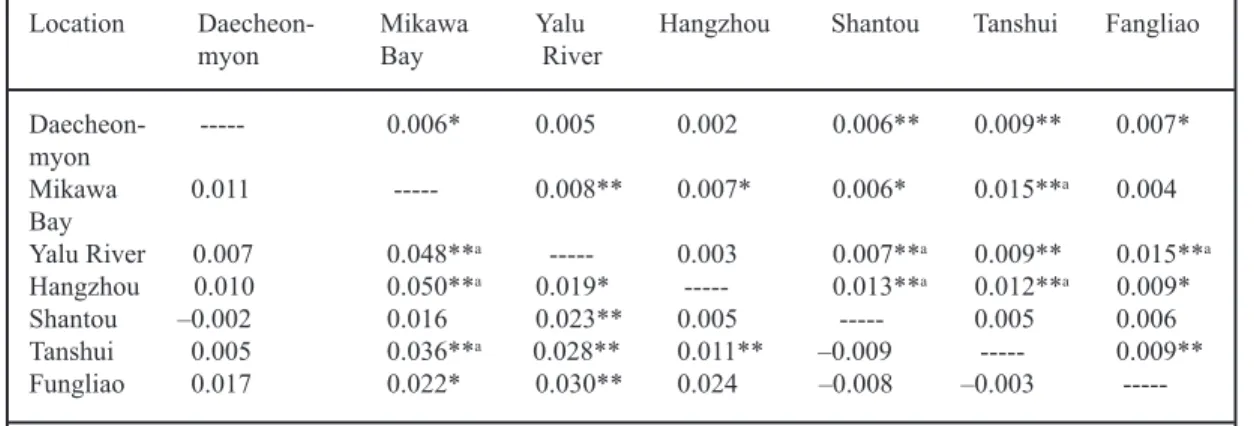
Table 5. Pair-wise FST estimates between samples above the diagonal and RST estimates below the diagonal. The significance level was adjusted by Bonferroni’s correction.
Location Daecheon- Mikawa Yalu Hangzhou Shantou Tanshui Fangliao
myon Bay River
Daecheon- --- 0.006* 0.005 0.002 0.006** 0.009** 0.007* myon Mikawa 0.011 --- 0.008** 0.007* 0.006* 0.015**a 0.004 Bay Yalu River 0.007 0.048**a --- 0.003 0.007**a 0.009** 0.015**a Hangzhou 0.010 0.050**a 0.019* --- 0.013**a 0.012**a 0.009* Shantou –0.002 0.016 0.023** 0.005 --- 0.005 0.006 Tanshui 0.005 0.036**a 0.028** 0.011** –0.009 --- 0.009** Fungliao 0.017 0.022* 0.030** 0.024 –0.008 –0.003 ---* p < 0.05; ---*---* p < 0.01; a p < 0.0014.
Genetic differentiation indices (FST, RST) estimated at the time when glass eels approach the estuaries indicate a weak but significant spatial divergence among samples. Recent studies have argued for a random mating sys-tem in anguillid eels, but Wirth and Bernat-chez (2001) viewed the European eel differ-ently. However, we support the nonpanmictic hypothesis in Japanese eels because of the significant genetic differentiation index. The magnitude of spatial differentiation in Japa-nese eels (FST = 0.002 to 0.015, mean 0.008) is higher than that of the European eel (0.0017 in Daemen et al. 2001; 0.004 in Wirth and Ber-natchez 2001). Each species consists of differ-ent genetic structures found in the Pacific and Atlantic habitats due to their own particularly hydrographic systems.
We can reject the isolation-by-distance hypothesis for the eels analyzed in the present study; however, when examining the Mantel relation test, the European eel otherwise con-forms to this model (Wirth and Bernatchez 2001). Interspecific differences in genetic struc-ture result from various current systems and evolutionary histories. The inconsistency with the isolation-by-distance model is evidenced by the greater divergence between some closely spaced sites. For example, the genetic distance between Mikawa Bay and Fangliao is smaller than the genetic distance between Mikawa Bay and Daecheon-myon. The different groups of elvers passively drifting to destinations depend on complicated subcurrent systems of the north-western Pacific Ocean.
The F-statistic of AMOVA (hierarchi-cal analysis of molecular variance) shows the genetic variance between two groups (FCT = 0.009, P < 0.05). Thus, Japanese eel popula-tions can be clearly distinguished into a two-groups model, whose general profile is clearly shown in the relevant tree topology (Figure 1). The older metamorphosis age was determined in the high-latitude group compared with that in the lower-latitude group (Cheng and Tzeng 1996).
Current world fisheries have been threat-ened by overfishing and habitat destruction through dam construction and industrial pol-lution. Management efforts are extremely important for commercial fisheries, which, through overharvesting, can become eco-nomically extinct well before the exploited species becomes threatened with biologi-cal extinction (Botsford et al. 1997). In this case, eel populations in the northwestern Pa-cific Ocean can be classified into two groups based on significant divergence in nuclear allele frequencies. Furthermore, the major roles that ecology, behavior, and environmen-tal conditions of fish populations play in fish-eries management need to be recognized.
Acknowledgments
The authors wish to express their grati-tude to H. Y. Teng and C. W. Chang for col-lecting specimens from Taiwan. Special thanks are due to Profs. Y. H. Xie and H. P. Oka for providing us with the samples from China and Japan. We thank two anonymous reviewers for their constructive comments on the manuscript.
References
Avise, J. C., G. S. Helfman, N. C. Saunders, and L. S. Hales. 1986. Mitochondrial DNA differentiation in North Atlantic eels: population genetic conse-quences of an unusual life history pattern. Pro-ceedings of the National Academy of Sciences of the USA 83:4350–4353.
Beckmann, J. S., and J. L. Weber. 1992. Survey of hu-man and rat micosatellites. Genomics 12:627– 631.
Botsford, L. W., J. C. Castilla, and C. H. Peterson. 1997. The management of fisheries and marine ecosystems. Science 277:509–515.
Chan, I. K. K., D. K. O. Chan, S. C. Lee, and K. Tsu-kamoto. 1997. Genetic variability of the Japanese eel Anguilla japonica (Temminck and Schlegel) related to latitude. Ecology of Freshwater Fish 6:45–49.
meta-morphosis and estuarine arrival across the disper-sal range of the Japanese eel Anguilla japonica. Marine Ecology Progress Series 131:87–96. Comparini, A., M. Rizzotti, and E. Rodino. 1977.
Ge-netic control and variability of phosphoglucose isomerase (PGI) in eels from the Atlantic Ocean and the Mediterranean Sea. Marine Biology 43:109–116.
Daemen, E., T. Cross, F. Ollevier, and F. A. M. Vol-ckaert. 2001. Analysis of the genetic structure of European eel (Anguilla anguilla) using microsat-ellite DNA and mtDNA markers. Marine Biology 139:755–764.
De Ligny, W., and E. M. Pantelouris. 1973. Origin of the European eel. Nature (London) 246:518–519. DeWoody, J. A., and J. C. Avise. 2000. Microsatellite
variation in marine, freshwater and anadromous fishes compared with other animals. Journal of Fish Biology 56:461–473.
Excoffier, L., P. E. Smouse, and J. M. Quattro. 1992. Analysis of molecular variance inferred from met-ric distances among DNA haplotypes: application to human mitochondrial DNA restriction data. Ge-netics 131:479–491.
Holm, S. 1979. A simple sequentially rejective multiple test procedure. Scandinavian Journal of Statistics 6:65–70.
Ishikawa, S., J. Aoyama, K. Tsukamoto, and M. Nishida. 2001. Population structure of the Japanese eel
An-guilla japonica as examined by mitochondrial DNA
sequencing. Fisheries Science 67:246–253. Ishkawa, S., K. Tsukamoto, and M. Nishida. 2004.
Genetic evidence for multiple geographic popula-tions of the giant mottled Anguilla marmorata in the Pacific and Indian oceans. Ichthyological Re-search 51:343–353.
Kocher, T. D., W. K. Thomas, A. Meyer, S. V. Edwards, S. Pabo, F. X. Villablabca, and A. C. Wilson. 1989. Dynamics of mitochondrial DNA evolution in ani-mals: amplification and sequencing with conserved primers. Proceedings of the National Academy of Sciences of the USA 86:6196–6200.
Koehn, R. K., and G. C. Williams. 1978. Genetic differ-entiation without isolation in the American eel
An-guilla rostrata. II: Temporal stability of geographic
variation. Evolution 32:624–637.
Levene, H. 1949. On a matching problem in genetics. The annals of mathematical statistics 20:91–94. Lintas, C., J. Hirano, and S. Archer. 1998. Genetic
variation of the European eel Anguilla anguilla. Molecular Marine Biology and Biotechnology 7:263–269.
Maes, G. E., and F. A. M. Volckaert. 2002. Clinal genet-ic variation and isolation by distance in the
Euro-pean eel Anguilla anguilla (L.). Biological Journal of the Linnean Society 77:509–521.
Mantel, N. 1967. The detection of disease clustering and a generalized regression approach. Cancer Research 27:209–220.
Nei, M. 1978. Estimation of average heterozygosity and genetic distance from a small number of indi-viduals. Genetics 89:583–590.
Raymond, M., and F. Rousset. 1995. An exact test for population differentiation. Evolution 49:1280– 1283.
Rice, W. R. 1989. Analyzing tables of statistical tests. Evolution 43:223–225.
Sambrook, J., E. F. Fritsch, and T. Maniatis. 1989. Mo-lecular cloning, a laboratory manual, 2nd edition. Cold Spring Harbor Laboratory Press, New York. Sang, T. K., H. Y. Chang, C. T. Chen, and C. F. Hui.
1994. Population structure of the Japanese eel
An-guilla japonica. Molecular Biology and Evolution
11:250–260.
Sankoh, A. J., M. F. Huque, and S. D. Dubey. 1997. Some comments on frequently used multiple end-point adjustments methods in clinical trials. Statis-tics in Medicine 16:2529–2542.
Smouse, P. E., J. C. Long, and R. R. Sokal. 1986. Mul-tiple regression and correlation extensions of the Mantel test of matrix correspondence. System-atic Zoology 35:627–632.
Tesch, F. W. 1977. The eel: biology and management of anguillid eels. Chapman and Hall, London. Tseng, M. C., C. A. Chen, H. W. Kao, W. N. Tzeng,
and S. C. Lee. 2001. Polymorphisms of GA/GT microsatellite loci from Anguilla japonica. Ma-rine Biotechnology 3:75–280.
Tseng, M. C., W. N. Tzeng, and S. C. Lee. 2003. Historical decline in the Japanese eel Anguilla
japonica in northern Taiwan inferred from
genet-ic variations. Zoologgenet-ical Studies 42:556–563. Tseng, M. C., W. N. Tzeng, and S. C. Lee. 2006.
Population genetic structure of the Japanese eel,
Anguilla japonica, in the northwestern Pacific
Ocean: evidence of non-panmictic populations. Marine Ecology Progress Series 308:221–230. Tsukamoto, K. 1992. Discovery of the spawning area
for Japanese eel. Nature (London) 356:789–791. Tzeng, W. N. 1985. Immigration timing and activity
rhythms of the eel, Anguilla japonica, elvers in the estuary of northern Taiwan, with emphasis on environmental influences. Bulletin of Japanese Society of Fisheries Oceanography 47/48:11–28. Wahlund, S. 1928. The combination of populations
and the appearance of correlation examined from the standpoint of the study of heredity. Hereditas 11:65–106.
Weir, B. S., and C. C. Cockerham. 1984. Estimating F-statistics for the analysis of population struc-ture. Evolution 38:1358–1370.
Williams, G. C., R. K. Koehn, and J. B. Mitton. 1973. Genetic differentiation without isolation in the American eel, Anguilla rostrata. Evolution 27:192–204.
Wirth, T., and L. Bernatchez. 2001. Genetic evidence against panmixia in the European eel. Nature (London) 409:1037–1040.
Wirth, T., and L. Bernatchez. 2003. Decline of North Atlantic eels: a fatal synergy? Proceedings of the Royal Society of London, Series B 270:681– 688.
Wright, J. M., and P. Bentzen. 1994. Microsatellites: genetic markers for the future. Reviews in Fish Biology and Fisheries 4:384–388.
Yang, R. C., and F. C. Yeh. 1993. Multilocus structure in Pinus contoria Dougl. Theoretical and Applied Genetics 87:568–576.