1999;319;1162-1165
BMJ
Tung-liang Chiang
Taiwan: regression analysis
between income inequality and mortality in
Economic transition and changing relation
http://bmj.com/cgi/content/full/319/7218/1162
Updated information and services can be found at:
These include:
References
http://bmj.com/cgi/content/full/319/7218/1162#otherarticles
12 online articles that cite this article can be accessed at:
http://bmj.com/cgi/content/full/319/7218/1162#BIBL
This article cites 10 articles, 7 of which can be accessed free at:
Rapid responses
http://bmj.com/cgi/eletter-submit/319/7218/1162
You can respond to this article at:
http://bmj.com/cgi/content/full/319/7218/1162#responses
free at:
One rapid response has been posted to this article, which you can access for
service
Email alerting
the top left of the article
Receive free email alerts when new articles cite this article - sign up in the box at
Topic collections
(3430 articles)
Health service research
(7007 articles)
Epidemiologic studies
(4248 articles)
Health policy
Articles on similar topics can be found in the following collections
Notes
http://group.bmj.com/group/rights-licensing/permissions
To Request Permissions go to:
http://journals.bmj.com/cgi/reprintform
To order reprints go to:
go to:
BMJ
11 Danesh J, Peto R. Risk factors for coronary heart disease and infection with Helicobacter pylori: meta-analysis of 18 studies. BMJ
1998;316:1130-2.
12 Goodman KJ, Correa P. The transmission of Helicobacter pylori. A criti-cal review of the evidence. Int J Epidemiol 1995;24:875-87.
13 Sitas F, Forman D, Yarnell JWG, Burr ML, Elwood PC, Pedley S, et al. Helicobacter pylori infection rates in relation to age and social class in a population of Welsh men. Gut 1991;32:25-8.
14 Feldman RA, Evans SJW. Accuracy of diagnostic methods used for epide-miological studies of Helicobacter pylori. Aliment Pharmacol Ther 1995;9(suppl 2):21-31.
15 Sonke GS, Beaglehole R, Stewart AW, Jackson R, Stewart FM. Sex differ-ences in case fatality before and after admission to hospital after acute cardiac events: analysis of community based coronary heart disease reg-ister. BMJ 1996;313:853-5.
16 Crabtree JE, Taylor JD, Wyatt JI, Heatley RV, Shallcross TM, Tompkins DS, et al. Mucosal IgA recognition of Helicobacter pylori 120KDa protein, peptic ulceration, and gastric pathology. Lancet 1991;338:332-5. 17 Pasceri V, Cammarota G, Patti G, Cucoc L, Gasbarrini A, Grillo RL, et al.
Association of virulent Helicobacter pylori strains with ischemic heart disease. Circulation 1998;97:1675-9.
18 Malaty HM, Engstrand L, Pedersen NL, Graham DY. Helicobacter pylori: genetic and environmental influences. A study of twins. Ann Intern Med 1994;120:982-6.
19 Collins R, Peto R, Gray R, Parish S. Large-scale randomized evidence: trials and overviews. In: Weatherall D, Ledingham JGG, Warrell DA, eds.
Oxford textbook of medicine. Oxford: Oxford University Press, 1996:21-32.
(Accepted 29 July 1999)
Economic transition and changing relation between income
inequality and mortality in Taiwan: regression analysis
Tung-liang Chiang
Abstract
Objective To examine the changing relation between income inequality and mortality through different stages of economic development in Taiwan. Design Regression analysis of mortality on income inequality for three index years: 1976, 1985, and 1995. Setting 21 counties and cities in Taiwan.
Main outcome measures All age mortality and age specific mortality in children under age 5.
Results When median household disposable income was controlled for, the association between income inequality and mortality became stronger in 1995 than in 1976. Especially, the association between income inequality and mortality in children aged under 5, with adjustment for differences in median household disposable income, changed from non-significant in 1976 to highly significant in 1995. In 1995, the level of household income after adjustment for income distribution no longer had a bearing on mortality in children under 5.
Conclusion The health of the population is affected more by relative income than by absolute income after a country has changed from a developing to a developed economy.
Introduction
Does relative income become more important than absolute income in determining population health
after a country has changed from a developing to a developed economy? By comparing countries that are members of the Organisation for Economic Coopera-tion and Development, Wilkinson showed that: (a) a strong relation exists between life expectancy and income distribution, whereas its relation with gross national product per capita is weak; and (b) a decrease in the prevalence of relative poverty is significantly related to a rapid improvement in life expectancy.1 2
Kaplan et al3
and Kennedy et al4
reported independ-ently that in the United States the relation between income distribution and mortality remained highly significant even after controlling for absolute income. Nevertheless, most of the studies on population health and relative income versus absolute income are cross sectional studies that were done in post-industrialised countries where the epidemiological transition is com-plete. I aimed to examine the changing relation between income inequality and mortality through different stages of economic development in Taiwan, using data at county and city level.
Taiwan, with a population of 21.3 million in 1995, is a newly industrialised country; its achievement in eco-nomic development has been frequently termed an “economic miracle” (table 1). In the early 1950s, Taiwan was a poor country with a gross national product per capita of no more than US$200 (£72 valued at 1950s prices).5
Since 1953 a series of economic development plans has been effectively implemented, and Taiwan’s economy has shifted from agricultural to industrial and from import oriented to export oriented.6
As a result, gross national product per capita has increased rapidly to US$1132 (£627 valued at 1976 prices) in 1976 and to US$12 396 (£7853 valued at 1995 prices) in 1995.5
The economic development of Taiwan has been identified not only with rapid growth but also with improved income distribution.7
Like most developing countries Taiwan had a large income gap in the early years of economic transition. The ratio of income share of the richest 20% to that of the poorest 20% in Taiwan reached 20.5 in 1953, but it decreased substantially to 4.2 in 1976 and then slightly increased to 5.3 in 1995.5
Similarly, the Gini coefficient—a commonly used meas-ure of the degree of income inequality, ranging from zero to a maximum of one—for Taiwan has decreased
Table 1 Basic socioeconomic and health indicators in Taiwan, 1953-955 7 8 9
Variable 1953 1976 1985 1995
Socioeconomic indicators
Population (million) 8.3 16.5 19.3 21.3 Population aged>65 (%) 2.5 3.6 5.1 7.6 Gross national product per capita (US$) 196* 1132 3297 12 396 Gini coefficient 0.56 0.28 0.29 0.32 Ratio of highest fifth’s income to lowest fifth’s 20.46 4.18 4.50 5.34 Health indicators
Crude death rate (per 1000) 9.4 4.7 4.8 5.6 Under 5s mortality (per 1000)† 21.1 3.9 2.1 1.9 Life expectancy (years):
Male 58.2 68.7 70.8 71.9
Female 61.4 73.6 75.8 77.8
*1952.
†Number of deaths in group aged 0-4 per 1000 population in same age group. Institute of Health Policy and Management, College of Public Health, National Taiwan University, Taipei 10018, Taiwan Tung-liang Chiang professor [email protected]. ntu.edu.tw BMJ1999;319:1162–5
from 0.56 in 1953 to 0.28 in 1976 and gradually increased to 0.32 in 1995.5
Besides being an “economic miracle” Taiwan has also achieved a “health miracle” (table 1). Since the 1950s, mortality has declined remarkably among all age groups in Taiwan. Improvement is especially significant in age specific mortality in children under age 5, which has decreased from 21.1 per 1000 popu-lation in 1953 to 1.9 per 1000 in 1995. Accordingly, life expectancy at birth in Taiwan has increased for males and females respectively from 58.2 years and 61.4 years in 1953 to 71.9 years and 77.8 years in 1995.8
With the decline in death rates Taiwan has experi-enced an epidemiological transition. In the early 1950s most of the leading causes of death in Taiwan were infectious diseases including gastroenteritis, pneumo-nia, tuberculosis, nephritis, bronchitis, and malaria. These began to give way to non-infectious diseases as the leading cause of death, and by the 1990s non-infectious diseases such as cancer, stroke, heart disease, hypertensive diseases, and diabetes mellitus have become dominant health problems in Taiwan.8
Methods
Source of data
I collected data for three index years: 1976, 1985, and 1995. Data on income were obtained from the family income and expenditure survey, conducted by the directorate-general of budget, accounting, and statis-tics, Republic of China. The family income and expenditure survey, which aimed to address the general conditions of livelihood and to present the status of family income and expenditure in Taiwan, was conducted mainly through personal interview. In order to check the validity of results from the interview a small number of households were asked to keep accounts. The survey covered the civilian non-institutionalised population of Taiwan, with about 15 000 registered households selected through a two stage stratified random sampling in a calendar year. The information collected included family composi-tion, housing conditions, family income and expendi-ture, fixed assets, mutual saving funds, and miscellane-ous items. The earliest available electronic data file on the family income and expenditure survey was for 1976.
Data on mortality were obtained from the Taiwan-Fukien Demographic Fact Book,9
which is published annually by the ministry of the interior. Two mortality measures were used in the analysis: mortality in all ages, and age specific mortality in children under 5 years. Mortality in children under 5, which refers to the number of deaths in the group aged 0-4 per 1000 population in the same age group, was presumed to be more sensitive to economic change than all age mortality. Further, the population of Taiwan has been ageing since the 1970s, and to compare crude death rates over the study period might be misleading because mortality depends strongly on age. Thus a direct method of age standardisation was introduced,10
and the all age mortality in any study year was adjusted to allow for discrepancies in the age structure of popu-lation by using the 1976 world popupopu-lation as the standard.
Measure of absolute and relative income
In the analysis absolute income was defined as median household disposable income after payment of taxes and receipt of benefits. Relative income was defined as the proportion of household disposable income received by households whose disposable income was below a specified centile on the distribution of household disposable income. For example, the relative income for the 50th centile in Taiwan in 1995 was 28.2% because the less well off 50% households received 28.2% of disposable income. Using data from the family income and expenditure survey I calculated relative income for the 20th, 50th, 70th, and 90th centiles for all 21 counties and cities and for Taiwan as a whole.
Statistical analysis
To determine the association between absolute and rela-tive income and measures of mortality I calculated Pearson correlation coefficients. Ordinary least squares multiple regression was further used to discover whether median household disposable income or the share of household disposable income received by the less well off 50% had more influence on mortality. For the regression analysis I presented squared multiple correlation coefficients as well as partial regression coef-ficients. The squared multiple correlation coefficient or R2
was interpreted as the proportion of the variance of the measure of mortality which was “explained” by the model comprising two predictors: median household disposable income and the share of household disposable income received by the less well off 50%.11
Because R2
must increase as further variables are intro-duced into a regression, I further presented adjusted R2
to take into account the chance contribution of each variable included.10
The partial regression coefficient or â was the amount by which the measure of mortality changed on the average when median household disposable income or the share of household disposable income received by the less well off 50% changed by one unit and the other remained constant.
Results
Association between mortality and income measures Table 2 shows Pearson correlation coefficients for the association between mortality and absolute income as well as income distribution. Although the association between all age mortality and median household disposable income remained highly significant (P < 0.001) across the three index years (Pearson
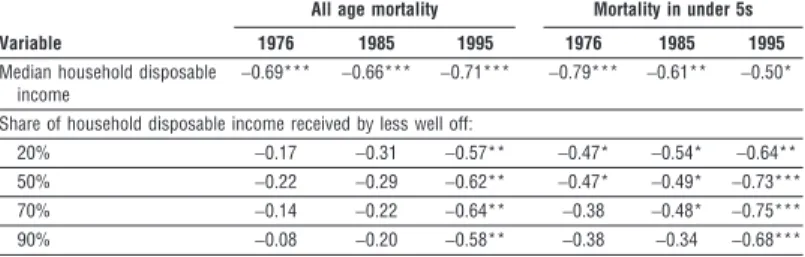
Table 2 Pearson correlation coefficients for relation between age adjusted mortality in
all ages and mortality in children under 5, and median household disposable income and the share of disposable income received by households below specified centile in Taiwan, 1976, 1985, and 995
Variable
All age mortality Mortality in under 5s 1976 1985 1995 1976 1985 1995 Median household disposable
income
−0.69*** −0.66*** −0.71*** −0.79*** −0.61** −0.50* Share of household disposable income received by less well off:
20% −0.17 −0.31 −0.57** −0.47* −0.54* −0.64** 50% −0.22 −0.29 −0.62** −0.47* −0.49* −0.73*** 70% −0.14 −0.22 −0.64** −0.38 −0.48* −0.75*** 90% −0.08 −0.20 −0.58** −0.38 −0.34 −0.68*** *P<0.05; ** P<0.01; *** P<0.001.
correlation coefficient −0.66 to −0.71), the association between mortality in children under 5 and median household disposable income tended to weaken from 1976 to 1995 (r =−0.79; P < 0.001 v r =−0.50; P < 0.05). The relation, however, between mortality and income distribution tended to strengthen over the study period, and the relation patterns were broadly consistent across the four measures of income distribution. In 1995 the share of household disposable income received by the less well off 20%, 50%, 70%, and 90% were all strongly correlated with all age mortality (Pearson correlation coefficient −0.57 to −0.64); the association with mortality in children under 5 was even stronger (−0.64 to −0.75). To the contrary, the associ-ation between mortality and income distribution was very weak in 1976, especially for all age mortality (−0.08 to −0.22). Only the association between mortality in children under 5 and the share of household disposable income received by the less well off 20% and 50% was statistically significant in 1976 (P < 0.05).
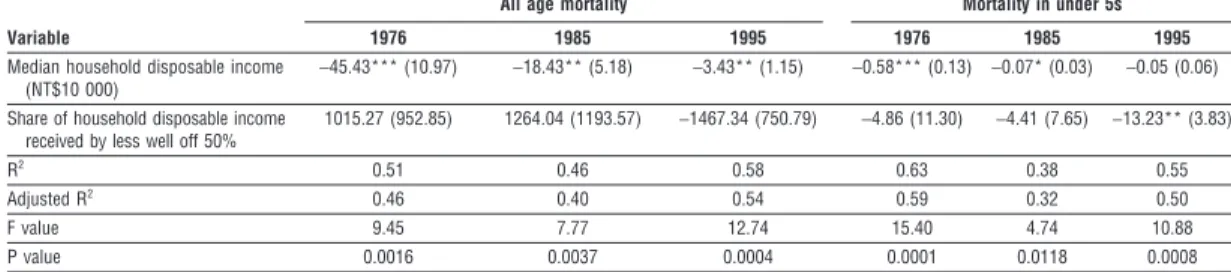
Relative importance of level of income v income distribution
Results from the ordinary multiple regression analysis of mortality on median household disposable income and the share of household income received by the less well off 50% show the relative importance of absolute income versus relative income in determining mortality (table 3). Overall, the proportion of the variance of mortality accounted for by the two absolute and relative income measures in any of the six multiple regression models was significantly high (at least P < 0.01). The value of R2
ranged from 46% to 58% for all age mortality and from 38% to 63% for mortality in children under 5. The adjusted R2
tended to have a value slightly lower than that of R2
across different measures of mortality and different study years.
Table 3 clearly indicates that, with median household disposable income constant, the association between mortality and the share of household dispos-able income received by the less well off 50% had become increasingly strong over the study period. On all age mortality, the effect of the share of household disposable income received by the less well off 50% with the adjustment of median household disposable income had changed from positive and non-significant in 1976 (â = 1015; P = 0.301) to negative and barely significant in 1995 (â = −1467; P = 0.064). On mortality in children under 5, which was presumed to be more sensitive to economic change, the effect of the
share of household disposable income received by the less well off 50% with the adjustment of median house-hold disposable income had even shifted from non-significant in 1976 (â =−4.86; P = 0.672) to highly significant in 1995 (â = −13.23; P = 0.003). It is worth noting that in 1995 median household disposable income no longer had a bearing on mortality in children under 5 after the share of household disposable income received by the less well off 50% was controlled for (P = 0.373).
Discussion
During the past two decades Taiwan has undergone critical stages of economic transition and become a newly industrialised country. This study shows that, contrary to the weak relation of income inequality to mortality in 1976, counties and cities with more equal income distribution in 1995 were more likely, with the adjustment of median household disposable income, to have a lower mortality (table 3). Especially, in 1995 the effect of income distribution on mortality in children aged under 5 became highly significant and the effect of median household disposable income became non-significant. Therefore, the Taiwan case examined here supports Wilkinson’s proposition that relative income is more important than absolute income in determining population health in devel-oped countries.12
In attempting, however, to generalise from this study it should be noted that Taiwan’s success in economic development is unique. Firstly, Taiwan has achieved economic transition in a very short period. Secondly, it has succeeded in combining a rapid growth of national economy with improved income distribution, which is different from the experience of Western industrialised countries.13
Thirdly, county and city income inequality has been significantly associated with the level of economic development as measured by median household disposable income (Pearson cor-relation coefficient 0.51 to 0.66). These and other factors such as drastic political reform in Taiwan since the 1980s might have conditioned the changing relation of income inequality to mortality.
Why is greater income equality associated with bet-ter health? Psychosocial stress from relative depriva-tion, disrupted social cohesion, disinvestment in social capital, and under investment in human resources all have been suggested as pathways through which income inequality affects population health,2 14 15
but only a small number of empirical studies to date have
Table 3 Multiple regression analysis of age adjusted mortality in all ages and mortality in children under 5 on median household
disposable income and share of household disposable income received by less well off 50% in Taiwan, 1976, 1985, and 1995 (standard errors in parentheses)
Variable
All age mortality Mortality in under 5s
1976 1985 1995 1976 1985 1995
Median household disposable income (NT$10 000)
−45.43*** (10.97) −18.43** (5.18) −3.43** (1.15) −0.58*** (0.13) −0.07* (0.03) −0.05 (0.06) Share of household disposable income
received by less well off 50%
1015.27 (952.85) 1264.04 (1193.57) −1467.34 (750.79) −4.86 (11.30) −4.41 (7.65) −13.23** (3.83) R2 0.51 0.46 0.58 0.63 0.38 0.55 Adjusted R2 0.46 0.40 0.54 0.59 0.32 0.50 F value 9.45 7.77 12.74 15.40 4.74 10.88 P value 0.0016 0.0037 0.0004 0.0001 0.0118 0.0008 *P<0.05; **P<0.01; ***P<0.001.
attempted to clarify the relation.3 16-19
Taiwan, as well as other newly industrialised countries blessed with a rapid economic transition, should provide a good opportunity for further work to understand mecha-nisms linking income inequality to health.
Conclusion
The health of the population is affected more by income distribution than by the level of income after a country has changed from a developing to a developed economy. Thus, a newly developed country such as Tai-wan should pay more attention to the consequences on population health of the gap between the rich and the poor and not merely healthcare reform.20
I thank Shu-Chen Liu, Shao-I Lin, and Tsung-Hsueh Lu for their help in data processing.
Funding: None.
Competing interests: None declared.
1 Wilkinson RG. Income distribution and life expectancy. BMJ
1992;304:165-8.
2 Wilkinson RG. Unhealthy societies: the afflictions of inequality. London: Routledge, 1996.
3 Kaplan GA, Pamuk E, Lynch JW, Cohen RD, Balfour JL. Inequality in income and mortality in the United States: analysis of mortality and potential pathways. BMJ 1996;312:999-1003.
4 Kennedy BP, Kawachi I, Prothrow-Stith D. Income distribution and mor-tality: cross sectional ecological study of the Robin Hood index in the United States. BMJ 1996;312:1004-7. [Important correction BMJ 1996;312:1194.]
5 Republic of China Council for Economic Planning and Development.
Taiwan statistical data book, 1998. Taipei: Council for Economic Planning and Development, 1998.
6 Li KT. The evolution of policy behind Taiwan’s development success. New Haven: Yale University Press, 1988.
7 Kuo SWY, Ranis G, Fei JCH. The Taiwan success story: rapid growth with
improved distribution in the Republic of China, 1952-1979. Boulder, CO: Westerview, 1981.
8 Republic of China Department of Health. Health and vital statistics, vol I.
General health statistics, 1997. Taipei: Department of Health, 1998. 9 Republic of China, Ministry of the Interior. Taiwan-Fukien demographic fact
book(published annually). Taipei: Ministry of the Interior. (Sources: 1973, 1976, 1985, 1995.)
10 Armitage P, Berry G. Statistical methods in medical research, 3rd ed. Oxford: Blackwell Scientific, 1994.
11 Goldstone LA. Understanding medical statistics. London: William Heinemann Medical, 1983.
12 Wilkinson RG. Health inequalities: relative or absolute material standards? BMJ 1997;314:591-5.
13 Kuznets S. Economic growth and income inequality. Am Econ Rev 1955;45:1-28.
14 Davey Smith G, Egger M. Commentary: understanding it all—health, meta-theories, and mortality trends. BMJ 1996;313:1584-5.
15 Kaplan GA, Lynch JW. Whither studies on socioeconomic foundations of population health. Am J Public Health 1997;87:1409-11.
16 Kawachi I, Kennedy BP, Lochner K, Prothrow-Stith D. Social capital, income inequality, and mortality. Am J Public Health 1997;87:1491-8. 17 Wilkinson RG, Kawachi I, Kennedy BP. Mortality, the social environment,
crime and violence. Sociol Health Ill 1998;20:578-97.
18 Daly MC, Duncan GJ, Kaplan, Lynch JW. Macro-to-micro links in the relation between income inequality and mortality. Milbank Q 1998; 76:339.
19 Wallberg P, McKee M, Shkolnikov V, Chenet L, Leon DA. Economic change, crime, and mortality crisis in Russia: regional analysis. BMJ 1998;317:312-8.
20 Chiang TL. Taiwan’s 1995 health care reform. Health Policy 1997;39: 225-39.
(Accepted 29 July 1999)
Visual field defect associated with vigabatrin:
observational cohort study
L V Wilton, M D B Stephens, R D Mann
Since Eke et al’s report of persistent visual field constriction associated with vigabatrin,1
several letters have been published in the BMJ, including that by Mackenzie and Klistorner,2
that draw attention to the occurrence of visual field changes in asymptomatic patients as well as those with symptoms.
Subjects, methods, and results
A prescription event monitoring study of vigabatrin conducted between 1991 and 1994 identified four cases of bilateral, persistent visual field defect for which there was objective evidence and no alternative cause given.3
The study cohort consisted of 10 033 living patients for whom questionnaires containing clinical information were returned (table). The mean duration of treatment for these four cases was 19.8 months; for the total cohort it was 14.2 months. Subsequently, we were informed of another seven patients in this cohort
in whom visual field defect had been reported after the end of the study’s observation period. This suggested that further cases might be identified if the period of observation was extended.4
The 7228 patients who were still taking vigabatrin at the end of the study were followed up by sending a simple questionnaire to their general practitioner to ask if vigabatrin treatment was continuing and whether any serious adverse events or changes in vision had been reported since the questionnaire had been returned. If patients had been referred for visual prob-lems, the ophthalmologist was asked to complete a questionnaire giving details of visual field testing before and during treatment with vigabatrin, to comment on the possible cause of the defect, and to send copies of test results.
The results of both studies are shown in the table. Altogether 2068 of the returned questionnaires were not considered further because they did not contain
Key messages
x Income distribution may be more important than the level of income in determining population health in developed countries but has not been examined in a country through different stages of economic development
x Along with economic development, gross national product per capita in Taiwan has increased rapidly from less than US$200 (£72) in 1953 to US$1132 (£627) in 1976 and to US$12 396 (£7853) in 1995 x In Taiwan the association between income distribution and
mortality was stronger in 1995 than in 1976, contrary to the association between absolute income and mortality, which was stronger in 1976 than in 1995
x The effect of income distribution on age specific mortality rate in children under 5 became highly significant whereas the effect of absolute income became non-significant in 1995
Drug Safety Research Unit, Southampton SO31 1AA L V Wilton
senior research fellow
M D B Stephens research associate R D Mann Director Correspondence to: L V Wilton admin@dsru. u-net.com BMJ1999;319:1165–6