具有創造新產品名聲能力之專案與品質等級
評選模式
Project and Quality-standard Selection Model with Prestige
Creation for New Product Development
張正昌
1Cheng-Chang Chang
徐文傑
2Wen-Chieh Hsu
陳珠龍
1Ju-
Long Chen
致理技術學院企管系 國立中央大學工業管理研究所 致理技術學院企管系暨服務業經管所 暨服務業經管所
1
Department of Business Administration, Chihlee Institute of Technology and 2
Institute of Industrial Management, National Central University
(Received June 1, 2010; Final Version February 17, 2011)
摘要:
持續性的進行新產品研發是企業維持競爭優勢的重要策略。本文針對新產品研發議題提 出一個新的 0-1 混合整數規劃專案評選模型。此模型考慮新產品研發計畫可區分成多重類別。每 一研發類別係指一特定現有產品的重新設計或性能的提升計畫,而各類別中另包含幾項研發專 案,每項專案係指該產品中某一特定子系統的重新設計或性能的升級。再者,本文假設每項研 發專案具有多重品質/技術等級可供研發的選擇,而且對一特定品質/技術等級而言,僅有一項 資源配置的方案能達到其要求的標準。此外,本文假設新產品的市占率取決於現有產品的品牌 名聲,以及新產品的各子系統品質/技術等級。而消費者對某公司品牌名聲評價則與該公司現有 產品的市占率有關。根據上述,我們建構了一個專案與品質等級的評選模型,藉以找出最佳的 新產品各子系統的品質等級組合及其執行排程,以極大化消費者對新產品的品牌名聲評價,進 而極大化化長期平均利潤。關鍵字:
新產品開發、專案選擇、品質等級選擇、品牌名聲Abstract: One of the ways by which a firm maintains an advantage over its rivals is by continually
developing new products. This requires a new product development strategy at the core of its
business efforts. What this paper presents is a mathematical model -- an alternative 0-1 mixed integer programming model -- for selecting projects for new product development (NPD). Such a model considers the situation in which each NPD program can be placed as multiple categories. Each R&D category would refer to a creative project to redesign or upgrade a specific product. A category would involve several projects, each project addressing the redesign or promotion of a specific subsystem of the production process. Each project, moreover, would have a list of quality/technology standards to select from with only single resource-allocation proposals available for realizing a specific quality-standard. It is assumed that the market share of a new product depends on brand-prestige and the portfolio of quality-standards; the brand-image judgment of a consumer would depend on the market share of products offered in a current period. This study proposes a project and quality-standard selection model for finding an optimal portfolio of quality-standard new products and a schedule for maximizing the expected brand-image judgment of consumers. The aim is to achieve long-run average profitability.
Keywords: New Product Development, Project Selection, Quality-standard Selection, Brand Prestige
1. Introduction
In recent years, a harsh competitive environment has pushed companies into developing unique, high quality fashionable products in order to attract customers and sustain competitive advantages. One of the important strategies for doing this is through new product development (NPD) (Brown and Eisenhardt, 1995; Day and Wensley, 1988).
NPD is a process by which an organization transforms data on market opportunities and technical possibilities into information assets for commercial production (Clark and Fujimoto, 1991). It includes the enhancement of the brand image of an enterprise and its marketing position (Robert, 1993). In the course of development, this process can influence the performance of the whole operation. The success of the NPD is closely associated with the selection of R&D Projects under a resource-constrained scenario (Pedro and Francisco, 2009; Robert, 1999; Rutsch et al., 2006).
Meade and Presley (2002) reveal four major topics for R&D project selection which are of interest to scholars. They include: (i) the need to set the related criteria of project selection corresponding to corporate strategies, (ii) the issue of qualitative benefits and risks in producing the new product, (iii) the desire to reconcile and integrate the needs of different stakeholders, and (iv) the need to consider the multi-stage levels of group decision processes. Baker and Freeland (1975), Martino (1995), Henriksen and Traynor (1999) present an excellent survey of these interests.
From a methodological viewpoint, project selection issues may be seen as belonging to four classes: The first is mathematical programming, including integer planning, linear programming and non-linear programming, and selecting the best project association under various kinds of limiting conditions. The second is cognitive emulation models, utilizing linear return, decision tree, and an expert system to develop the operations path. The third is AD HOC methods that include top-down policy, genius award, and systems approach. The fourth is measurement methods for assessing the performance of projects and for choosing the projects (Hall and Nauda, 1990).
Most of the past studies related to R&D project selection under a constrained budget fail to consider the case in which the budget is periodically needed – resulting in project scheduling delays (Asher, 1962; Cooper and Kleinschmidt, 1988; Henriksen and Palocsay, 2008). Sun and Ma (2005) propose a packing-multiple-boxes model for choosing the R&D projects with a specific time horizon. The authors, however, overlook the situation in which R&D projects may be separated into multiple categories or when there are multiple choices of quality-standards for each project (Nishihara and Ohyama, 2008). They also fail to consider the case where a manager hopes each R&D project category is completed within a specific time horizon. Indeed, if we treat the attempt of redesigning/upgrading a specific kind of product as a project category and treat the effort of redesigning/upgrading a specific subsystem of an existing product as a project in a category, then the multi-category project selection becomes a central issue. Furthermore, most traditional investigations neglect the value of a project when the target (or ideal) quality-standard is not realized.
However, in practice, a project may have multiple choices of quality-standards and get a non-zero value regardless of a below-the-ideal quality-standard. On the other hand, the top-manager usually hopes any new product is launched before a specific time horizon has elapsed because major competitors will put in competitive products in the market after this period.
Except for the cases mentioned-above, traditional literature has not probed into project selection from the viewpoint of brand-prestige creation. In general, the price of a product and the corresponding quality-standard may directly influence the consumers' intention to purchase or repurchase (Lichtenstein et al., 1993). “Brand Image” has also been shown as a key factor in sales (Fichter and Jonas, 2008; Kwon and Sharron, 2009; Maxwell et al., 2008). Thus, if the decision makers of a firm present the new products under a policy of creating brand-prestige in the long-run, the firm may be rewarded with a high profitability average in the long-run. In this paper we assume that the market share of a new product depends on the brand recognition of consumers and the portfolio of quality-standards of new products. However, the brand-image judgment of consumers depends on the market share of products currently in circulation. Accordingly, we propose a project and quality-standard selection model to find an optimal portfolio of quality-standards of new products and the associated optimal schedule thereby maximizing the expected brand-image judgment of consumers,
which may benefit the market share of the existing products and the future development of new products (Keown et al., 1979; Kolisch et al., 2005; Kurt and Christian 1999).
2. Choice of Project Advancement Strategy
The success of an R&D project usually depends on both hard and soft factors. Hard factors are measurable by a quantitative method, i.e. the number of engineers and the amount invested in the project. Soft factors are not measurable by a quantitative method; they refer to intangibles such as the control ability of a project leader and the historical experience of an engineer. Chang and Chen (2007) propose four types of project advancement strategies to aid decision-maker in selecting projects -- taking soft factors into account. Such a project advancement strategy is also termed a resource allocation and transfer strategy. They consist of the following types:
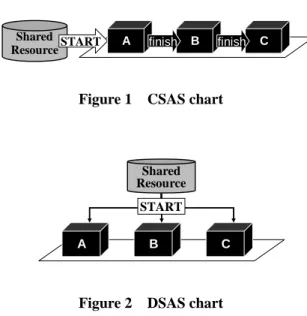
Centralized sequential advancement strategy (CSAS): This means centralizing the available
amount of a periodic budget into a R&D project; the periodic budget is transferred onto another project once the assigned quality-standard of R&D project has been achieved. All projects thus achieve their assigned quality-standards. Supposing there are three projects: A, B and C. Then CSAS would be depicted as Figure 1.
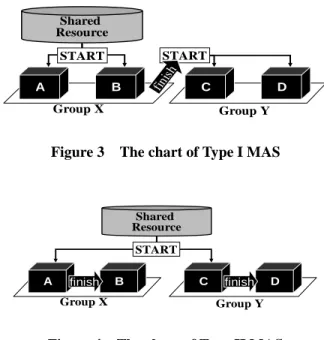
Decentralized synchronized advancement strategy (DSAS): This entails decentralizing the
available amount of periodical budget into all R&D projects until all projects achieve their quality-standards assigned. Supposing there are three projects: A, B and C. Then DSAS would be depicted as Figure 2.
Figure 1 CSAS chart
Shared Resource
A B C
START
Figure 2 DSAS chart Shared
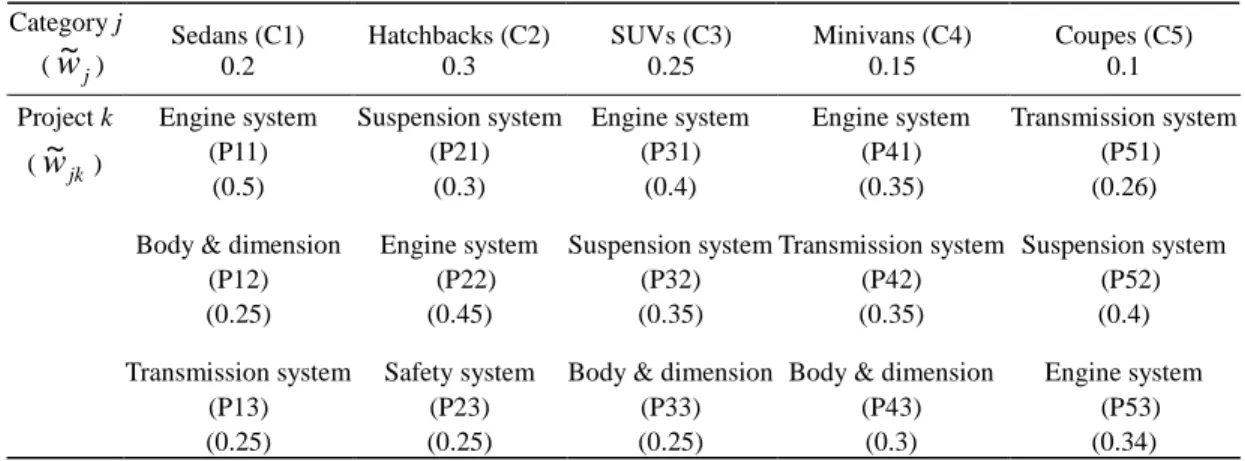
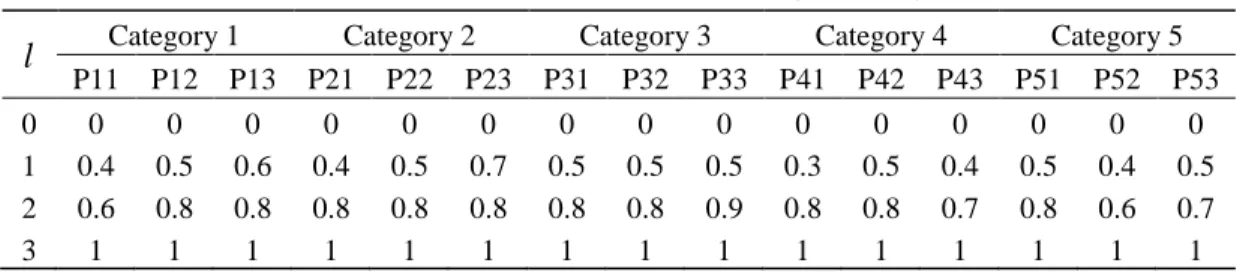
Type I and Type Ⅱ mixed advancement strategies (Type I, Type Ⅱ MAS): Consider the projects
A, B, C and D, and divide the four projects into two categories: {A & B} and {C & D}, which are referred to as “X” and “Y” respectively. Type I MAS involves deploying the CSAS within the categories X and Y, while going ahead between categories X and Y with the DSAS, as shown in Figure 3. On the other hand, Type II MAS entails deploying the DSAS within the categories X and Y, while going ahead between categories X and Y with the CSAS; i.e., transferring the periodic budget onto the projects in category Y where only the assigned quality-standards for all projects in category X are realized, as shown in Figure 4.
This article borrows a specific project advancement strategy for solving some settings caused by soft factors. Clearly, the problem considered in this article fits type I MAS and type II MAS. In general, the major advantage of type I MAS is the efficiency of resource-utilization. The major disadvantage is the diversification of the managerial ability of a project-leader, which leads to variation in progress growth and quality. In contrast to type I MAS, the major advantage of type II is the focus on project-management by a project-leader; this leads to reduced variation in progress and quality. The major disadvantage of this strategy is having less efficient resource-utilization; the new product developed may later slip into a lower quality-standard when the time horizon concerned with the decision-maker has elapsed. This will lead to a weakening of a firm’s competitive advantage. In practice, the choice of Type I or Type II strategy depends on the actual situation on the ground. In this paper, we only focus on the model of Type II MAS.
Shared Resource A B C D Group X Group Y START START finis h
Figure 3 The chart of Type I MAS
Shared Resource
A finish B C finish D
START
Group X Group Y
3. Type II MAS Based Project Selection Model
3.1 Definition of quality-standard of a particular subsystem
This section first defines the quality-standard of a particular subsystem of a product. This refers to the collection of core quality indicators of the subsystem. To illustrate: in an automobile system, the important indicators of the quality of a vehicle engine would be horsepower, torque, and fuel consumption; let us say that the relevant values of these indicators are 150hp, 19.3kg-m, and 12.4km/l respectively. It is necessary to improve at least one of these indicators if a car manufacturer wants to upgrade the vehicle’s systematic efficiency. Suppose torque and fuel consumption are selected for improvement. The indicator of torque is upgraded from 19.3kg-m to 22.7kg-m while fuel consumption is improved from 12.4km/l to 13.2km/l. Thus, the relevant indicators of the engine system become: 150hp, 22.7kg-m, and 13.2km/l. According to this study, the car’s quality-standard of engine system is thus upgraded/ redesigned as well.
3.2 The Problem
Let us consider a company that plans to drive a new product program in a bid to maintain/increase its occupation rate of the market. For example, an automaker introduces a new type of car. The NPD program can be divided into several categories with each category reflecting a new product development; for example, in the case of the automobile manufacturer, a sports car. A category would also include several projects, each project referring to redesigning/upgrading a specific subsystem of an existing product. For instance, a project may refer to redesigning/upgrading the engine system of the sports car.
If a top manager hopes that any new product is rendered before a specific time horizon has elapsed, such a time horizon is called “value-based time limit” since there is a manifest value-loss if a specific type of new product is rendered after the major competitor offerings. Simply put, value-based time limit coupled with a new product is the time horizon for the major competitors to produce a competitive product market after the original time horizon has elapsed.
3.3 Assumptions of consumer behavior
From the above problem description we see that each R&D project’s contribution value is going along with value-based time limit. Therefore, if each periodic budget is inadequate for realizing the target standards of each R&D project, then we would have to find a portfolio of quality-standards for developing new products. To do this, we have to follow two assumptions of consumer behavior:
A1: The market share of a new product offered in a target market depends on the brand-image
A2: The brand-image judgment of consumers depends on the market share of products offered within a
target market.
3.4 Framework of the proposed project selection
Consider a (J,Kj)multi-standard project selection problem, where J denotes the number of new product development (or the number of R&D categories), K denotes the number of projects for j
productj,j=1,2,,J. It is assumed there are multiple choices of quality-standards for projectkin product j , numbered by levels 0,1,,Ljk.wherein level 0 refers to ‘do nothing’, i.e., the subsystem corresponding to project k in product j is not selected or upgraded. Also, Ljk refers to the
ideal quality-standard. Corresponding to our assumptions of consumer behavior, we divide consumers in a given target market into Group 1 and Group 2. The consumers in Group 1 decide their brand-image score of products offered by a particular firm only by their perception with regard to the demanding atmosphere of a specific new product offered by this firm. Consumers, however, in Group 2 decide the brand-image score by their perception with regard to demanding atmosphere of all new products. The consumers in Group 1 use their perception of the demanding atmosphere of a particular new product to decide on brand-image of the commodity offered by a firm. The consumers in Group 2, however, apply their perception of demanding atmosphere to all new products. Based on this premise, we further consider that the brand-image score for a consumer is measured by levels 0 and 1. A consumer in Group 1, for example, who believes that the commodity offered by a firm is respectable or gives it brand-image score at level 1 if he feels that a specific new product is going to be best seller. On the other hand, this same consumer believes that it is not respectable or gives it brand-image score at level 0 if he feels otherwise. By the same token, a consumer in Group 2 who believes that the commodity offered by a firm is respectable or gives it brand-image score at level 1 if he feels that all new product are going to be best sellers. On the other hand, this same consumer believes that it is not respectable or gives it brand-image score at level 0 if he feels otherwise. Let
j
z
denote the market share for new product j . According to the definition ofz
j, we further define ) , , , , (z1 zj zJV as the total expected number of consumers who give the new products brand-image score at level 1 as the portfolio of market shares for all products is at level
) , , , ,
(z1 zj zJ . Yet, Vj(zj)refers to the expected number of consumers in Group 1 who perceive
that product
j
is a popular commodity as its market share is at levelz
j,
and β(z1,z2,...,zJ) represents the expected number of consumers in Group 2 who perceive that all new products are best sellers once the portfolio of market shares is at level (z1,,zj,,zJ) . Accordingly,) , , , , (z1 zj zJ
V can be computed as the summation of consumers in Group 1 and Group 2 who will give the new products brand-image score at level 1, indicated as follow:
) ,..., , ( ) ( ) ,..., , ( 1 2 1 2 J j j j J V z z z z z z z V =
∑
+β (1)Note that the market share of a certain product offered by a firm defined here is measured by the percentage of the number of this product in the current market. Thus, zj is a real number on interval [0,1] for any product j .
Assuming that there is a minimum value of market share, sayz , for each new product such that lj
almost all of consumers in Group 2 will perceive that all new products are best sellers aszj ≥zlj for all j According to the definition of . β(z1,z2,...,zJ), we know that β
(
1,1,...,1)
represents the maximum number of consumers in Group 2 who will give the new products brand-image score at level 1. As mentioned above, a consumer who gives the new products brand-image score at level 1 if he feels that the new products are going to be best sellers. Based on this premise, we know that the value of β(
z1l,z2l,...,zJl)
should extremely approach the value of β(
1,1,...,1)
. Thus, this study furtherassumes that
(
)
β(
)
ε β − l ≤ J l l z z z, ,..., 1 ,..., 1 , 1 1 2 (2)where ε is an extremely small number.
Yet, consider a project selection problem with multiple choices of quality-standards for each project. Whenever a quality-standard is assigned to a project of a new product, a specific portfolio of cost and time-periods is required to be invested in. Accordingly, if we let P be a feasible portfolio of quality-standards for all project that satisfies the resource constraints and the value-based time limit conditions, then the framework of the proposed project selection model may be formulated simply as below (according to A1-A2)
) , , , , ( maximize 1 j J P V z z z Ω ∈ (3)
where Ω is the set consisting of all feasible portfolios of quality-standards for all project.
Furthermore, with the use of (2), we can treat the value of β(z1,z2,...,zJ)as a constant once the value of
z
j is limited to the condition of more than the value of z . Because such a constant also ljdenotes the maximum number of consumers in Group 2 who will give the new products brand-image score at level 1, optimization problem (3) almost is equivalent to following Problem (4).
∑
= ∀ ≥ Ω ∈ = 1 2 1 , ) ( ) ,..., , ( ~ Maximize j j j J j z z P z V z z z V l j j (4)3.5 Multi-standard and single-resource-allocation model
For the purpose of this research, this article defines such a model as one which has the following characteristics:
- There exist multiple choices of quality-standards for each project in a specific R&D category. - It is necessary to invest in a certain amount of cost for each period.
- It is permissible that the non-equal amount of cost is invested in each period for realizing a specific quality-standard of a project in a specific R&D category.
- The remaining available budget of previous period can be used in the next period.
- There exists only a portfolio of the cost and period to realize a specific quality-standard of a project in a specific R&D category.
- There is an extra influx of fund for each period but the total cost for conducting all projects is limited to a certain amount of budget.
- A specific value-based time limit associates with each R&D category, which limits the finish time of all projects in this category.
In order to formulate such a model, a list of extra notations is given as follows: Parameters
j Index of a R&D product, j=1,2,,J;
k Index of a project related to a new product development. For example, k=1,2,,Kj
corresponding to R&D productj;
l Index of a quality-standard related to a project in a R&D product development. For example, l=0,1,2,...,Ljk corresponding to project k in R&D product j;
jkl
w Weight with regard to project k contributing to the market share of new product j when project k’s quality- standard is at level l ;
jkl
D Time period required to invest in cost for achieving the goal at assigned quality-standard
l
of project kin R&D productj
, l=0,1,2,...,Ljk; djkl
R Amount of cost required to invest in th-d period for achieving the goal at assigned
quality-standard
l
for project k in R&D product j ,jk
L
l=0,1,2,..., , d=1,2,,Djkl;
B Budget available for each period;
j
T The value-based time limit for each R&D productj,j=1,2,,J;
ACB Total budget limitation for conducting all projects; Decision Variables
jkl
I Binary variable that takes value 1 if the assigned quality-standard is at level l for
project k in R&D product j , and 0 if otherwise.
j
t
Time period required to invest in cost for R&D product j ;j
b
Average amount of cost invested in each period for R&D product j ;jk
jk
f Finish time of conducting project k in R&D product j ;
j
S Start time of conducting projects in product j (note that Sj = refers to R&D product t
j
is started at the end of time t−1or at the beginning of timet
);j
f Finish time of R&D product j (note that fj =t refers to R&D product j is finished
at the end of time t−1or at the beginning of time t).
For further formulating the model, we first decide the sequence of R&D products by designating that the larger product-index
j
implies the longer time horizon of Tj, and the bigger value of Tjimplies the lower priority for investing in this R&D product. Accordingly, it yields that S1=0and . , , 2 , 1 j J f
Sj = j− = Yet, assuming that d jkl
R is non-decreasing in d. Based on this premise, this study further defines ∆j as follows:
∆j=B0tj+∆j−1−bjtj,j=1,,J
and
0 0= ∆
The value of ∆j refers to the remaining budget which is available once the projects in R&D product j are finished. Subject to the technical complexity of the proposed problem, in this study we only consider the schedule that any project starts at the latest time under a given invariant schedule-duration of the program (involving all projects), which allows us to formulate a model by using mathematical programming and find a near-optimal solution. In this case, we know
. , , 0 k j I D f S jk L l jkl jkl jk jk = −
∑
⋅ ∀ = (5) and k j f fjk= j,∀, (6)Accordingly, we know that any feasible project schedule has to satisfy the following constraint:
1 ~ ) 1 ~ ( − = ∆ + + − ⋅ ≤
∑
j j t S t t j B t S c j , Sj ≤~t ≤ fj−1 (7) wherec
tj denotes the required cost at timet
for conducting the projects in categoryj
.Because
R
djkl is non-decreasing ind, it yields , ) 1 ~ ( 1 ~ − = ∆ + + − ⋅ ≤∑
j j j t S t t j b t S c j 1 ~≤ − ≤ j j t f S (8)Therefore, any project schedule satisfies the condition of bj ≤B0, this solution will also satisfy the
, ) 1 ~ ( 1 ~ − = ∆ + + − ⋅ ≤
∑
j j t S t t j B t S c j 1 ~≤ − ≤ j j t f S (9)Accordingly, the multi-standard and single-resource-allocation model may be approximately formulated as below: Objective Function: maximize V~=
∑
Vj( )
zj (10) Subject to Z w I j jkl L l K k jkl j jk j ∀ ⋅ =∑∑
= = , 0 1 (10.1) j z zj≥ lj,∀ (10.2) j t b I R j j K k D d L l jkl d jkl j jkl jk ∀ ⋅ = ⋅∑∑∑
= = = , 1 1 0 (10.3) j,k I D t jk L l jkl jkl j , 0 ∀ ⋅ ≥∑
= (10.4) ACB t b J j j j⋅ ≤∑
=1 (10.5) j B bj≤ ,∀ (10.6) k j I D f S jk L l jkl jkl jk jk , , 0 ∀ ⋅ − =∑
= (10.7) k j f fjk = j,∀, (10.8) j t f j i i j=∑
∀ = , 1 (10.9) 0 1= S (10.10) 2 , 1 ∀ ≥ = f − j Sj j (10.11) j T fj≤ ,j ∀ (10.12) j , k , I jk L l jkl = ∀∑
= 1 0 (10.13) l k j Ijkl=0,1 ,∀ , , (10.14) j bj≥ ,0∀ (10.15) j tj≥ ,0∀ (10.16)where (10.1) warrants the consistency of the definitions regarding the market share of a new product, (10.2) ensures that the market share z is expected realized at very least, (10.3) warrants the lj
consistency of the definitions regarding the amount of cost invested in a R&D product, (10.4) ensures that the time period invested in a specific R&D product satisfies the requirements of each project in
this R&D product, (10.5) ensures that the amount of cost invested in all R&D products is not more than the total budget available, (10.6) ensures that the average amount of cost invested in each period for R&D product
j
is not more than the amount of budget available for each period, (10.7)-(10.11) warrants the consistency of the definitions regarding the start time and finish time of a project, (10.12) ensures that the finish time of a R&D product is not more than the value-based time limit associated with it, and (10.13) ensures just a level of quality-standard is assigned to a project.Note that the result of Ijk0=1 means that project k in R&D product j is not selected and the subsystem k of product j is not developed or upgraded as well. Therefore, after solving problem (10)-(10.16), one can find (1) the projects selected in each R&D product, (2) the quality-standards assigned to each project in a specific R&D product, and (3) the baseline schedule for implementing the chosen projects.
3.6 Further consideration
To solve the proposed model, the form of value function has to be decided. For simplicity, replacing
jk
L jk
w
, byw
jk and considering the case in which there exists a strictly increasing function, say ujkl, such thatwjkl =wjkujkl, where 0≤ujkl≤1and ujk0=0,ujk,Ljk =1. Note that the targetmarket share of new product
j
is the value of∑
k jk
w and the introduction of parameter
u
jkl may help the decision-makers to understand the percentage of realizingw
jk.Furthermore, letting
w
~
jk denote the normalized weight so that∑
= m jm jk jk w w w~ (11)According to (12), Constraint (10.1) may be rewritten as
∑∑
= = = ⋅ = jk j L l K k jkl jkl jk j w u I j J z 0 1 , , 2 , 1 , ~ ~ 2 (12)Notice that the value of
z~
j may be predicated as the percentage of realizing the target market share of new product j (i.e.,∑
k jk
w ). Similarly, Constraint (10.2) may be rewritten as
J j w z z k jk l j j , 1,2, , ~ ≥ = 2
∑
(13)By letting αj denote the expected consumer population in Group 1 (defined in section 3.3) for
giving the brand-image score at level 1 as ~ =zj 1. Then, this article defines that the value of
∑
j j
α is the target performance of brand-prestige creation. Yet, it is assumed that there exists a continuous
and strictly increasing function, say U ~j
( )
zj , such that the value function have following equivalent relationships:( )
∑
( )
∑
Vj zj ≅maximize jUj ~zj maximize α (14) where 0≤Uj( )
zj ≤1, and Uj( )
1 =1,Uj( )
0 =0.Note that Uj(~zj) may be predicated as the percentage of realizing the value of αj given the
value of z~j. This study only examines the special case in which Uj(z~j)=~zj. Based on above, if j
w~ means the normalized value of αj then project selection model (10)-(10.16) is equivalent to the following problem: j J j j j J j jU z w z w~ (~ ) ~ ~ maximize 1 1
∑
∑
= = = (15) Subject to∑∑
= = = ⋅ = jk j L l K k jkl jkl jk j w u I j J z 0 1 , , 2 , 1 , ~ ~ 2 (15.1) J j w z z k jk l j j , 1,2, , ~ ≥ = 2∑
(15.2) j t b I R j j K k D d L l jkl d jkl j jkl jk ∀ ⋅ = ⋅∑∑∑
= = = , 1 1 0 (15.3) j,k I D t jk L l jkl jkl j , 0 ∀ ⋅ ≥∑
= (15.4) ACB t b J j j j⋅ ≤∑
=1 (15.5) j B bj ≤ ,∀ (15.6) k j I D f S jk L l jkl jkl jk jk , , 0 ∀ ⋅ − =∑
= (15.7) k j f fjk= j,∀, (15.8) j t f j i i j=∑
∀ = , 1 (15.9)0
1=
S
(15.10)2
,
1∀
≥
=
f
−j
S
j j (15.11) j T fj≤ ,j ∀ (15.12) j , k , I jk L l jkl = ∀∑
= 1 0 (15.13) l k j Ijkl=0,1 ,∀ , , (15.14)j
b
j≥ ,
0
∀
(15.15)j
tj≥ ,0∀ (15.16)
Because the quantity of
∑
w~jUj( )
~zj may be explained as the percentage of achieving the idealperformance of brand-prestige creation which is defined as the value of
∑
wj. And the evaluation of parameter w~j is easier than the evaluation of parameter αj, the parameters transform for αj toj
w~ and zj to z~j not only transform original model (10)-(10.16) into a real solvable form (i.e., (15)-(15.16)) but also provide the objective value a clear managerial implication.
3.7 Evaluation of model parameter
Letting Nj denote the expected consumer population for purchasing product j in a target
market, Njk denote the expected consumer population for making decision of purchasing product
j and depending on the quality-standard of subsystemk. Furthermore, let Nejkl denote the expected
consumer population for making a decision to buy product j , offered in the firm, given the assigned quality-standard of subsystem
k
is at the level l(l=1,2,,Ljk). Then, one may obtain the value ofw
jkl by the following formula:j e jkl jk e jk j jk jkl N N N N N N w = ⋅ = (16)
After obtaining the value of parameter
w
jkl, one can further obtain the value of parameter ujklby computing the value of wjkl/wjk. Note that obtaining the individual actual values of Nj and
e jkl
N may be difficult; however, one may easily employ a questionnaire method to evaluate the value of j e jkl N N .
For the evaluations of w~j and z , one can design a questionnaire to obtain the information in lj
relation to the consumers in Group 1or Group 2. For example, consider two new products A and B. One may request a consumer to answer the problem: “what is the situation that will influence his/her brand-image?” If a certain consumer claims that the popular new products A or B will be, then this consumer can be classified into Group 1. On the other hand, if this consumer claims that the popular new products A and B will be, then this consumer can be classified into Group 2. Moreover, a second problem can request a consumer to answer for obtaining w~j and z . This problem is “what is the lj
minimum size of market share of a particular new product for enabling him/her to believe that this new product is popular?” After obtaining the information in relation to the two problems mentioned-above, one may evaluate the value of z by some methods. Because the too big estimated lj
value of z may imply no solution in resolving (15)-(15.16), this study suggests that the median or lj
average value of observed samples is a feasible selection. Despite such suggestion may not confirm the requirement of Equation (2); however, this method allows us to formulate an approximated model like (10)-(10.16) to resolve the dilemma of Equation (1).
Furthermore, letting nj denotes the number of respondents who belong to Group 1 and believe
that product j will influence their brand-image under ≤
∑
k jk j w
z . Then, one can estimate the
value of value of w~j by computing value of
∑
i j n n .4. Illustrative Example
In this section, we present an example of new car development to demonstrate the proposed model. The aim of the decision maker is to select the most appropriate projects and their quality standards so as to maximize the expected brand-image judgment of consumers. In general, consumer’s criteria for buying a car may differ owning to the individual preference of consumers. For instance, the criteria of a consumer towards buying a specific type of car may include power engine system, body and dimension, and security system etc. In this case, we take common car styles as an example and divide these cars into five categories. They are Sedans, Hatchbacks, SUVs, Minivans, and Coupes. Each category includes three projects with regard to the attempt of resigning/upgrading a specific subsystem of the car; this can be seen in Table 2. The parameters of
w
~
j andw
~
jk are shown in Table 1 as well. Yet, the value-based time limits for R&D categories 1 through 5 are respectively 16, 15, 18, 23, and 29 time-units. The value ofz
lj for j=1,2,2,5, is given by 0.17, 0.1, 0.18, 0.1, and 0.19.Table 1 Projects of the category of car types Category j (
w
~
j) Sedans (C1) 0.2 Hatchbacks (C2) 0.3 SUVs (C3) 0.25 Minivans (C4) 0.15 Coupes (C5) 0.1 Project k (w
~
jk) Engine system (P11) (0.5) Suspension system (P21) (0.3) Engine system (P31) (0.4) Engine system (P41) (0.35) Transmission system (P51) (0.26) Body & dimension(P12) (0.25) Engine system (P22) (0.45) Suspension system (P32) (0.35) Transmission system (P42) (0.35) Suspension system (P52) (0.4) Transmission system (P13) (0.25) Safety system (P23) (0.25)
Body & dimension (P33) (0.25)
Body & dimension (P43)
(0.3)
Engine system (P53)
Table 2 Percentage of realization of wjk (i.e.,ujkl)
l
Category 1 Category 2 Category 3 Category 4 Category 5P11 P12 P13 P21 P22 P23 P31 P32 P33 P41 P42 P43 P51 P52 P53 0 1 2 3 0 0.4 0.6 1 0 0.5 0.8 1 0 0.6 0.8 1 0 0.4 0.8 1 0 0.5 0.8 1 0 0.7 0.8 1 0 0.5 0.8 1 0 0.5 0.8 1 0 0.5 0.9 1 0 0.3 0.8 1 0 0.5 0.8 1 0 0.4 0.7 1 0 0.5 0.8 1 0 0.4 0.6 1 0 0.5 0.7 1
The data listed in Table 2 indicate the values of ujkl. The data listed in Table 3 indicate the
periodical cost and the period required to invest in a project for achieving a specific assignment of quality-standard.
Given B0=9, ACB=186and based on the data of Tables 1 through 3, we can fined the values of (Ijkl,
t
j, bj,S
jk,f
jk, Sj, fj ) by resolving (15)-(15.16). The results are exhibited in Table4 (resolved by employing LINGO 8.0 software tool).
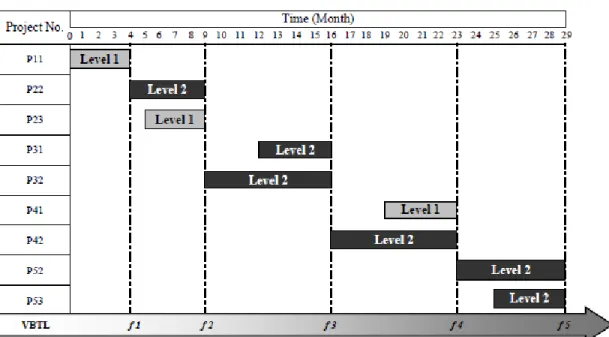
The results of Table 4 are depicted in Figure 5. To illustrate: the chosen projects in category 2 (i.e., Hatchbacks) are project 2 (the improvement of the engine system) and project 3 (the improvement of safety system). The quality-standards assigned to these two projects are respectively at level 2 and 1. Yet, the period invested in Sedans, Hatchbacks, SUVs, Minivans and Coupes are respectively 4, 5, 7, 7 and 6 units of time. Finally, the total cost required for achieving the assigned quality-standards of these two projects is 40 units that are obtained by computing the value of
b
2⋅
t
2.5. Discussion and Conclusion
The problem of new product development under a constrained budget may be formulated as a R&D project selection problem. Traditional budget-constrained R&D project selection problems failed to consider the situations in which the quality-standard assigned for each project are at multiple levels available; the amount of cost for achieving a specific quality-standard of a project is needed periodically; and the contribution of a project declines over time. In addition to hard factors mention-above, previous studies regarding a R&D project selection problem also failed to consider the soft factors influencing the project performance such as the managerial and control ability of decision-makers. Clearly, such a study cannot completely respond to all practical events. In this paper we have proposed a project selection model for a new product development program taking above factors into account. Assume that the decision-makers of a manufacturer adopts type Ⅱ mixed advancement strategy (MAS) after considering soft factors related to this R&D program.
具有創造 新產品 名聲能 力之專 案與 品質等級 評選模 式 4 0 1
Tables 3 Periodical cost and the period required to invest in a project for achieving a specific assignment of quality-standard
Budget amount
Category 1 Category 2 Category 3 Category 4 Category 5 P11 P12 P13 P21 P22 P23 P31 P32 P33 P41 P42 P43 P51 P52 P53
Standards Standards Standards Standards Standards Period 1 2 3 1 2 3 1 2 3 1 2 3 1 2 3 1 2 3 1 2 3 1 2 3 1 2 3 1 2 3 1 2 3 1 2 3 1 2 3 1 2 3 1 2 3 1 3 3 3 3 3 3 3 4 4 3 4 4 4 4 4 4 4 4 4 4 5 3 3 4 5 5 5 4 4 4 3 3 3 4 5 5 4 5 4 3 3 3 4 5 6 2 4 3 4 3 3 3 4 4 4 4 4 4 4 4 5 4 4 4 4 5 5 3 3 4 5 5 5 4 4 4 3 3 3 4 5 5 4 5 4 3 3 3 4 5 6 3 4 4 4 3 3 4 4 5 5 4 4 4 4 4 5 5 4 5 5 5 5 4 3 5 4 5 5 4 4 5 3 3 4 4 5 5 4 5 4 4 4 4 4 5 6 4 5 4 4 3 4 4 5 5 5 5 4 5 4 5 5 5 5 5 5 5 5 4 4 5 4 5 5 4 5 5 4 4 4 4 5 6 5 5 5 4 4 4 4 5 6 5 4 5 4 4 4 5 5 5 4 5 5 5 5 5 5 4 5 5 5 5 5 4 4 4 6 5 5 4 4 6 4 5 5 6 5 4 5 5 5 4 4 6 4 5 7 5 5 6 5 5
Table 4 The values of decision variables to propose model
Project selected (level)
Category 1 Category 2 Category 3 Category 4 Category 5
P11(1) P22(2), P23(1) P31(2), P32(2) P41(1), P42(2) P52(2) , P53(2) j
t
4 5 5 7 6 jb
4 8 9 6 7 jkS
(project) 0 4 (P22) 5 (P23) 12 (P31) 9 (P32) 19 (P41) 16 (P42) 23 (P52) 25 (P53) jkf
(project) 4 9 (P22) 9 (P23) 16 (P31) 16 (P32) 23 (P41) 23 (P42) 29 (P52) 29 (P53) jS
0 4 9 16 23 jf
4 9 16 23 29Figure 5 Project schedule of this example
Under type Ⅱ MAS, this paper models a project selection problem by considering a linear value function. Furthermore, some discussions are presented as follows in order to highlight the contributions of this paper.
First, in past studies on the subject of consumer evaluation for brand image were discussions. Most studies in this issue believe that perceived quality of a consumer is the core factor to influence the consumer evaluation for brand image (Colleen and Tara, 2003; Timothy, 1997). Yet, the individual
consuming experience of a consumer and the liking of majority are usually the core factors to influence perceived quality. Accordingly, this paper assumes that the perception of a consumer for whether a new product is the liking of majority is a critical factor to influence the consumer’s brand-image. From this viewpoint, consumers may decide the brand-image score by their perception with regard to the perception of market size of one or more than one products. Despite this paper only consider two types of consumers (i.e., Group 1and Group 2), the results of the proposed model really contribute the literature in new product development.
Second, conventional studies in the project selection issues usually only consider the constraints of total budget in the duration of all projects. This study considers the amount of cost for achieving a specific quality-standard of a project is needed periodically and budget available is also limited periodically. Subject to technique complexity we only consider the schedule solution that any project starts at the latest time under the invariant schedule duration. In view of this, the schedule solution resolved by our proposed model may fail to provide any buffer time for each of projects. In view of this, the duration of all projects may be delayed whenever a project’s progress is delayed. However, the results of this study will benefit the future researches in taking into account above factors.
Third, most studies related project selection fail to concurrently consider the scheduling problem. Even though the scheduling problem has found in a conventional project selection model, it also fails to take into account the factors such as the quality-standard assigned for each project are multiple grades available and the resource-allocation to realize a specific quality-standard of a project are multiple proposals available. In view of this, traditional models related to project selection usually are the linear program ones; however, our proposed model is a nonlinearly mixed 0-1 integer program one. Of course, our proposed model is more useful than traditional ones in project selection practices; specially, in the issues of new product development.
To conclude, the proposed model is capable of finding the portfolio of quality-standards of new products and their associated optimal schedule, which maximize the expected brand-image judgment of consumers. Doing so may benefit the long-run average profitability. The presented model does not consider the case where value function is nonlinear. Therefore, further research can focus on the examination of this issue.
The model presented here does not consider the case where the amount of cost required to invest in each period for achieving a specific quality-standard of a project is also that presents multiple choices. Thus, an enhanced model recuperating this available variation should be made in the near future.
References
Asher, D. I., “A Linear Programming Model for the Allocation of R&D Efforts,” IEEE Transactions
on Engineering Management, Vol. 9, No. 4, 1962, pp. 154-157.
Brown, S. L. and Eisenhardt, K. M., “Product Development: Past Research, Present Findings, and Future Directions,” The Academy of Management Review, Vol. 20, No. 2, 1995, pp. 343-378. Baker, N. and Freeland, J., “Recent Advances in R&D Benefit Measurement and Project Selection
Methods,” Management Science, Vol. 21, No. 10, 1975, pp. 1164-1175.
Chang, C. C. and Chen, R. S., “Theory of Project Advancement and Its Applications: A Case on Multi-Air-Route Quality Budget Allocation,” Journal of the Operational Research Society, Vol. 58, No. 8, 2007, pp. 1008-1020.
Clark, K. B. and Fujimoto, T., “Product Development Performance: Strategy, Organization, and to avoid compromises that unduly sacrifice the Management in the World Auto Industry,” Harvard
integrity or quality of individual products., Boston: Business School Press, 1991.
Colleen, C. D, and Tara, L., “Store Brands and Ietail Differentiation: The Influence of Store Image and Store Brand Sttitude on store own brand perceptions,” Journal of Retailing and Consumer Services, Vol. 10, No. 6, 2003, pp. 345-352.
Cooper, R. G. and Kleinschmidt, E. J., “Resource allocation in the new product process,” Industrial
Marketing Management, Vol. 17, No. 3, 1988, pp. 249-262.
Day, G. S. and Wensley, R., “Assessing Advantage: A Framework for Diagnosing Competitive Superiority,” Journal of Marketing, Vol. 52, No. 2, 1988, pp. 1-20.
Fichter, C. and Jonas, K., “Image Effects of Newspapers How Brand Images Change Consumers' Product Ratings”, Zeitschrift fur Psychologie-Journal of Psychology, Vol. 216, No. 4, 2008, pp. 226-234.
Henriksen, A. D. and Traynor, A. J., “A practical R&D project-selection scoring tool,” IEEE
Transactions on Engineering Management, Vol. 46, No. 2, 1999, pp. 158–170.
Henriksen, A. D. and Palocsay, S. W., “An Excel-based Decision Support System for Scoring and Ranking Proposed R&D Projects,” International Journal of Information Technology & Decision
Making, Vol. 7, No. 3, 2008, pp. 529-546.
Hall, D. L. and Nauda, A., “An Interactive Approach for Selecting IR&D Projects,” IEEE
Transactions on Engineering Management, Vol. 37, No. 2, 1990, pp. 126-133.
Keown, A. J., Taylor, III B. W., and Duncan, C. P., “Allocation of Research and Development Funds: A Zero-One Goal Programming Approach,” Omega, Vol. 7, No. 4, 1979, pp. 345-351.
Kolisch, R., Meyer, K., and Mohr, R., “Maximizing R&D Portfolio Value,” Research-Technology
Kurt, H. and Christian, S., “Research and Development Project Selection and Resource Allocation: A review of Quantitative Modeling Approaches,” International Journal of Management Reviews, Vol. 1, Issue. 2, 1999, pp. 197-224.
Kwon, W. S. and Sharron, J. L., “What Induces Online Loyalty? Online versus Offline Brand Images,”
Journal of Business Research, Vol. 62, No. 5, 2009, pp. 557-564.
Lichtenstein, D. R., Ridgway, N. M., and Netemeyer, R. G., “Price perceptions and consumer shopping behavior-a field-study,” Journal of Marketing Research, Vol. 30, No. 2, 1993, pp. 234-245.
Martino, J. P., “R&D Project Selection,” New York: Wiley, 1995.
Maxwell, W., Jenni, R., and Svetlana, B., “Positive and Negative Brand Beliefs and Brand Defection/Uptake,” European Journal of Marketing, Vol. 42, No. 5/6, 2008, pp. 553-570.
Meade, L. M. and Presley, A., “R&D Project Selection Using the Analytic Network Process,” IEEE
Transactions on Engineering Management, Vol. 49, No. 1, 2002, pp. 59-66.
Nishihara, M. and Ohyama, A., “R&D Competition in Alternative Technologies: A Real Options Approach,” Journal of the Operations Research Society of Japan, Vol. 51, No. 1, 2008, pp. 55-80. Pedro, L. P. and Francisco, M. V., “R&D Activity Selection Process: Building a Strategy-Aligned
R&D Portfolio for Government and Nonprofit Organizations,” IEEE Transactions on Engineering
Management, Vol. 56, No. 1, 2009, pp. 95-105.
Robert, J. T., “New product Development”, John Wiley & Sons, Inc., 1993.
Robert, G. C., Scott, J. E., and Elko, J. K., “New Product Portfolio Management: Practices and Performance”, Journal of Product Innovation Management, Vol. 16, No. 4, 1999, pp. 333-351. Rutsch, K. H., Viljoen, P. J., and Steyn, H., “An Investigation into the Current Practice of Project
Portfolio Selection in Research and Development Division of the South African Minerals and Energy Industry,” Journal of the South African Institute of Mining and Metallurgy, Vol. 106, No. 10, 2006, pp. 665-670.
Sun, H. and Ma, T., “A Packing-multiple-boxes Model for R&D Project Selection and Scheduling,”
Technovation, Vol. 25, No. 11, 2005, pp. 1355-1361.
Timothy, R. G, “Consumption Situations and the Effects of Brand Image on Consumers' Brand Evaluation”, Psychology & Marketing, Vol. 14, No. 1, 1997, pp. 49-70.