常壓平行板型氮與氨混合氣體介電質電漿的數值模擬研究
151
0
0
全文
(2) 常壓平行板型氮與氨混合氣體介電質 電漿的數值模擬研究 Numerical Investigation of a Parallel-Plate Atmospheric-Pressure Nitrogen/Ammonia Dielectric Barrier Discharge. Student:Fu-Li Li. 研 究 生:李富利. Advisor:Dr. Jong-Shinn Wu. 指導教授:吳宗信 博士. 國立交通大學 機械工程學系 博 士 論 文 A Thesis Submitted to Department of Mechanical Engineering National Chiao Tung University in Partial Fulfillment of the Requirements for the Degree of Doctor of Philosophy in Mechanical Engineering January 2013 Hsinchu, Taiwan. 西 元 2013 年 1 月.
(3) 常壓平行板型氮與氨混合氣體介電質電漿的數值模擬研究. 學生: 李富利. 指導教授: 吳宗信 博士 國立交通大學 機械工程學系. 摘要 在本論文中,利用有限體積法解一維電漿流體模型程式,並進行模擬氮氣混 合 0-2% 氨氣以及其含微量氧氣的常壓平板型介電質電漿。模擬中使用 30 kHz 頻率的脈衝式或正弦波電源驅動常壓介電質電漿。本論文研究主要可分成四部 份,以下將依序簡介每一部份: 在第一部份,模擬常壓平板型氮與氨混合氣體介電質電漿。建構「氮/氨電 漿化學模組」包含 23 種粒子和 141 條氣相化學反應式模擬電漿。模擬的電流密 度於相位和大小與實驗量測的數據有相當的一致性。模擬的結果顯示氮氣混合 0-2%氨氣電漿均為典型的類湯森電漿(Townsend-like discharge) 。因為離子的數 量超過電子的數量太多,致使在遍及整個週期中電漿空間沒有電中性區域。我們 發現於電漿崩潰(breakdown)發生過程和之後 N2+和 N4+等離子含量最多,類似 純氮氣介電質電漿,其中 NH4+離子隨添加氨氣濃度增高而快速增加。增加氨氣 濃度至氮氣電漿中,胺基(NH2)和 H 原子隨之增加。另外,除背景氣體氮和氨 等以外,中性氣體以 N 原子濃度最高。胺基在很多需要官能基接植(functional group incorporation)應用裡扮演著相當重要的角色。 在第二部份,針對常壓平板型氮與氨混合氣體介電質電漿進行廣泛的參數研 究,包含交流正弦波電壓源不同的電壓峰值(6-10 kV) 、不同頻率(10-100 kHz) 、 不同介電質材料(石英和陶瓷)、不同介電質厚度(0.5-2 mm)以及不同電漿空. i.
(4) 間距離(0.1-1.2 mm)等。研究結果顯示電漿的電流密度和電漿密度隨下列情形 而增加:電壓增加、頻率增加、在相同介電質厚度條件下,介電質常數增加、在 相同介電質常數條件下,介電質厚度變薄以及電漿空間距離增加。在所有模擬結 果中,發現電漿均為典型的類湯森電漿。N2+、N4+以及 NH4+都是最重要的帶電 粒子,N、N2*、NH2 以及 H 都是最重要的中性粒子。 在第三部份,以數值與實驗方式對常壓氮氨介電質電漿在考慮微量氧氣雜質 進行研究它的光源產生機制:包含 NO-γ、NO-β 以及 N2-SPS(second postive system)等。建構完成的「氮/氧/氨電漿化學模組」包含 48 種粒子和 235 條氣 相 化 學 反 應 式 模 擬 電 漿 。 模 擬 結 果 趨 勢 與 使 用 放 射 光 譜 ( optical emission spectroscopy)量測電漿產生的光強度相當符合。研究結果發現 NO-γ 隨著氨氣含 量增加而滅少,主要因為 N2(A3Σu+)及 NO(A)被氨氣消耗。NO-β 隨著氨氣含量 增加而滅少,主要因為氨氣與 N 原子和 O 原子進行化學反應而耗損。N2-SPS 隨 著氨氣含量增加而滅少,主要因為氨氣具高度電子親和力以及介穩態氮氣聯合離 子化(associate ionization)效應變弱使得電子生成速率減弱。同時因為在電漿崩潰 區間內離子濃度遠超過電子濃度及電場空間分佈僅受帶電粒子存在輕微的影 響,添加 0-1%氨氣的氮氣(含微量氧氣雜質)的電漿仍視為典型的類湯森電漿。 在第四部份,發展簡化電漿化學反應機制方法,並對前述完整「氮/氧/氨電 漿化學模組」包含 48 種粒子和 235 條化學反應式進行簡化。簡化電漿化學模組 結果包含 33 種粒子和 87 條化學反應式。在氮氣含微量氧氣條件下添加氨氣濃度 從 0%至 1%,使用完整和簡化的電漿化學模擬氮/氧/氨介電電漿結果比較,結 果顯示 33 種粒子密度和電漿的電流密度均具良好一致性。使用簡化的電漿化學 模組模擬電漿的計算時間有效縮短 2.1 倍,且具有相同電性以及 33 種粒子密度 之均方根誤差都小於 1.8%。 最後,將本論文研究的主要發現做為總結,並條列出對未來研究的建議方向。. ii.
(5) 關鍵字:電漿、常壓介電質電漿、類湯森電漿、流體模型、有限體積法、氮/氧/ 氨電漿。. iii.
(6) Numerical Investigation of a Parallel-Plate Atmospheric-Pressure Nitrogen/Ammonia Dielectric Barrier Discharge. Student: Fu-Li Li. Advisor: Dr. Jong-Shinn Wu. Department of Mechanical Engineering National Chiao Tung University. Abstract In this thesis, the planar atmospheric-pressure dielectric barrier discharges (AP-DBD) of nitrogen mixed with ammonia (0-2%) considering with and without oxygen impurity were simulated using one-dimensional self-consistent fluid modeling by applying the cell-centered finite-volume method. These AP-DBDs were driven by a 30 kHz power source with distorted sinusoidal or purely sinusoidal voltages. Researches in this thesis are divided into four major parts and are described in the following in turn. In the first part, the N2/NH3 AP-DBDs were numerically investigated using a 1-D fluid modeling with 23 species and 141 reaction channels. The simulated discharge current densities are found to be in good agreement with the experimental data in both phase and magnitude. The simulated results show that the discharges of N2 mixed with NH3 (0-2%) are all typical Townsend-like discharges because the ions always outnumber the electrons greatly which leads to no quasi-neutral region in the gap throughout the cycle. N2+ and N4+ are found to be the most abundant charged species during and after the breakdown process, respectively, like a pure nitrogen DBD. NH4+ increases rapidly with increasing addition of NH3 initially and levels off. iv.
(7) with further increase of NH3. In addition, N is the most dominant neutral species, except the background species, N2 and NH3. NH2 and H are the second dominant species, which increase with the increasing addition of NH3. The existence of abundant NH2 plays an important role in those applications which require functional group incorporation. In the second part, an extensive parametric study of fluid modeling of N2/NH3 AP-DBD by varying the voltage amplitude of AC power source with sinusoidal voltages (6-10 kV), voltage frequency of AC power source with sinusoidal voltages (10-100 kHz), dielectric materials (quartz and ceramic), dielectric thickness (0.5-2 mm), and gap distance (0.1-1.2 mm), has been investigated. The results show that the discharge current density and species densities increase with 1) increasing amplitude of applied voltage, 2) increasing frequency of applied voltage, 3) increasing dielectric constant at the same thickness, 4) decreasing dielectric thickness at the same dielectric constant, and 5) increasing gap distance. For all these cases, we have found that they are typical Townsend-like discharges in an average sense in which N2+, N4+ and NH4+ are found to be the most dominant ions species, and N, N2*, NH2, and H are the most dominant neutral species. In the third part, the mechanisms of the light emissions, including NO-γ, NO-β and N2-SPS (second postive system), produced in a N2/NH3 AP-DBD considering realistic oxygen impurity was investigated numerically and experimentally. Self-consistent, one-dimensional fluid modeling was used to the numerically simulate the discharge process with 48 species and 235 reaction channels. An optical emission spectroscopy (OES) was used to measure the relative intensities of the light emission. The simulations of the light emission intensities for the above-mentioned OES lines generally reproduced the trends observed in the experiments caused by changes in the NH3 concentration. All of the predicted intensities of NO-γ, NO-β and N2-SPS v.
(8) decreased with increasing amount of NH3 caused by various reaction mechanisms. The former is due to the loss of N2(A) and NO(A) by the reaction of NH3 with N2(A) and NO(A) respectively. The decrease of NO-β is due to the depletion of N and O because of NH3, and the decrease of N2-SPS is due to electron attachment to NH3 and a weaker metastable-metastable associative ionization of N2. All of the simulated results demonstrate that the discharges are typically Townsend-like because ions outnumber electrons and the electric field across the gap is distorted only slightly by the charged particles during the breakdown. In the final part, a reduced chemical kinetics model for a planar atmospheric-pressure N2/O2/NH3 dielectric barrier discharge is proposed and validated by benchmarking against a more complete version as shown in the third part. The set of complete chemistry, including 48 species and 235 reactions, has been successfully reduced to that consisting of 33 species and 87 reactions with a very limited loss of accuracy. The results show that the computational time for 1-D fluid modeling using the reduced chemistry is 2.1 times faster with essentially the same electrical properties and produces less than 1.8% of the root mean squared errors of major species compared to using the complete chemistry, when the oxygen (impurity) is taken to be 30 ppm and the ammonia varies in the range of 0-1%. The current density produced by the reduced chemistry is also found to be in excellent agreement with the current density produced by the complete chemistry. Finally, major findings and recommendations for future study are summarized and outlined at the end of the thesis.. Keywords: plasma; atmospheric-pressure dielectric barrier discharge; Townsend-like discharge; fluid modeling; finite-volume method; nitrogen/oxygen /ammonia discharge vi.
(9) 誌謝 在就讀博士班期間來,承蒙眾人的幫忙,得以完成學業。首先誠摯感謝指導 教授吳宗信博士在研究上提供卓越見解、生活上照顧以及辛勞校訂論文,因此本 論文得以順利完成,至為感激。在待人處事上,老師不遺餘力地諄諄教導,讓學 生獲益良多。感恩您! 誠摯感謝敬愛的父親李進金與母親方塩甜,三十幾年來含辛茹苦栽培我取得 博士學位。您們無怨無悔默默的付出與支持是我完成學業最重要的關鍵。感謝弟 弟們富財和富榮在新竹照應,妹妹梅玲在家照顧父母。家人多方支持,讓我無後 顧之憂,得以全心全力致力於學業上。因此,謹以本文獻給所摯愛的家人。 感謝口試委員林昭安教授、廖國基教授、陳彥升博士、魏大欽教授以及陳慶 耀教授們在百忙之中對論文提供寶貴的建議與指正,使得本論文更臻完善。 感謝凃文福博士在交大求學期間熱心的相助、鼓勵及請客等。一起旅遊和聚 餐的時光是美好的回憶。 感謝許國賢學長教導 PIC-MCC code、林昆模提供 Fluid Modeling code 與研 究資料、古必任教導程式操作、楊宜偉量測實驗數據、洪捷粲、鄭凱文、邱沅明、 胡孟樺、周子豪、邱垂青、王聖毅、林哲緯以及劉惠云等研究室的成員協助,得 以順利完成研究。 感謝西如寺鳳師父在求學生涯裡扮演明燈與啟發,讓我有不一樣人生歷程, 最終長途的求學旅程美妙地畫下句點。 最後,將獲得博士學位的喜悅獻給關心我的人們。謝謝您們!. vii.
(10) Table of Contents 摘要........................................................................................................................i Abstract...............................................................................................................iv 誌謝.................................................................................................................... vii Table of Contents ............................................................................................ viii List of Tables.......................................................................................................xi List of Figures................................................................................................... xii Nomenclature .................................................................................................. xvi Chapter 1 Introduction.......................................................................................1 1.1 Background and Motivation .................................................................................... 1 1.2 Dielectric Barrier Discharge .................................................................................... 3 1.2.1 Homogeneous Dielectric Barrier Discharge .................................................. 3 1.2.2 Classification of Homogeneous Dielectric Barrier Discharge....................... 4 1.3 Nitrogen Atmospheric-Pressure Dielectric Barrier Discharge ............................. 4 1.4 Literature Survey...................................................................................................... 5 1.4.1 Experiments of N2/NH3 AP-DBD .................................................................... 5 1.4.2 Experiments of N2/NH3 AP-DBD Considering Oxygen Impurity ................... 6 1.4.3 Algorithms of Reduced Chemical Kinetics...................................................... 7 1.5 Specific Objectives of the Thesis.............................................................................. 8 1.6 Organization of the Thesis ....................................................................................... 9. Chapter 2 Numerical Methods ........................................................................11 2.1 Fluid Modeling Equations.......................................................................................11 2.2 Discretization, Numerical Schemes and Algorithms............................................ 14 2.3 Boundary Conditions.............................................................................................. 15 2.4 Experimental Methods ........................................................................................... 16. Chapter 3 One-Dimensional Fluid Modeling of Nitrogen/Ammonia Dielectric Barrier Discharge ............................................................................18 3.1 Plasma Chemistry ................................................................................................... 18 3.2 Simulation Conditions ............................................................................................ 19 3.3 Fitting of Applied Voltage Waveform................................................................... 19 3.4 Grid Convergence Tests ......................................................................................... 20 3.5 Validation with Experimental Results .................................................................. 21 3.6 Effects of Ammonia Addition on Nitrogen Discharge ......................................... 22 3.7 Summary.................................................................................................................. 25. viii.
(11) Chapter 4 Parametric Study of One-Dimensional Fluid Modeling of Nitrogen/Ammonia Dielectric Barrier Discharge..........................................27 4.1 Simulation conditions ............................................................................................. 27 4.2 Effect of Varying Voltage Amplitudes of Power Source ..................................... 27 4.3 Effect of Varying Driving Frequencies of Power Source .................................... 29 4.4 Effect of Varying Dielectric Materials .................................................................. 30 4.5 Effect of Varying Dielectric Thickness ................................................................. 31 4.6 Effect of Varying Gap Distances ........................................................................... 32 4.7 Summary.................................................................................................................. 32. Chapter 5 One-Dimensional Fluid Modeling of Nitrogen/Ammonia Dielectric Barrier Discharge Considering Oxygen Impurity .......................34 5.1 Plasma Chemistry ................................................................................................... 34 5.2 Simulation Conditions ............................................................................................ 35 5.3 Optical Emission Spectra Measurements ............................................................. 35 5.4 Validation with the Experimental Results............................................................ 36 5.5 Distributions of Number Densities of Discharged Properties ............................. 37 5.6 Discharge Structure in the N2/O2 and N2/O2/NH3 Discharges ............................ 41 5.7 Power Absorption in the N2/O2 and N2/O2/NH3 Discharges................................ 42 5.8 Summary.................................................................................................................. 43. Chapter 6 A Reduced Chemical Kinetics for Atmospheric-Pressure Nitrogen/Oxygen/Ammonia Dielectric Barrier Discharge............................45 6.1 Plasma chemistry .................................................................................................... 45 6.2 Simulation Conditions ............................................................................................ 45 6.3 Algorithm of Reducing Chemical Kinetics ........................................................... 45 6.4 Proposed Reduced Chemical Kinetics of the N2/O2/NH3 Discharges................. 47 6.5 Summary.................................................................................................................. 49. Chapter 7 Conclusion and Recommendations for Future Work .................50 7.1 Summaries of the Thesis......................................................................................... 50 7.1.1 One-Dimensional Fluid Modeling of Nitrogen/Ammonia Dielectric Barrier Discharge ........................................................................................ 50 7.1.2 Parametric Study of One-Dimensional Fluid Modeling of Nitrogen/Ammonia Dielectric Barrier Discharge........................................ 51 7.1.3 One-Dimensional Fluid Modeling of Nitrogen/Ammonia Dielectric Barrier Discharge Considering Oxygen Impurity ....................................... 52 7.1.4 A Reduced Chemical Kinetics for Atmospheric-Pressure Nitrogen/Oxygen/Ammonia Dielectric Barrier Discharge .......................... 54 7.2 Recommendations for Future Work ..................................................................... 54 ix.
(12) References ..........................................................................................................56 Tables..................................................................................................................62 Figures................................................................................................................87 List of Publications .........................................................................................132. x.
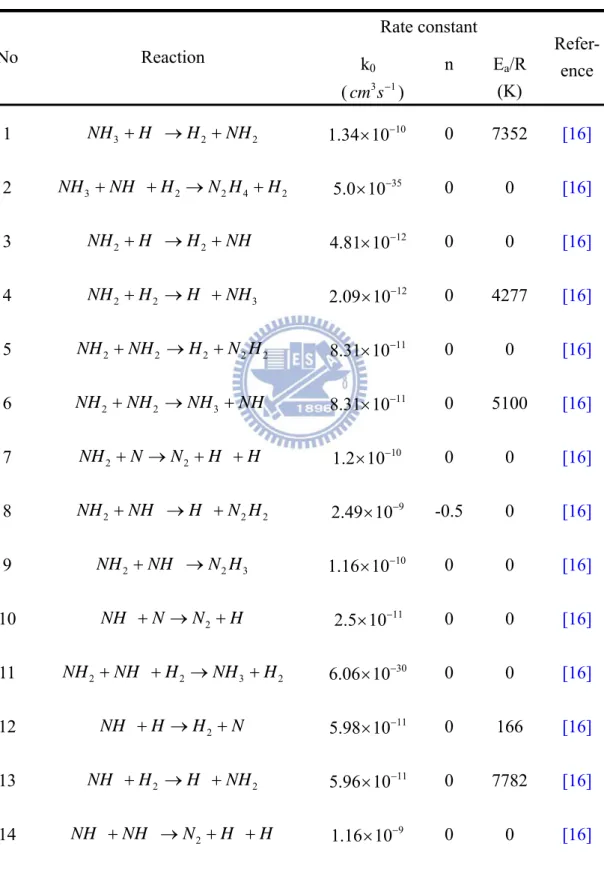
(13) List of Tables Table 1. Order of magnitude of the different species in the two well characterized homogeneous DBD regimes [29]...............................................................62 Table 2. Electron-Impact Collisions include N2/NH3 plasma chemistry. All rate constants are adopted from [49][65]. .........................................................63 Table 3. Ion-Molecular Collisions include N2/NH3 plasma chemistry. Te is the electron temperature, and Tg is the background gas temperature. Both are in Kevin. ....................................................................................................................67 Table 4. Neutral-Neutral Collisions include N2/NH3 plasma chemistry. The rate constants are calculated by k k0 (Tg / 298) n exp( Ea / R Tg ) where Tg is the background gas temperature (K). .....................................................70 Table 5. The test grid convergence for N2/0.01%NH3 AP-DBD as the applied voltage of 8 kV and the frequency of 30 kHz. ............................................................73 Table 6. Test conditions used for parametric study. .....................................................74 Table 7. Summary of N2/O2/NH3 plasma chemistry. ...................................................75 Table 8. The summary of species with various reduced chemical kinetics. ................83 Table 9. Accuracy and computational time with various chemical kinetics. ...............84 Table 10. The reaction paths for generating the dominant species in N2/NH3 discharge. ....................................................................................................................85 Table 11. The reaction paths for generating the dominant species in N2/O2/NH3 discharge. ...................................................................................................86. xi.
(14) List of Figures Figure 1. Common planar and cylindrical dielectric barrier discharge configurations [28].............................................................................................................87 Figure 2. Measured light distribution and calculated space distribution from anode to cathode in (a) a He APGD and (b) a N2 APTD when the discharge current intensity is maximum [38]. ........................................................................88 Figure 3. The schematic framework of the thesis. .......................................................89 Figure 4. The flowchart of fluid modeling simulation.................................................90 Figure 5. Sketch of a planar N2/NH3 atmospheric pressure dielectric barrier discharge system. .......................................................................................................91 Figure 6. The schematic diagram of one-dimensional atmospheric pressure dielectric barrier discharge simulated in the study.....................................................92 Figure 7. The test grid convergence for N2/0.01% NH3 AP-DBD as the applied voltage of 8 kV and the frequency of 30 kHz.........................................................93 Figure 8. Comparison between the simulated and measured current density in pure nitrogen AP-DBD.......................................................................................94 Figure 9. Spatiotemporal averaged number densities of charge species with concentration ratio of ammonia in AP-DBD. ............................................95 Figure 10. Temporal profiles of the space-averaged number densities of charge species for N2/0.1%NH3 AP-DBD. ........................................................................96 Figure 11. Temporal profiles of the space-averaged number densities of neutral species for N2/0.1%NH3 AP-DBD. ........................................................................97 Figure 12. Distributions of charge species densities across the electrode gap for N2/0.1%NH3 AP-DBD at the peak of discharge current density................98 Figure 13. Distributions of charge species densities across the electrode gap for N2/0.1%NH3 AP-DBD in the post-breakdown period. ..............................99 Figure 14. Spatiotemporal distribution of electron number density. .........................100. xii.
(15) Figure 15. Spatiotemporal distribution of N2+ number density..................................101 Figure 16. Spatiotemporal averaged number densities of neutral species with concentration ratio of ammonia in AP-DBD. ..........................................102 Figure 17. Temporal variation of discharge properties: (a) discharge current density, (b) gap voltage, and (c) electron number density with various amplitude of voltage......................................................................................................104 Figure 18. Spatiotemporal averaged number densities of (a) charged species and (b) neutrals with various amplitude of voltage..............................................105 Figure 19. Temporal variation of discharge properties: (a) discharge current density, (b) gap voltage, (c) electron number density, and (d) power absorbed by electrons with various frequencies of applied voltage.............................107 Figure 20. Temporal variation of accumulated charge on powered dielectric (Qa) at 100 kHz of frequency of applied voltage........................................................108 Figure 21. Spatiotemporal averaged number densities of (a) charged species and (b) neutrals with various frequencies.............................................................109 Figure 22. Temporal variation of (a) discharge current density and (b) gap voltage with various dielectric materials. ..................................................................... 110 Figure 23. Spatiotemporal averaged number densities of (a) charged species and (b) neutrals with various dielectric materials. ............................................... 111 Figure 24. Temporal variation of discharge current density for various dielectric thicknesses. .............................................................................................. 112 Figure 25. Spatiotemporal averaged number densities of (a) charged species and (b) neutrals for various dielectric thicknesses. .............................................. 113 Figure 26. Temporal variation of (a) current density and (b) displacement (JD) and conduction current density (JC) at various gap distances......................... 114 Figure 27. Spatiotemporal averaged number densities of (a) charged species and (b) neutrals for various gap distances. ........................................................... 115 Figure 28. Optical emission spectra of N2/(0-1%)NH3 AP-DBD from 180 to 900 nm under experimental conditions (30 kHz, 8 kV, 50 SLM, 400W). ............ 116. xiii.
(16) Figure 29. Spatiotemporal distributions of (a) N2(C) and (b) N2(A) under same conditions as Brandenburg’s experimental conditions [34]..................... 117 Figure 30. Spatiotemporal intensity distributions of (a) N2-SPS and NO-γ were measured in the gas mixture of 300ppm O2 in N2 by Brandenberg et al. [34]. .................................................................................................................. 118 Figure 31. Optical emission spectra comparison of simulations and measurements. (Note that 0.001% NH3 really represents 0% NH3 on the x-axis.) .......... 119 Figure 32. Spatiotemporal averaged number density of (a) charged, (b) excited and (c) neutral species as function of concentration of ammonia from 0 to 1%..121 Figure 33. Snapshots of distribution of plasma properties of charged species in (a) N2/30ppm-O2 and (b) N2/30ppm-O2/1% NH3 discharges at maximum current density. .........................................................................................122 Figure 34. Temporal profiles of space-averaged number densities of charged species in (a) N2/30ppm-O2 and (b) N2/30ppm-O2/1% NH3 discharges in a cycle. .123 Figure 35. Spatiotemporal distribution of light emission intensity of N2-SPS in (a) N2/30ppm-O2 and (b) N2/30ppm-O2/1% NH3 discharges in a cycle. ......124 Figure 36. Temporal power absorption in (a) N2/30ppm-O2 and (b) N2/30ppm-O2/1% NH3 discharges.........................................................................................125 Figure 37. Spatiotemporal distribution of electron power absorption in (a) N2/30ppm-O2 and (b) N2/30ppm-O2/1% NH3 discharges in a cycle. ......126 Figure 38. The flowchart of reduced chemistry algorithm. .......................................127 Figure 39. Comparison of rate of production of atomic oxygen among various ammonia concentrations in N2/O2 discharges..........................................................128 Figure 40. Comparison of discharge current density among various chemical kinetics in N2/30ppm-O2/0.1% NH3 discharge..........................................................129 Figure 41. Spatiotemporal averaged number density of charged species comparison of complete chemistry and Simplified Chemistry 2 at various concentrations of ammonia...................................................................................................130 Figure 42. Spatiotemporal averaged number density of excited species comparison of complete chemistry and Simplified Chemistry 2 at various concentrations of xiv.
(17) ammonia...................................................................................................131. xv.
(18) Nomenclature D E k kB m n q S Te Tg. . th 0 i m. diffusivity electric field rate constant Boltzmann constant mass number density charge source/sink of continuity equation electron temperature Background gas temperature particle flux thermal velocity permittivity vacuum permittivity threshold energy for the ith inelastic electron collision potential mobility momentum exchange collision frequency between electron and background neutral particles. xvi.
(19) Chapter 1 Introduction 1.1 Background and Motivation Atmospheric-pressure plasmas (APP) have attracted much attention recently mainly because: 1) they do not require the use of expensive vacuum equipment, and 2) they have found increasingly numerous applications in modern science and technology. The former drives the cost down dramatically as compared to low-pressure plasmas and also offers the possibility of in-line processing for mass production in industry. The above have led to development of different kinds of AP plasma sources. The AP plasma sources are generally classified based on the types of power sources, which may include alternating current (AC) dielectric barrier discharge (DBD) (10-100 kHz), radio frequency (RF) capacitively coupled discharge (1-100 MHz) and microwave discharge (300 MHz - 10 GHz). Among these, DBD may represent one of the most popular discharges because of its easier implementation and simple scalability from small laboratory reactors to large industrial installations. Among these APPs, dielectric barrier discharges using ammonia have been well studied experimentally because it can produce abundant atomic nitrogen and hydrogen which have been used in various applications such as surface treatment to improve wettability [1], biocompatibility of polymer surfaces [2], surface nitridation for semiconductor applications [3][4], and modifying surfaces for increased adhesion between polymer layers in composite materials [5], among others. There exist several studies of atmospheric-pressure dielectric barrier discharge (AP-DBD) with simulations [nitrogen: [6][7][8]; helium: [9][10][11][12] and experiments [nitrogen: [13][14][15]; helium: [14]]. However, nearly no related simulation study in ammonia DBD has been found, except very few in low-pressure environments for DBD [4] and. 1.
(20) ICP [16]. Recently, N2/NH3 discharges have also been studied experimentally in low-pressure environment because of its potential applications, such as surface nitridation for semiconductor applications [3][17], etching [18][19][20], reduction of nitrogen oxide [21], modification of surface wetting properties [22] and laser [23]. There have been very few experimental studies of AP-DBD for N2/NH3 mixture [24][25][26]. However, no detailed physical and chemical mechanisms of N2/NH3 discharges were provided. Thus, better understanding of N2/NH3 AP-DBD is strongly desired. It is well known that detailed experimental measurement of the discharge is not an easy task. Plasma fluid modeling may represent one of the most efficient and cost effective tools in unveiling the insight of complex physics and chemistry in N2/NH3 AP-DBD with and without the oxygen impurity level. Hopefully, much deeper understanding of the plasma mechanism can provide more constructive input to the design of plasma source. Unfortunately, there has been no related simulation study on N2/NH3 AP-DBD with and without considering the oxygen impurity level to the best knowledge of the authors. In this thesis, we intend to develop sets of complex plasma chemistry for N2/NH3 and N2/O2/NH3 discharges, respectively, to describe the behaviors of the gas discharges. The fluid modeling code with the plasma chemistry of N2/NH3 and N2/O2/NH3 is first validated by good agreement of discharge current densities and discharge light intensities between simulations and experiments. Then, effect of ammonia addition into nitrogen and N2/O2 on the structure of gas discharge is presented and discussed in detail.. 2.
(21) 1.2 Dielectric Barrier Discharge The dielectric barrier discharges are very attractive for industrical applications because they can provide non-equilibrium plasma which has the temperature of electron much higher than the heavy particles (i.e. ions and neutrals) at atmospheric pressure. The temperatures of the heavy particles usually are close to the room temperature and that of electron is as high as 10,000~50,000K. Therefore, the DBD offers high selectivity and energy efficiency and is able to operate efficiently at low temperature without any special quenching [27]. Figure 1 shows the classical DBD configurations utilize planar and cylindrical arrangements with at least one dielectric layer placed between the electrodes [28]. The typical discharge gas distances are range from 0.1mm to several cm. Dielectric barrier discharges are originally driven by an alternating voltage (10-100 kHz), usually a sine wave. Typical dielectric materials used are quartz, ceramics, glass, or polymers in some applications with additional protective or functional coatings. A primary feature of the DBD is that the dielectric barrier suppresses the occurrence of arc discharges and prevents the metallic electrodes from erosion caused by the arc.. 1.2.1 Homogeneous Dielectric Barrier Discharge Homogeneous discharge has been used in numerous new applications including thin film deposition, bio-decontamination, and aerodynamic flow control [29]. The feature of the homogeneous discharge allows one to treat surfaces more uniformly. Homogeneous DBD at atmospheric pressure could only be obtained under specific conditions, first described by Kanazawa et al. [30]. A precise control of the electric circuit (voltages, frequency), working gas composition, dielectric (materials, thickness), discharge gas spacings, and working pressures are needed to obtain such. 3.
(22) discharge [28][29][30][31][32].. 1.2.2 Classification of Homogeneous Dielectric Barrier Discharge The homogeneous discharges were classified by Massines et al. [29] as atmospheric-pressure glow discharge (APGD or GDBD) and atmospheric-pressure Townsend discharge (APTD or TDBD). The differences between APGD and APTD are summerized in Table 1. Figure 2a shows the major features of APGD in Helium. The glow discharge at atmospheric pressure are typically featured by the high current density ranging from 10-100 mA/cm2, a quasi-neutral region (positive column), a high electric field region at the cathode (cathode fall), and maximal light emission near the cathode. Figure 2b shows the major features of APTD in nitrogen. The typical features of Townsend discharge at atmospheric pressure include ions outnumber electron, the low current density ranges from 0.1-10 mA/cm2, a quasi-neutral region is absent, the electric field is nearly constant in the discharge gap, and maximal light emission from the excited species appears near the anode.. 1.3 Nitrogen Atmospheric-Pressure Dielectric Barrier Discharge It is relatively easy to obtain the homogeneous barrier discharges in helium [31], nitrogen [31], nitrogen with oxygen impurity [33], nitrogen with the trace amount of oxygen (which less than 400 ppm) [34][35][36][37], and neon [31], among others. Among these gases, nitrogen is often used as the working gas, because its low cost and the homogeneous barrier discharge in nitrogen almost shows a Townsend discharge at atmospheric pressure. Nitrogen AP-DBD has been studied by simulations and experiments for a long time. Nitrogen AP-DBD has been investigated frequently by one-dimensional fluid 4.
(23) modeling [6][7][8][38]. The results showed that the discharge structure is strongly influenced by different driving frequencies, voltage amplitudes and the dielectric materials. Moreover, nitrogen discharges with addition of other gases for special objectives are not unusual for practical applications. For instance, ammonia is widely added in nitrogen discharges to generate high amount of NH2 which are believed to be important for the incorporation of amine functional group into materials. In addition, the nitrogen AP-DBD with small admixtures of oxygen has been investigated by plasma diagnostics (optical emission spectroscopy, OES) and numerical modeling [34][35][36][37]. Brandenburg et al. [34] presented that the spatial distribution of the optical emission intensities of discharge with addition of a small amount of oxygen (300 ppm) in nitrogen were measured by spatially resolved cross-correlation spectroscopy (CCS). The spatial distributions of the measured optical emission intensities of N2-SPS and NO-γ are used to compare with the current simulated results that will be presented later (Chapter 5).. 1.4 Literature Survey 1.4.1 Experiments of N2/NH3 AP-DBD Yang et al. [25][26] have developed a two-step AP plasma treatment for increasing the bio-compatibility of polylactide (PLA): first by N2/O2 DBD and followed by N2/NH3 DBD. Results had shown that appreciable amount of N1s and NH2 bond were incorporated into PLA surface after the two-step plasma treatment process. However, no detailed physical and chemical mechanisms of N2/O2 and N2/NH3 discharges were provided, particularly the latter. Thus, better understanding of N2/NH3 AP-DBD is strongly desired. In additon, no detailed parametric study has been performed. Therefore, a systematic parametric study is required to further 5.
(24) understand the underlying plasma physics and chemistry. In this thesis, an extensive parametric study of the discharge characteristics is presented by varying several important operation conditions, including the voltage amplitude of AC power source, the frequency of AC power source, dielectric constant of dielectric material, dielectric thickness, and gap distance between dielectric materials.. 1.4.2 Experiments of N2/NH3 AP-DBD Considering Oxygen Impurity As mentioned in the above, N2/NH3 AP-DBD has been studied experimentally by Yang et al. [25][26], in which the emission spectra (NO-γ, NO-β and N2-SPS) were clearly detected. These optical intensities that were measured by optical emission spectroscopy supported the presence of oxygen impurities in the working gas. In addition, these emission spectra were also detected in a nitrogen-based discharge. In a commercial nitrogen bottle (99.99%), we found that the oxygen impurity level could reach ~30 ppm, based on the measurements using a gas chromatographer (YL 6100GC, Young Lin Instrument Co., Ltd.). However, in these studies, the mechanisms of optical emissions and effects of oxygen impurity were not explored, which are important in further understanding the complex plasma chemistry. Therefore, for realistic modeling of N2/NH3 AP-DBD, the trace oxygen impurity level must be included to reproduce these light emissions. In this thesis, a set of complex reaction pathways for the plasma chemistry of N2/O2/NH3 AP-DBD was developed to describe the mechanism of light emission by gas discharge. The effect of ammonia addition into N2/O2 discharge on the light intensities of the various emissions will be presented and discussed in detail later (Chapter 5).. 6.
(25) 1.4.3 Algorithms of Reduced Chemical Kinetics By reducing the number of reactions and reacting species properly, one can reduce the computational cost of fluid modeling without sacrificing the accuracy of the results. Therefore, the final aim of this study is to develop a general method for deducing a reduced chemical kinetics from the complex plasma chemistry. In general, there are three reduction methods in the study of classical chemical kinetics [42]: a reduction of the number of reacting species and reactions; a reduced mechanism using quasi-steady-state and partial equilibrium assumptions; and a mathematical representation based on the time-scale separation. However, there have been very few studied particularly in reducing plamas chemistry [43][44][45]. For example, Liu et al. [43] presented that a set of plasma chemistry with 46 species and 577 reactions in He/H2O plasma simulated by global model at atmospheric pressure. The reduction of the number of reacting species and reactions has been used to simplify the plasma chemistry. Then, they briefly described reduction methods used by special conditions include the densities of selected species are more than 0.5% of electron density and the reactions contribute more than 2% to the generation/loss of the remaining species. With this simplification, a set of plasma chemistry consisting of 34 species and 90 reactions was found to capture the main reaction behavior of the discharge at low-water vapour concentration (1-30 ppm), while another set consisting of 40 species and 129 reactions was needed when the water vapour concentration was high (30-3000 ppm). In general, Chemkin [46] has been used to reduce the number of reactions and species in a classical chemical mechanism without involving gas discharges. However, the simulated results using the Plasma PSR module of Chemkin (global modeling) are not compatible with the simulated results using fluid modeling (e.g., 1-D), even with. 7.
(26) the same plasma chemistry, because the applied voltage, the driving frequency, the density of species and the electron temperature as a function of time and space are not considered in the 0-D Chemkin code. Therefore, a combination of these two tools is required. In this study, we propose a general reduction method that can reduce the number of species and reaction by combining Chemkin with 1-D fluid modeling with a minimal loss of accuracy.. 1.5 Specific Objectives of the Thesis To understand the insight of the discharges, simulation has become an important method since the direct measurements are either very difficult or very costly to be conducted in such a small gap. The numerical simulation can be used as the supplementary tool of experiments for better understanding of discharge behaviors. An efficient and accurate modeling, which provides detailed plasma physics and chemistry within complex gas discharges, may be also used as an optimization tool for designing a new plasma source. Therefore, in this thesis numerical simulation is used to study N2/NH3 AP-DBD with and without the oxygen impurity level in this thesis. The specific objectives of the thesis are summarized as follows: 1.. To develop a set of the complex plasma chemistry of N2/NH3 that can describe the discharge properly. To validate the one-dimensional fluid modeling code with the plasma chemistry for a N2/NH3 AP-DBD, to compare the simulated result with the experimental data, and to study the effects of ammonia in nitrogen AP-DBD and its physics and chemistry.. 2.. To understand fundamental characteristics of plasma physics and chemistry in a N2/NH3 AP-DBD under varing test conditions including voltage amplitudes of power source, driving frequencies of power source, dielectric materials, 8.
(27) dielectric thickness, and discharge gap distances between dielectric materials. 3.. To develop a set of the complex plasma chemistry of N2/O2/NH3 that can reproduce the available meaurements. To validate one-dimensional fluid modeling code with the plasma chemistry for a N2/NH3 AP-DBD with the oxygen impurity, to compare the relative light intensities with the experimental data, and to study the effects of ammonia in N2/O2 AP-DBD and its related physics and chemistry.. 4.. To develop a general method in deducing a reduced chemical kinetics and to apply it for the N2/O2/NH3 AP-DBD.. 1.6 Organization of the Thesis Figure 3 illustrates the schematic framework of the thesis. The organization of the thesis is summarized as follows: Chapter 2 introduces the research methods consisting of numerical methods and experimental methods. Chapter 3 presents and discusses the effect of ammonia addition in a nitrogen AP-DBD driven by a realistic sinusoidal volage power source by comparing simulations with experimental results. Chapter 4 presents and discusses the parametric study of simulated N2/NH3 AP-DBD drived by sinusoidal voltage power source. Chapter 5 presents and discusses the effects of ammonia addition in a nitrogen AP-DBD considering oxygen impurity that is driven by a realistic distorted sinusoidal voltage power source. Chapter 6 presents and discusses the general method in deducing a reduced chemical kinetics from a set of complex chemistry combining Chemkin and 1-D luid 9.
(28) model. The N2/O2/NH3 AP-DBD is then used as an example showing the capability of this method. Chapter 7 summarizes the important findings of the thesis and the recommendations of future research.. 10.
(29) Chapter 2 Numerical Methods To simulate such complicated AP discharge physics and chemistry, a 1-D fluid modeling is employed. We solve a set of model equations self-consistently, including the continuity equations for charged species with drift-diffusion approximation for the momentum equations, the neutral species continuity equations, the electron energy density equations, and Poisson’s equations. The collocated cell-centered finite-volume method is used to discretize these equations. The discretized equations are solved using the semi-implicit method to enlarge the simulation time step. The corresponding numerical schemes and algorithms are described in a previous study [39] in detail.. 2.1 Fluid Modeling Equations The governing equations for the fluid modeling of plasma are the same as the previous work [47], which was based on LMEA (local mean energy approximation) approach [48], and are briefly described below for completeness. The general continuity equation for ion species can be written as n p t. rp p S pi. p=1,…,K. (1). i 1. where n p is the number density of ion species p, K is the number of ion species, rp is the number of reaction channels that involve the creation and destruction of ion species p and p is the particle flux that is expressed, based on the drift-diffusion. approximation, as p sign(q p ) p n p E Dp n p. (2). E . (3). 11.
(30) where q p , E , f , p , and D p are the ion charge, the electric field, the electric potential, the ion mobility, and the ion diffusivity respectively. Note that the form of the source term S pi can be modified according to the modeled reactions describing how the ion species p is generated or destroyed in reaction channel i. The continuity equation for electron species can be written as re ne e Sei t i 1. (4). where ne is the number density of electrons, re is the number of reaction channels. that involve the creation and destruction of electrons and e is the corresponding particle flux that is expressed, based on drift-diffusion approximation, as e e ne E Dene. (5). where e and De are the electron mobility and electron diffusivity, respectively. These two transport coefficients can be readily obtained as a function of the electron temperature from the solution of a publicly available computer code for the Boltzmann equation, named BOLSIG+ [49]. Similar to S Pi , the form of Sei can also be modified according to the modeled reactions that generate or destroy the electron in reaction channel i. The continuity equation for neutral species can be written as ruc nuc uc Suci uc=1,…,L t i 1. (6). where nuc is the number density of uncharged neutral species uc, L is the number of neutral species, ruc is the number of reaction channels that involve the generation. and destruction of uncharged species uc and uc is the corresponding particle flux, neglecting convection effects, which can be expressed as uc Duc nuc 12. (7).
(31) where Duc is the diffusivity of neutral species. Similarly, the form of Suci can also be modified according to the modeled reactions that generate or destroy the neutral species in reaction channel i. The electron energy density equation can be expressed as sc n m n e e E i ki ne ni 3 e ne k B vm Te Tg t M i 1. 3 where n ne k BTe 2 . is the electron energy density, Te. (8). is the electron. temperature, e is the charge of electron, i and ki are the threshold energy and rate constant for the ith inelastic electron collision respectively, Sc is the number of reaction channels of inelastic electron collision, k B is the Boltzmann constant, m is the momentum exchange collision frequency between the electron (mass me ) and the background gas (mass M), Tg is the background gas temperature and is assumed to be 400 K. n is the corresponding electron energy density flux and can be. expressed as. 5 5 n k BTe e De ne k BTe 2 2. (9). The second term on the right-hand side of Eq. (8) represents the sum of the energy losses of the electrons due to inelastic collision with other species. The last term on the right-hand side of Eq. (8) represents the energy losses of the electrons due to elastic collision with the background gas, which can be ignored for low-pressure gas discharges, while it is important for medium-to-atmospheric pressure discharges. The Poisson equation for electrostatic potential can be expressed as K ( ) qn i. (10). i 1. where is the potential and is a function of position, whose value is either the vacuum or dielectric permittivity.. 13.
(32) 2.2 Discretization, Numerical Schemes and Algorithms In the current study, the above equations are discretized using the collocated cell-centered finite-volume method [50]. The discretized equations are solved using the semi-implicit method to enlarge the simulation time step. The fluxes in the continuity equations and the electron energy density equation are calculated with the Scharfetter–Gummel scheme [51]. The backward Euler method is employed as a time-integrator. Details are presented elsewhere [39] and only several key features are described here for brevity. Figure 4 shows the flowchart of fluid modeling simulation. The program starts from the evaluation of transport properties and rate constants of reaction channels. At each time step, the resulting algebraic linear systems are solved equation by equation using parallel preconditioned Krylov subspace method provided by PETSc library [52] through domain decomposition technique on top of the MPI protocol. We have employed the additive Schwarz method, with LU or incomplete LU as a sub-domain solver, for preconditioning the coefficient matrix and then the Generalized Minimal Residual Method [53] for solving the linear matrix equation. For 1-D fluid modeling, the linear matrix equation is solved using the direct LU method since the matrix size is relatively small compared to that in 2-D fluid modeling. The continuity equation of charged species consists of the mobility, the diffusivity, and the local distribution of electric field, which are varied both temporally and spatially. Therefore, the coefficients of the matrices for these continuity equations need to be updated at each time step. Moveover, The electron energy density equation is used to obtain the electron temperature, which is used to update the temporally and spatially varing transport properties and rate constants for the reaction channels.. 14.
(33) 2.3 Boundary Conditions The flux-type boundary conditions of ions, electrons, and neutral species are employed on the solid surfaces (dielectric or electrode) as p a sign(q p ) p n p E D p n p 1 e a e ne E Dene ne vth 4 uc Duc nuc. (11) (12) (13). where a 1 if drift velocity ( sign(q p ) p E ) points toward the dielectric surface, and a 0 otherwise. Note that the calculations of transport coefficients such as moilities. and diffusivities of electron, ions and neutrals will be decribed wherever they are appropriate in later chapters. The ions and electrons are assumed to be accumulated at the dielectric surface at the boundary, while the neutral species are assumed to be quenched at the dielectric surface in the present study. The thermal velocity of electron is vth . 8k BTe me. (14). where me is the electron mass. For all species, the fluxes at the boundaries of computational domain (except the dielectric surfaces) are assumed to be zero. The boundary conditions of electron energy density flux at the dielectric surfaces are n 2k BTe e. (15). For the Poisson equation, the potentials of powered and grounded electrode are assigned with applied voltage and zero potential respectively. The effect of charge accumulation on the dielectric surface is considered and can be expressed as. 15.
(34) dielectric Edielectric disch arg e Edisch arg e surf. (16). where surf is the surface charge density on the dielectric, calculated by integrating fluxes of charged species directed to the dielectric surface as surf t. e i e . (17). It is assumed that charges remain on the dielectric surface until recombining with opposite charges.. 2.4 Experimental Methods To directly validate the fluid modeling presented in the current study, we performed several corresponding experiments of N2/NH3 AP-DBD in our laboratory, which are described in detail in the following. Figure 5 shows the schematic diagram of a planar atmospheric-pressure N2/NH3 dielectric barrier discharge along with a gas supply system and the instrumentation for voltage and current measurements. This DBD consists of two parallel copper electrodes (50×50×8 mm each) with embedded cooling water. Each of the electrodes was covered with a 70×70×1 mm quartz plate with measured relative permittivity of 4.76. The distance between the two dielectric plates is kept at 1 mm throughout the study except Chapter 4. The DBD assembly is driven by a 30 kHz power supply (Model Genius-2, EN technologies Inc.) with distorted sinusoidal voltage. The input voltage and output current waveforms across the electrodes of the parallel-plate discharge are measured by a current probe (Tektronix TCP312) and a high-voltage probe (Tektronix P6015A) through a digital oscilloscope (Tektronix TDS1012B). Nitrogen gas (99.99% purity) is used as the discharge gas that flows through the parallel plate. Nitrogen flow rate (50 SLM) is controlled by manually adjustable flowmeters. 16.
(35) The working gas was introduced through two holes at the top of the parallel plate assembly and then passes through a sieved aluminum plate containing 480 holes (0.5 mm in diameter each) for flow velocity redistribution. Afterwards, it flows through a convergent section with length of 10 mm to coincide with the channel gap size (1 mm) at the end of the section. The flow rates were controlled by manually adjustable flowmeters and digital mass flow controllers (BROOKS 5850E series). Furthermore, various working gases flow through the gap between two dielectrics. To note that an inevitable existence of impurities in purchased gas cylinder such as O2 has been carefully verified through gas chromatography in our lab. The optical emission intensities of the AP-DBD were measured using a monochromator (PI Acton SP 2500) with a Photomultiplier tube (Hamamatsu R928), which was mounted on a mobile 3-D table. The measured location of optical emission spectra was in the discharge region. The spectra were measured from 180 to 900 nm with 1200-g/mm grating (Holographic, 300-nm Blaze and 500-nm Blaze). To note that the linear dispersion is 1.489 nm/mm while the center wavelength of emission line is 400 nm. Both sides of the fiber (Ocean Optic. BTW-FPC-600-0.22-1.5-UV, 600µm) were connected to the SMA adapter of the monochromator and the collimating lenses (Ocean Optics 74-UV), respectively.. 17.
(36) Chapter 3 One-Dimensional Fluid Modeling of Nitrogen/Ammonia Dielectric Barrier Discharge 3.1 Plasma Chemistry In the plasma chemistry, we consider 23 species (e-, NH+, NH2+, NH3+, NH4+, N+, N2+, N4+, H+, H2+, N*, N2*, NH, NH2, N2H, N2H3, N, H, N2H2, N2H4, H2, N2, and NH3) and 141 reaction channels as summarized in Table 2 to Table 4, which include 56 electron-impact reactions, 34 ion-molecular reactions and 51 neutral-neutral reactions respectively. Reaction channels 1 to 22 consider chemistry for the pure ammonia discharge, reaction channels 23 to 43 consider chemistry for the pure nitrogen discharge, reaction channels 44 to 56 consider chemistry for the pure hydrogen discharge, while the rest consider chemistry among the species. This set of N2/NH3 plasma chemistry includes momentum transfer collision, electron-impact vibrational excitation, electron-impact rotational excitation, electron-impact electronic excitation, electron-impact ionization, electron-impact dissociation, electron-impact dissociative. ionization,. electron-ion. recombination,. electron-ion. dissociative. recombination, ion-molecular charge exchange, ion-molecular metastable into ground state, metastable-metastable associative ionization. The transport coefficients and the rate constants related to the electrons are calculated by solving the Boltzmann equation using BOLSIG+ [49]. Note that these coefficients were predicted and stored in a lookup table as function of the electron temperature in N2/NH3 background gas at temperature of 400 K. The mobilities of the ions are taken from the literature [54][55], and the corresponding diffusivities are calculated using the Einstein relation. The diffusivities of the neutral species are calculated from the Chapman-Enskog equation for binary diffusion [56]. The diffusivities of excited neutral species are assumed to be 18.
(37) equal to those of the corresponding ground-state neutral species.. 3.2 Simulation Conditions Figure 6 illustrates the schematic diagram of the one-dimensional atmospheric-pressure dielectric barrier discharge. The discharge is sustained in the 1-mm gap between two electrodes (50 x 50 mm each) with each covered by a 1-mm thick quartz plate having measured relative permittivity of 4.76. The powered electrode (left) is driven by a 30 kHz power source with distorted sinusoidal voltages of 8 kV in amplitude, and the right electrode is grounded throughout the cycle. This configuration is kept the same through the study. Effect of ammonia addition in the range of 0-2% is considered in the simulations. 130 cells with non-uniform spacing were found to be accurate enough after detailed grid convergence study and were used throughout the study. Time step is set as 10-10 ~ 10-11 seconds, unless otherwise specified. The electrical properties of the discharges remain essentially the same after 3-5 cycles of simulation, although the neutral species are still evolving slightly. Thus, we have used the results obtained at 5th cycle throughout Chapter 3.. 3.3 Fitting of Applied Voltage Waveform The AP-DBD problem investigated here is driven by quasi-pulse power source with a frequency of 30 kHz. Input temporal voltages waveform for simulations are fitted by a Fourier series expansion of the measured voltage waveform across electrodes using 30 terms of sine and cosine function with 30 kHz as fundamental frequency. In general, this fitting method can be applied to any arbitrary realistic voltage waveform, which is described in detail in the following.. 19.
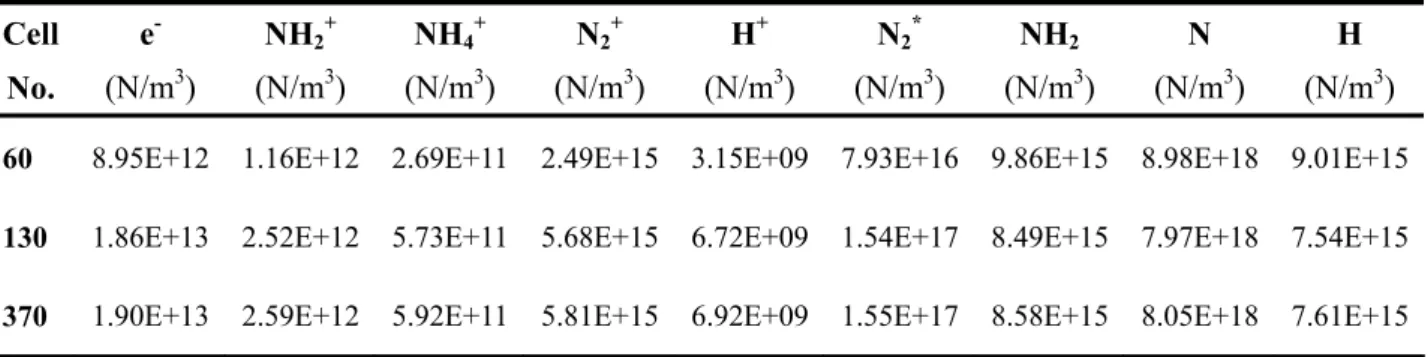
(38) Since the experimental voltage waveform is not an ideal sinusoidal one, we need to fit the voltage properly for an efficient numerical study. The experimental voltages are fitted using a Fourier series as shown in Eq. (18). n nx nx f ( x) c a n cos bn sin T T n 0 . (18). Theoretically, Fourier series is capable of fitting arbitrary voltage waveform. At each time step, the voltage of powered electrode is calculated with the fitted Fourier series as the boundary conditions of Poisson equation. It is important to determine the number of terms of Fourier series. If too few terms are used, the experimental voltage may not be fitted well due to insufficient degrees of freedom. If too many terms are used, the small variation of high frequency components of Fourier series leads to the oscillation of simulated current. The simulation temporal discharge current density along with measurements is present in Figure 7 for discharge as applied voltage of 8 kV with voltage fitted by 30 terms of a Fourier series, the result of fitted voltage is in well agreement with experimental data.. 3.4 Grid Convergence Tests Figure 7 shows that test grid independence on discharges for N2/0.01%NH3 AP-DBD as the applied voltage of 8 kV and the frequency of 30 kHz. There is no obvious difference to be observed for various cell numbers throughout a cycle. Table 5 shows cycle-spatial-averaged number densities for various cell number, the result of 60 cells underestimates the number densities of charge species throughout a cycle, which overestimates the number densities of neutral species throughout a cycle, while the those results of 130 and 370 cells is similar. Therefore, we chose 130 cells for all simulation.. 20.
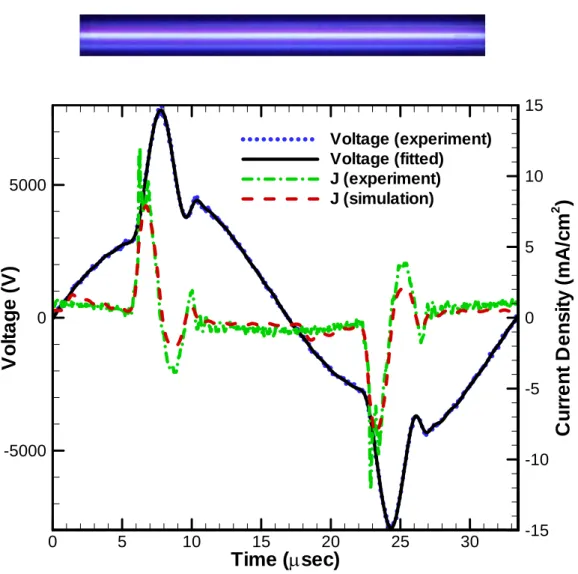
(39) 3.5 Validation with Experimental Results Figure 8 shows the comparison of simulated discharge current densities generated by a pure nitrogen AP-DBD with the experimental data obtained in this study. Detailed description of the experimental setup can be found in Chiang et al. [57] and are not repeated here for brevity. On top of the figure, there is a photo taken from the bottom of the discharge with 0.2 seconds of exposure time. It shows that the discharge is very uniform in the direction parallel to the plates, which may justify the use of 1-D fluid modeling in the current study. Similar homogeneous DBDs with nitrogen at atmospheric condition were also found in several previous experimental and numerical studies [[29][31] and references cited therein]. Results show that the simulated discharge current densities are in excellent agreement with the measurements quantitatively. This may be attributed to the LMEA approach adopted in the current fluid modeling, which has demonstrated better agreement with measurements for low-pressure gas discharge [48], although it is atmospheric in the current study. Similarly, the discharge current densities for the cases of 0.1% and 2.0% addition of NH3 are found to agree well with the experiments. In general, the addition of NH3 into the nitrogen AP-DBD does not influence the discharge current densities very much based on the simulations and experiments, although the visible light emission becomes dimmer with increasing concentration of NH3. The dimmer light emission with increasing ammonia amount may possibly be attributed to less emission of photons resulting from, e.g., N2(C3Πu) to N2(B3Πg) and makes the photo much dimmer. The problem will be discussed in Chapter 5.. 21.
(40) 3.6 Effects of Ammonia Addition on Nitrogen Discharge Figure 9 shows the spatiotemporal averaged number densities of various charged species as a function of different concentrations of ammonia addition in a nitrogen AP-DBD. Results show that charged species such as electron, N2+ and N4+ are essentially the same with ammonia addition in the range of 0-2%, which leads to the approximately the same discharge current densities. In addition, N2+ is the most dominant charged species and is at least two orders of magnitude more than electron, which is a typical feature of Townsend-like discharge. In the current study, the electric field is slightly increased from anode to cathode, much more ions than electrons, much more electrons near the anode, and currently density is relatively high (~10 mA/cm2), which is termed as “Townsend-like discharge”. For the ammonia reaction related charged species, such as NH4+ and NH2+, their concentrations generally increase with increasing addition of ammonia and become roughly the same after 0.5% of ammonia addition. In brief summary, the order of decreasing amount of charged species is N2+ > N4+ > Ne > NH2+ > NH4+ and N2+ > N4+ > NH4+ > Ne > NH2+ at smaller and larger ammonia addition respectively. Figure 10 shows the temporal profiles of space-averaged number densities of charged species of nitrogen AP-DBD with 0.1% ammonia addition. Results demonstrate that the number density of electron is always much smaller than the total number density of ions (N2+ and N4+) and is nearly the same as NH4+ during the gas breakdown period throughout a cycle. The simulated electric field across the gap is almost linear with slight distortion by the charge density during the breakdown period, which will be shown later (Figure 12). The above two phenomena demonstrate that it is a typical Townsend-like discharge [7][38], in which there is no quasi-neutral region and very weak (slightly non-constant) electric field in the gap. In addition, N2+ is 22.
(41) found to be most abundant during the breakdown process, while N4+ becomes dominant during the post-breakdown process due to associative ionization between metastable nitrogen generated during the breakdown process. NH4+ is found to be secondly dominant after the breakdown caused by the charge exchange between NHx+ (x = 1, 2, and 3) ions, leading to the formation of abundant NH4+, which has the smallest ionization potential among all the ions in the chemical reaction channels. In addition, Figure 11 shows the temporal profiles of space-averaged number densities of neutral species of nitrogen AP-DBD with 0.1% ammonia addition in a cycle. Results show that all neutral species change very little with time except metastable nitrogen throughout a cycle. Metastable nitrogen has changed dramatically with time, which is caused by excitation of electron impact on ground N2 (No. 32-37 in Table 2), excited recombination of electron-ion on N4+ (No. 5 in Table 3), excited recombination, exchange of neutral-neutral collision (No. 44, 45, and 47 in Table 4). In Figure 10 and Figure 11, the electrical properties of the discharges reach a quasi-steady state at 3-5 cycles. It is because diffusion time scale is much longer than drift time scale due to electric field for charged species. It is also true that densities of neutral species increase slightly with time except the metastable species because of its very short life time. Thus, it is difficult for the neutral species to reach the “real” quasi-steady state within such a short period of physical time (3-5 cycles) in the simulation. However, the structure of discharge remains essentially unchanged even when the neutral species reach equilibrium after very long period of simulation. Figure 12 and Figure 13 show that the snapshots of distribution of charged species at the peak of the breakdown (highest discharge current density) and after the breakdown, respectively, which further reveals that nitrogen DBD is a typical Townsend-like discharge with addition of 0.1% NH3 as mentioned earlier. These two 23.
(42) plots both show that ions outnumber electrons throughout the cycle. During the breakdown period, the electric field is almost linear (3-3.5 kV/mm) with slight distortion due to ion space charge and the electron temperature is roughly 5 eV. All the above show that it is a typical Townsend-like discharge as presented by other authors [7][38]. In the post-discharge period, only a very small amount of N4+ exists, resulting from the associative ionization of metastable/metastable nitrogen, with nearly a traced amount of electrons. Note the amounts of electron, N2+ and NH4+ are all very low which are not included in the plots. The corresponding electric field is almost constant with a smaller value (~1 kV/mm), which mimics a capacitor without charged particles. Figure 14 and Figure 15 show the spatiotemporal evolution of number density of electron and N2+ along with the temporal simulated current density in a cycle. They show that electrons are concentrated near the anode (x=1 mm) and the ions (N2+) is relatively uniform across the gap. It clearly shows that ions outnumber electrons very much during the breakdown period near the cathode dielectric surface (x= 2 mm) when the discharge current is appreciable. Finally, Figure 16 presents the spatiotemporal averaged number densities of neutral species as a function of ammonia addition. The results show that the most dominant species is atomic nitrogen which had been observed experimentally in pure nitrogen AP-DBD [58] and remains nearly the same no matter how much ammonia is added with the present test condition. Interestingly, metastable nitrogen shows similar trend, although it is approximately 2 orders of magnitude smaller than the atomic nitrogen. The decreasing order of number densities of all neutral species except metastable nitrogen is N > NH2 > H > NH > H2 > N2H2. Abundant atomic nitrogen is generated from three major types of reaction: 1) dissociation of electron-impact on 24.
(43) NH, NH2 and N2 (No. 14, 21, and 38 in Table 2), 2) de-excited metastable atomic nitrogen (No. 7 in Table 3), and 3) dissociation, recombination and excitation into ground state of neutral-neutral collision (No. 12, 16, 42, and 48 in Table 4). The number densities of NH2, H, NH, H2 and N2H2 increase rapidly with increasing addition of ammonia. It is noted that the primary source of NH2 generation is by electron impact dissociation with ammonia because of low threshold energy of 5.72 eV for dissociation. Abundant generation of NH2 in N2/NH3 discharge plays an important role in incorporating N1s into some polymer to make it biocompatible [25][26].. 3.7 Summary In this chapter, we have employed one-dimensional self-consistent fluid modeling for simulating a parallel-plate atmospheric-pressure dielectric barrier discharge (driven by a 30 kHz power source) of nitrogen added with small amount of ammonia (0-2%). Simulations were validated by good agreement between predicted and experimental current densities. The simulated results show that the discharges of N2 mixed with NH3 (0-2%) are all typical Townsend-like discharges because the ions always outnumber the electrons to a large extent which leads to no quasi-neutral region in the gap throughout the cycle. N2+ and N4+ are found to be the most abundant charged species during and after the breakdown process, respectively, like a pure nitrogen DBD. NH4+ increases rapidly initially, respectively, with increasing addition of NH3 and levels off eventually. In addition, N is the most dominant neutral species, except the background species, N2 and NH3, and NH2 and H are the second dominant species, which increase with increasing added NH3 in the range of added ammonia. Abundant H, NH and NH2 in a discharge of N2 mixed with NH3 may play a critical 25.
(44) role in some applications which require functional group incorporation [e.g., [24][25][26]].. 26.
(45) Chapter 4 Parametric Study of One-Dimensional Fluid Modeling of Nitrogen/Ammonia Dielectric Barrier Discharge 4.1 Simulation conditions The discharge is sustained in the gap (0.1-1.2 mm) between two electrodes with each covered by a quartz or ceramic plate (0.5-2 mm) having measured relative permittivity of 4.76 and 11.63, respectively. The powered electrode (left) is driven by an AC power source (10-100 kHz) with sinusoidal voltages, and the right electrode is grounded throughout the cycle. The other simulation conditions are the same as those used in Chapter 3. The test conditions are summarized in Table 6, in which concentration of NH3 is kept as 0.1% for all cases. The plasma chemistry of N2/NH3 AP-DBD used in this study is the same as Chapter 3.. 4.2 Effect of Varying Voltage Amplitudes of Power Source Figure 17 shows the temporal distribution of discharge properties within a cycle at various amplitudes of voltage (6-10 kV with 8 kV as the reference) at the simulation conditions of a frequency of 30 kHz, a gap distance of 1 mm, and quartz as the dielectric material, as those summarized in Table 6. Figure 17a shows the temporal distributions of discharge current density and the referable applied voltage at different amplitudes of applied voltage. Results show that the maximum current density changes from 2.15 to 4.37 mA/cm2 as the voltage amplitude increases from 6 to 10 kV and the maximum current density for the 10 kV case is two times larger than that of the 6 kV case. The maximal discharge current density increases with 27.
(46) increasing amplitude of voltage in the range of 6-10 kV because rate of voltage rising of 10 kV is greater than that of 6 kV at the same frequency of oscillation, which favors the energy absorption from electric field for electrons. The results also show that the gas breakdown becomes earlier and longer for the case of larger voltage amplitude. Figure 17b shows the temporal variation of gap voltage at various amplitudes of applied voltage. Surprisingly, the results show that maximal saturated gap voltage (~ 3 kV) is almost the same for all applied voltages and appears earlier temporally with increasing applied voltages. Note during the breakdown period the resulting electric field is approximately 30 kV/cm that is almost the same as the measured breakdown electric field of nitrogen under atmospheric condition with a similar frequency of power source [15]. Figure 17c shows that maximal electron number density increases nearly two times for the 10 kV case as compared to the 6 kV case, which is attributed to larger rate of gap voltage rising and longer sustaining gap voltage in the former. Figure 18a shows the spatially and temporally averaged number densities of charged species for various amplitudes of voltage. The simulated results for the 8 kV case are not shown here for the brevity of presentation. It is seen that the number densities of charged species increase with increasing amplitude of voltage. Among these, N2+, N4+ and NH4+ are found to be the most dominant ion species. On the other hand, results show that the number density of the most dominant ion species (N2+) is much larger than that of electron throughout a cycle in the amplitude range of 6-10 kV. It shows that they are typical Townsend-like discharges [7][38][40]. Figure 18b shows the number densities of neutral species for various amplitudes of voltage. Results show that the number densities of neutral species for larger amplitude of voltage are always higher than that for smaller amplitude of voltage in a cycle. The most dominant species is atomic nitrogen which is produced 28.
數據
![Table 1. Order of magnitude of the different species in the two well characterized homogeneous DBD regimes [29]](https://thumb-ap.123doks.com/thumbv2/9libinfo/8432814.181314/80.892.87.808.274.530/table-order-magnitude-different-species-characterized-homogeneous-regimes.webp)
![Table 2. Electron-Impact Collisions include N 2 /NH 3 plasma chemistry. All rate constants are adopted from [49][65]](https://thumb-ap.123doks.com/thumbv2/9libinfo/8432814.181314/81.892.129.740.198.1156/table-electron-impact-collisions-include-chemistry-constants-adopted.webp)
+7


![Figure 2. Measured light distribution and calculated space distribution from anode to cathode in (a) a He APGD and (b) a N 2 APTD when the discharge current intensity is maximum [38]](https://thumb-ap.123doks.com/thumbv2/9libinfo/8432814.181314/106.892.222.693.139.916/figure-measured-distribution-calculated-distribution-discharge-intensity-maximum.webp)


相關文件
Then, it is easy to see that there are 9 problems for which the iterative numbers of the algorithm using ψ α,θ,p in the case of θ = 1 and p = 3 are less than the one of the
By exploiting the Cartesian P -properties for a nonlinear transformation, we show that the class of regularized merit functions provides a global error bound for the solution of
Joint “ “AMiBA AMiBA + Subaru + Subaru ” ” data, probing the gas/DM distribution data, probing the gas/DM distribution out to ~80% of the cluster. out to ~80% of the cluster
We explicitly saw the dimensional reason for the occurrence of the magnetic catalysis on the basis of the scaling argument. However, the precise form of gap depends
incapable to extract any quantities from QCD, nor to tackle the most interesting physics, namely, the spontaneously chiral symmetry breaking and the color confinement..
The case where all the ρ s are equal to identity shows that this is not true in general (in this case the irreducible representations are lines, and we have an infinity of ways
By this, the second-order cone complementarity problem (SOCCP) in H can be converted into an unconstrained smooth minimization problem involving this class of merit functions,
Miroslav Fiedler, Praha, Algebraic connectivity of graphs, Czechoslovak Mathematical Journal 23 (98) 1973,
