Corresponding authors: [1] Fuu-Jen Tsai, Ph.D., Genetic Center, China Medical University Hospital, No. 2, Yuh-Der Rd., Taichung 40447, Taiwan, R.O.C. Tel: +886-4-22062121 ext. 2041, Fax: +886-4-22033295, E-mail: d0704@www.cmu.edu.tw; [2] Lei Wan, Ph.D., School of Chinese Medicine, China Medical University, No. 91, Hsueh-Shih Rd., Taichung 40402, Taiwan, R.O.C. Tel: +886-4-22053366 ext. 3326, Fax: +886-4- 22032295, E-mail: leiwan@mail.cmu.edu.tw
*Kun-Hsi Tsai and Ching-Yao Chang contributed equally to this work.
Received: September 14, 2012; Revised (Final Version): March 15, 2013; Accepted: June 11, 2013.
2014 by The Chinese Physiological Society and Airiti Press Inc. ISSN : 0304-4920. http://www.cps.org.tw
Association of Interleukin-16 Polymorphisms
with Graves’ Disease in a Taiwanese Population
Kun-Hsi Tsai1, 2, *, Ching-Yao Chang3, *, Fuu-Jen Tsai4, 5, Hui-Ju Lin6, Yuh-Shyong Yang2,Yun-Ping Lim7, Chiu-Chu Liao4, and Lei Wan3, 8
1Department of Emergency Medicine, Chi-Mei Hospital, Liouying, Tainan 71004
2Department of Biological Science and Technology, National Chiao Tung University, Hsinchu 30010 3Department of Biotechnology, Asia University, Taichung 41354
4Genetic Center, China Medical University Hospital, Taichung 40447
5School of Post Baccalaureate Chinese Medicine; China Medical University, Taichung 40402 6Department of Ophthalmology, China Medical University Hospital, Taichung 40447 7Department of Pharmacy, College of Pharmacy, China Medical University, Taichung 40402
and
8School of Chinese Medicine, China Medical University, Taichung 40402, Taiwan, Republic of China
Abstract
Graves’ disease (GD) is a complex, organ-specific autoimmune disease wherein the thyroid gland becomes enlarged and overactive. During GD progression, T cells secrete interleukin-16 (IL-16) to pro- mote inflammation, act as chemoattractants that recruit more inflammatory cells, and activate target cells to enhance the development of GD. To investigate the role of IL-16 in GD, we genotyped 474 patients with GD at 8 single-nucleotide polymorphisms (SNPs) in the IL-16 gene. The IL-16 SNP rs8028364 was
found to be associated with GD when compared with the control subjects (P = 2.93 × 10⁻¹⁷; CG genotype:
odds ratio [OR] = 0.2 [0.07, 0.59]; CC genotype: OR = 0.03 [0.01, 0.09]). The rs1131445 polymorphism was found to be associated with GD under the allelic model (P = 0.01; G allele: OR = 1.97 [1.17, 3.32]). Sliding-window haplotype analysis by the PLINK program showed that the most significant haplotype was provided by the 6-SNP haplotype window, consisting of rs7182786, rs8028364, rs12907134,
rs4128767, rs4072111 and rs8031107 (P = 2.31 × 10-51). We found 2 protective haplotypes: GCAAGG (P =
8.69 × 10⁻⁷; OR = 0.22 [0.12, 0.41]) and AGAAGG (P = 0.0012; OR = 0.26 [0.12, 0.6]). In addition, GGGGAA
(P = 0.39; OR = 2.32 [1.08, 4.99]) and GGGAGA (P = 1.18 × 10⁻⁵; OR = 5.54 [2.50, 12.31]) were found to
be the two high-risk haplotypes. These results suggest that polymorphisms in IL-16 may be used as genetic markers for the diagnosis and prognosis of GD.
Key Words: Graves’ disease, IL-16, polymorphisms
Introduction
Graves’ disease (GD) is a complex, organ-spe-cific autoimmune disease wherein the thyroid gland becomes enlarged and overactive (21). GD is char- acterized by a variety of clinical features such as hyper- thyroidism, diffuse goiter, presence of autoantibodies
against thyroid-specific antigens and dermopathy. Re- sults of genetic studies from homozygous twins have revealed the importance of genetic factors in the de- velopment of GD and suggest that approximately 80% of GD development is determined by genetic factors (2). The infiltration of T cells into the thyroid gland is an important feature of GD. The accumulation of T
cells in the thyroid gland is considered an important factor in promoting inflammatory responses and tissue remodeling, which worsen the progression of GD (7, 18). T cells secrete a variety of cytokines, including IL-16, that promote inflammation, act as chemoattrac- tants to recruit more inflammatory cells, and activate target cells to enhance the progression of GD (5, 11, 13, 14).
IL-16, a known T-cell chemoattractant, promotes the migration of T cells to target sites. Several cell types express IL-16, including T cells, eosinophils, dendritic cells, fibroblasts, epithelial cells and neu-ronal cells (5). The serum levels of IL-6, IL-1β and tumor necrosis factor (TNF)-α are higher in GD pa- tients than in control subjects (15). Gianoukakis et al. showed that treating thyrocytes with IL-1β increases chemotactic activities by upregulating the expression levels of IL-16 (8). In addition, fibroblasts treated with IgG isolated from GD patients also increase the expression level of IL-16 (17). These studies suggest the importance of IL-16 in the pathogenesis of GD. IL-16 is a CD4-specific ligand required for the initia- tion of the bioactivities. By binding to the CD4 mole- cule, IL-16 activates T cells, monocytes, macrophages and dendritic cells, and increases the production of TNF-α, IL-1β and IL-6 leading to inflammatory re- sponses (3, 4, 12). In GD, T cells infiltrate the thyroid gland and collaborate with thyrocytes and fibroblasts to form a paracrine loop between IL-16 and IL-1β, which maintains the inflammatory responses. This vicious cycle continuously induces inflammatory re- sponses in the thyroid gland and subsequently induces GD.
To determine the genetic role of IL-16 in GD pathogenesis, we investigated single-nucleotide polymorphisms (SNPs) in the IL-16 gene that may be associated with the protection against or risk factors for GD in Taiwan Chinese patients.
Materials and Methods
Patients
A total of 474 patients with GD were enrolled in this study. The diagnosis of GD was performed by endocrinologists and was assessed by ophthalmolo-gists. The diagnosis of GD was made on the basis of clinical symptoms and biochemical affirmation of hyperthyroidism, multinodular goiter and a positive result for at least one of the following biochemical tests: thyroid-stimulating hormone receptor antibody, diffusely increased iodine-131 uptake in the thyroid gland and exophthalmos. Patients with GD were clas- sified in accordance with the NOSPECS system recom- mended by the American Thyroid Association. Blood samples were collected for genomic DNA isolation
and serological tests. This study was approved by the ethical committee and institutional review board of the China Medical University Hospital. Informed consent was obtained from all patients or their guardians.
SNP Genotyping
IL16 SNP genotype information was retrieved from the HapMap database for the HCB + JPT popu- lations. The gene boundary of IL-16 was determined by SNPper program (http://snpper.chip.org) which are -10 kb from the transcription start site and +10 kb from the stop codon. Tagging SNPs were selected through the Tagger function in the Haploview soft- ware program (version 4.2). The selection criteria were: [1] the minor allele frequency should be greater than 10%; [2] SNPs that potentially affect transcrip-tion efficiency, translatranscrip-tion efficacy or protein func-tions were selected first; and [3] the availability of probes or primers that passed the manufacturer’s qual- ification requirements (Applied Biosystems Inc., Foster City, CA, USA). We used aggressive tagging method which use 2- and 3-marker haplotypes and set a maximum of 8 tags. We forced to include rs4072111 which may influence the splicing efficiency. The rest of the SNPs were determined by the Haploview soft- ware. Eight polymorphisms were selected according to these criteria: rs7182786 (A/G), rs8028364 (C/G), rs12907134 (A/G), rs4128767 (A/G), rs4072111 (A/G), rs8031107 (A/G), rs4072680 (A/G) and rs1131445 (A/G).
Statistical Analysis
PLINK (v. 1.07; http://pngu.mgh.harvard.edu/ ~purcell/plink/) was used for the analysis of the genotype frequency and allelic frequency distribu-tions of the polymorphisms in controls and patients with GD. Hardy-Weinberg equilibrium (HWE) was performed separately for controls and GD patients. Haplotype analysis with sliding windows were ana-lyzed with PLINK. Haplotype blocks were created with Haploview (http://www.broadinstitute.org/ scientific-community/science/programs/medical-and-population-genetics/haploview/haploview). A
P-value less than 0.05 was considered statistically
significant. The odds ratio (OR) was calculated from genotype frequencies and allelic frequencies with a 95% confidence interval (CI).
Results
Eight SNPs were examined; these were desig-nated S1 to S8 in sequential order from the 5′-end of the IL-16 gene for easy reference (Table 1). All SNPs were in Hardy-Weinberg equilibrium. The genotype
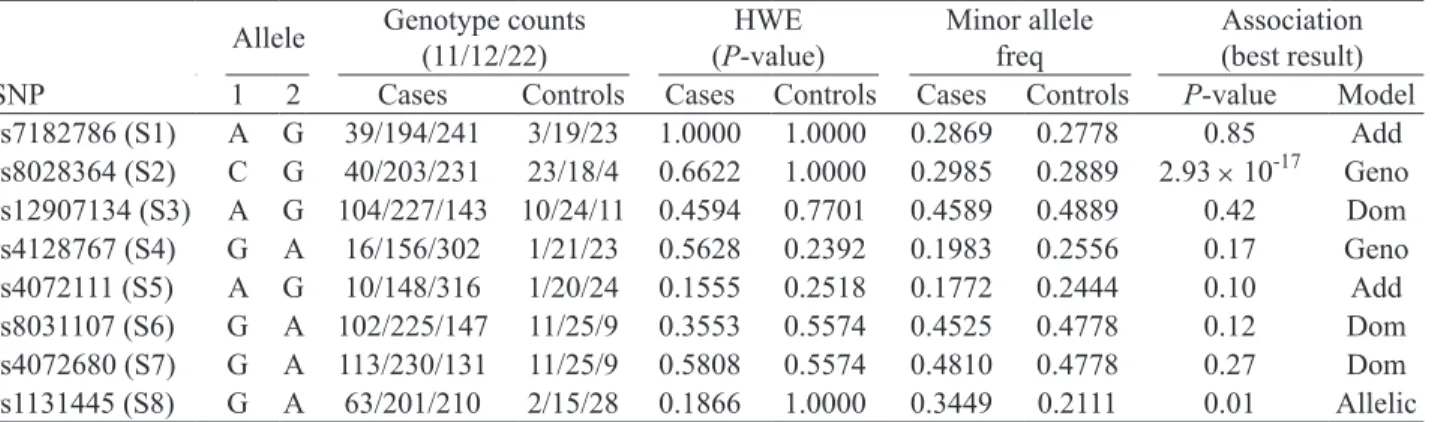
Table 1. Genotype count, Hardy-Weinberg equilibrium testing, minor allele frequency and association of IL-16 SNPs
Allele Genotype counts (11/12/22) (P-value)HWE Minor allele freq Association (best result) SNP 1 2 Cases Controls Cases Controls Cases Controls P-value Model rs7182786 (S1) A G 39/194/241 3/19/23 1.0000 1.0000 0.2869 0.2778 0.85 Add rs8028364 (S2) C G 40/203/231 23/18/4 0.6622 1.0000 0.2985 0.2889 2.93 × 10⁻¹⁷ Geno rs12907134 (S3) A G 104/227/143 10/24/11 0.4594 0.7701 0.4589 0.4889 0.42 Dom rs4128767 (S4) G A 16/156/302 1/21/23 0.5628 0.2392 0.1983 0.2556 0.17 Geno rs4072111 (S5) A G 10/148/316 1/20/24 0.1555 0.2518 0.1772 0.2444 0.10 Add rs8031107 (S6) G A 102/225/147 11/25/9 0.3553 0.5574 0.4525 0.4778 0.12 Dom rs4072680 (S7) G A 113/230/131 11/25/9 0.5808 0.5574 0.4810 0.4778 0.27 Dom rs1131445 (S8) G A 63/201/210 2/15/28 0.1866 1.0000 0.3449 0.2111 0.01 Allelic The SNPs are designated as S1 to S8 for easy reference and discussion. The two alleles of each SNPs are assigned as “1” or “2” and the genotypes counts are the exact numbers of genotypes 11, 12 and 22 in either the GD patients or control individuals. HWE stands for Hardy-Weinberg equilibrium. The association analysis was performed using five different models for each SNP: genotypic (Geno), additive (Add), dominant (Dom), recessive (Rec) and allelic models. The most significant results are shown in this table.
Fig. 1. Linkage disequilibrium (LD) plots of the SNPs in IL-16 identified from 45 control subjects and 474 GD patients. The gene orientation is from 5′ to 3′ (left to right) relative to the positive strand of IL-16 in control subjects (A) and GD patients (B). The plots were constructed using Haploview ver. 4.2. The D′ (×100) (red), and r2 (×100) (grey) values are shown as diamond- shaped data points. Strong LD is indicated by dark gray/red, whereas light gray/pink and white indicate uninformative and low confidence values, respectively.
1 2 3 4 5 Block 1 (1 kb)6 7 8 rs7182786 rs8028364 rs12907134 rs4128767 rs4072111 rs8031107 rs4072680 rs1131445 84 83 83 64 3 3 5 0 0 35 36 29 9 9 2 1 8 8 28 36 82 82 1 A B 2 3 4 Block 2 (6 kb)5 6 7 8 Block 1 (59 kb) rs7182786 rs8028364 rs12907134 rs4128767 rs4072111 rs8031107 rs4072680 rs1131445 81 4 4 25 73 66 63 89 97 83 2 0 70 62 4 19 3 2 98 4 0 1 0 4 0 98 99 98 1 2 3 4 5 Block 1 (1 kb)6 7 8 rs7182786 rs8028364 rs12907134 rs4128767 rs4072111 rs8031107 rs4072680 rs1131445 28 26 26 4 0 0 0 0 0 1 4 25 6 0 13 32 13 10 0 0 0 0 0 2 4 24 24 1 Block 1 (59 kb)2 3 4 Block 2 (6 kb)5 6 7 8 rs7182786 rs8028364 rs12907134 rs4128767 rs4072111 rs8031107 rs4072680 rs1131445 31 0 0 0 50 9 8 40 20 7 0 0 5 17 0 1 0 0 10 0 0 0 0 0 0 17 88 19
and allele distributions of the 8 polymorphisms are shown in Table 1. Five different genetic models (geno- typic, additive, dominant, recessive and allelic) were used to determine the difference between the healthy population of Han Chinese in Beijing (HCB) (obtained from the PubMed SNP database) and GD patients. Comparison of the genotypes and allele frequencies between the control subjects and GD patients showed no significant differences in 6 of the 8 polymorphisms, including S1, S3, S4, S5, S6 and S7 (Table 1); how- ever, significant differences were found for S2 and S8. The lowest P-values among the 5 different genetic models were observed in the genotypic model for S2 (P = 2.93 × 10⁻¹⁷) and the allelic model for S8 (P = 0.01)
(Table 1). The 8 SNPs were then subjected to a link- age disequilibrium (LD) plot by using the Haplo-view program. The D′ and r2 values are presented as
diamond-shaped points on the graph (Fig. 1). The LD map showed distinct differences between the 2 groups; an apparent variation in the S2 polymorphism was de- tected, indicating that this SNP may play some role in developing GD (Fig. 1).
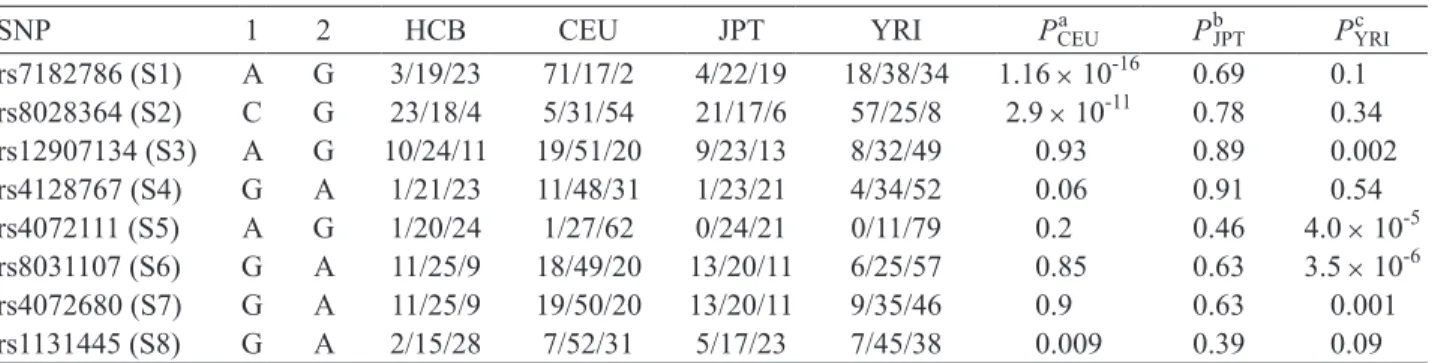
The selected 8 SNPs (S1 to S8) are regarded as evolutionarily stable because no significant differences were found between HCB and Japanese in Tokyo, Japan (JPT). For S2 and S8, we did not detect signifi- cant differences between HCB and a more distant popu- lation of Yoruba in Ibadan, Nigeria (YRI) (P = 0.34 and 0.09, respectively), indicating they are stable be- tween different ethnic groups (Table 2).
The CG and CC genotypes at S2 had a 0.2- and 0.03-fold lower risk of developing GD, respectively. The C allele in S2 showed a protective role in GD development and was 0.17-fold lower than the G allele. The G allele at S8 showed a 1.97-fold increase in risk for the development of GD compared with the A allele (Table 3). Taken together, these results showed a significant difference between the control
groups and GD patients with regard to genotype or allele distribution for the S2 polymorphism. Further- more, the frequency of the C allele was significantly lower in GD patients.
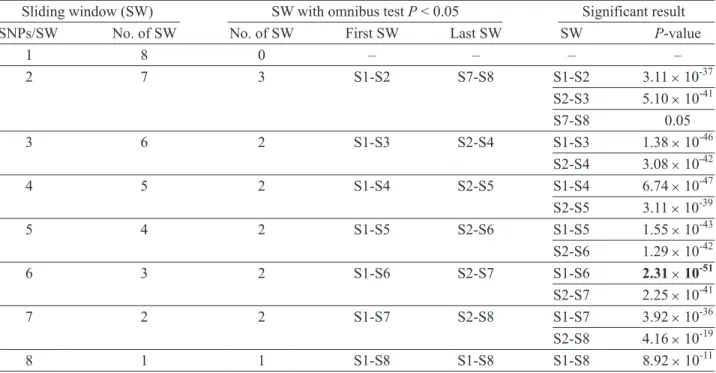
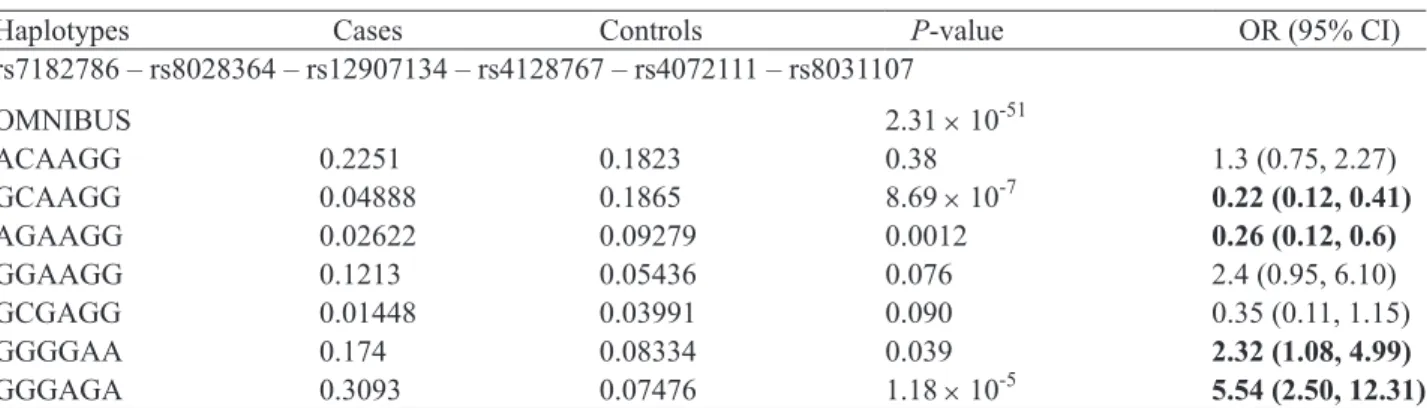
Haplotype frequencies were estimated among the 8 polymorphisms. The haplotypes were determined using a sliding-window approach and were examined in haplotypes of all possible sizes (Table 4). We used 36 sliding windows in all, and 14 of these were sig- nificantly associated with GD (omnibus test P < 0.05). For sliding windows with a size of up to 3 SNPs per window, the omnibus test result was significant when S2 was included in the window. The importance of S2 was more obvious when the sliding windows at 6 SNPs per window showed the significant results. The relative importance of SNPs within a sliding window was less apparent when the SNPs increased beyond 6 SNPs per window (Table 4). The details of haplo- type analysis for the 6-SNP window are shown in Table 5. We found 2 protective haplotypes: GCAAGG (P = 8.69 × 10⁻⁷; OR = 0.22 [0.12, 0.41]) and AGAAGG
(P = 0.001; OR = 0.26 [0.12, 0.6]). The two high-risk haplotypes were GGGGAA (P = 0.39; OR = 2.32 [1.08, 4.99]) and GGGAGA (P = 1.18 × 10⁻⁵; OR = 5.54 [2.50,
12.31]).
Discussion
In this study, we investigated the role of IL-16 polymorphisms in the risk of GD pathogenesis. Among the eight tagSNPs tested, rs8028364 and rs1131445 showed significant association with GD. Moreover, haplotype analysis showed that GCAAGG and AGAAGG played a protective role, whereas GGGGAA and GGGAGA were risk factors for GD.
In the study of the association between IL-16 polymorphisms with GD, Gu et al. found that the IL-16 polymorphisms were associated with GD as well as
Table 2. Genotype distribution among different ethnic populations
SNP 1 2 HCB CEU JPT YRI Pa CEU PbJPT PYRIc rs7182786 (S1) A G 3/19/23 71/17/2 4/22/19 18/38/34 1.16 × 10⁻¹⁶ 0.69 0.1 rs8028364 (S2) C G 23/18/4 5/31/54 21/17/6 57/25/8 2.9 × 10⁻¹¹ 0.78 0.34 rs12907134 (S3) A G 10/24/11 19/51/20 9/23/13 8/32/49 0.93 0.89 0.002 rs4128767 (S4) G A 1/21/23 11/48/31 1/23/21 4/34/52 0.06 0.91 0.54 rs4072111 (S5) A G 1/20/24 1/27/62 0/24/21 0/11/79 0.2 0.46 4.0 × 10⁻⁵ rs8031107 (S6) G A 11/25/9 18/49/20 13/20/11 6/25/57 0.85 0.63 3.5 × 10⁻⁶ rs4072680 (S7) G A 11/25/9 19/50/20 13/20/11 9/35/46 0.9 0.63 0.001 rs1131445 (S8) G A 2/15/28 7/52/31 5/17/23 7/45/38 0.009 0.39 0.09 Genotype frequencies were determined by Chi-square test using 2 × 3 contingency tables. HCB was compared with CEUa or JPTb or YRIc. P-values less than 0.05 were considered significant. HCB: Han Chinese in Beijing, China; CEU: Utah residents with ancestry from northern and western Europe; JPT: Japanese in Tokyo, Japan; YRI: Yoruba in Ibadan, Nigeria.
Table 3. Odds ratios of SNPs
SNP Genotype Odds ratio Allele Odds ratio
rs7182786 (S1) AA 1.24 (0.36-4.33) A 1.05 (0.65-1.69) AG 0.97 (0.52-1.84) G 1 GG 1 rs8028364 (S2) CC 0.03 (0.01-0.09) C 0.17 (0.11-0.28) CG 0.2 (0.07-0.59) G 1 GG 1 rs12907134 (S3) AA 0.8 (0.33-1.95) A 0.89 (0.58-1.37) AG 0.73 (0.35-1.53) G 1 GG 1 rs4128767 (S4) GG 1.22 (0.15-9.6) G 0.72 (0.44-1.19) GA 0.57 (0.3-1.05) A 1 AA 1 rs4072111 (S5) AA 0.76 (0.09-6.18) A 0.67 (0.4-1.11) AG 0.56 (0.3-1.05) G 1 GG 1 rs8031107 (S6) GG 0.57 (0.23-1.42) G 0.76 (0.49-1.17) GA 0.55 (0.25-1.21) A 1 AA 1 rs4072680 (S7) GG 0.71 (0.28-1.76) G 0.85 (0.55-1.31) GA 0.63 (0.29-1.39) A 1 AA 1 rs1131445 (S8) GG 4.2 (0.97-18.12) G 1.97 (1.17-3.32) GA 1.79 (0.93-3.44) A 1 AA 1
Table 4. Sliding window (SW) haplotype analysis based on omnibus tests for all windows of all possible sizes across the eight SNPs
Sliding window (SW) SW with omnibus test P < 0.05 Significant result
SNPs/SW No. of SW No. of SW First SW Last SW SW P-value
1 8 0 ‒ ‒ ‒ ‒ 2 7 3 S1-S2 S7-S8 S1-S2 3.11 × 10-37 S2-S3 5.10 × 10-41 S7-S8 0.05 3 6 2 S1-S3 S2-S4 S1-S3 1.38 × 10-46 S2-S4 3.08 × 10-42 4 5 2 S1-S4 S2-S5 S1-S4 6.74 × 10-47 S2-S5 3.11 × 10-39 5 4 2 S1-S5 S2-S6 S1-S5 1.55 × 10-43 S2-S6 1.29 × 10-42 6 3 2 S1-S6 S2-S7 S1-S6 2.31 × 10-51 S2-S7 2.25 × 10-41 7 2 2 S1-S7 S2-S8 S1-S7 3.92 × 10-36 S2-S8 4.16 × 10⁻¹⁹ 8 1 1 S1-S8 S1-S8 S1-S8 8.92 × 10⁻¹¹
Graves’ ophthalmopathy (GO) (9). However, we did not find any association between IL-16 polymorphisms with GO. There are two possible explanations for the discrepancies: [1] we did not include in our study rs4778889 and rs4778641 which are the two signifi-cant SNPs in the study of Gu et al.; [2] it is not pos- sible to get two exactly the same clinical samples with the same genetic background often resulting in dif-ferent association datasets.
The potential biological functions of the SNPs tested in this study were predicted through the web-site: http://snpinfo.niehs.nih.gov/snpfunc.htm. The website predicts the following potential biological func- tions: transcription factor binding site, non-synonymous coding SNPs, stop codon, damaging SNPs, splicing regulation and microRNA (miRNA) binding site. No potential influences on the biological functions of S1, S2, S3, S4 and S7 were found. For S5 (rs4072111) and S6 (rs8031107), the results show S5 and S6 to be exonic splicing enhancers (ESEs) that influence mRNA transcription.
Exons in mammalian cells generally comprise only a fraction of the length of a pre-mRNA transcript. Accurate splicing requires the identification of shorter exonic sequences from lengthy intronic sequences. This identification is achieved by the binding of spli- ceosomal components to intronic and exonic splicing sequence elements. These short sequences can either enhance (ESEs) or reduce (exonic splicing silencers or ESSs) splicing at a nearby splice site (10, 20). The presence of a higher density of ESEs in authentic exons than in pseudo-exons may contribute to the recogni- tion of the correct exons, whereas the presence of ESSs in pseudo-exons may suppress their splicing (6, 16). Thus, both classes of elements may contribute signifi- cantly to the specificity of pre-mRNA splicing.
According to the results of the PolyPhen-2
analysis, the non-synonymous amino change in S5 (Pro434Ser) (with a score of 0.958) may influence the structure and function of IL-16 (1). S8 (rs1131445), located in the 3′-untranslated region (3′-UTR), is pre- dicted to be a potential miRNA binding site for the miRNAs hsa-miR-1184, hsa-miR-1301, hsa-miR-135,
hsa-miR-18 and hsa-miR-624. The binding of miRNA
would post-trancriptionally down-regulate the IL-16 expression level.
An exhaustive haplotype analysis of all poten- tial window sizes (sliding-window strategy) was per- formed to identify the most appropriate and significant associations between GD patients and the control sub- jects. The results show that there is at least 1 haplotype significantly associated with GD (Table 4). The 6-SNP window, consisting of rs7182786 (S1), rs8028364 (S2), rs12907134 (S3), rs4128767 (S4), rs4072111 (S5) and rs8031107 (S6) shows the most significant associa- tion with GD (P = 2.3 × 10-51). Among the SNPs, S3
and S6 seem to play important roles in determining whether the haplotypes are a risk or protective haplo- type. GC[A]AG[G] and AG[A]AG[G] are protective haplotypes, whereas GG[G]GAA and GG[G]AG[A] are risk haplotypes. The alleles A in S3 and G in S5 are protective alleles, whereas the alleles G in S3 and A in S5 are risk alleles in combination with the effects of S1, S2, S4, and S6.
There are some drawbacks in our studies. First, the sample size of the control groups was small. Second, although we did re-genotype all the patient samples on rs8028364 and confirmed the genotype and allele frequencies, one may still speculate the possi- bility of mis-typing the genotype CC to GG or GG to CC. Moreover, we did not determine the IL-16 con- centrations in the GD sera. An extended study is cur- rently being conducted to remedy the above draw-backs.
Table 5. Haplotype analysis for 6-SNP windows showing the lowest P-value among the all possible sliding windows
Haplotypes Cases Controls P-value OR (95% CI)
rs7182786 – rs8028364 – rs12907134 – rs4128767 – rs4072111 – rs8031107 OMNIBUS 2.31 × 10-51 ACAAGG 0.2251 0.1823 0.38 1.3 (0.75, 2.27) GCAAGG 0.04888 0.1865 8.69 × 10⁻⁷ 0.22 (0.12, 0.41) AGAAGG 0.02622 0.09279 0.0012 0.26 (0.12, 0.6) GGAAGG 0.1213 0.05436 0.076 2.4 (0.95, 6.10) GCGAGG 0.01448 0.03991 0.090 0.35 (0.11, 1.15) GGGGAA 0.174 0.08334 0.039 2.32 (1.08, 4.99) GGGAGA 0.3093 0.07476 1.18 × 10⁻⁵ 5.54 (2.50, 12.31)
The odds ratios (OR) are shown in boldface when their corresponding haplotypes are significantly associated with GD (P < 0.05). Only haplotypes with a frequency of 0.02 or above in either cases or controls are shown. PLINK calculates OR for a particular haplotype with reference to all the other haplotypes, and hence the reference haplotypes are different for different individual haplotypes under study.
In conclusion, the results of the present study sug- gest that the IL-16 genotypes and haplotypes may be associated with GD. This report provides evidence that polymorphisms of the IL-16 gene provide insight into the prediction of GD.
Acknowledgments
We thank Yu-Hui Liang for cataloging the samples and preparing the clinical data for the controls and GD patients. The authors also show special thanks to Professor Cheng-Wen Lin for his critical reading of this manuscript. This study was supported by a grant from the National Science Council (101-2320-B-039- 038-), Taipei, Taiwan, and grants from the China Medical University (CMU99-asia-17), China Medical University Hospital (DMR-102-084), Taichung, Taiwan and Chi-Mei Hospital, Liouying, Tainan, Taiwan (CLFHR10212).
References
1. Adzhubei, I.A., Schmidt, S., Peshkin, L., Ramensky, V.E., Gerasimova, A., Bork, P., Kondrashov, A.S. and Sunyaev, S.R. A method and server for predicting damaging missense mutations. Nat. Methods 7: 248-249, 2010.
2. Brix, T.H., Kyvik, K.O., Christensen, K. and Hegedus, L. Evidence for a major role of heredity in Graves’ disease: a population-based study of two Danish twin cohorts. J. Clin. Endocrinol. Metab. 86: 930-934, 2001.
3. Center, D.M., Kornfeld, H. and Cruikshank, W.W. Interleukin 16 and its function as a CD4 ligand. Immunol. Today 17: 476-481, 1996. 4. Cruikshank, W., Kornfeld, H., Berman, J., Chupp, G., Keane, J. and
Center, D. Biological activity of interleukin-16. Nature 382: 501- 502, 1996.
5. Cruikshank, W.W., Kornfeld, H. and Center, D.M. Interleukin-16. J. Leukoc. Biol. 67: 757-766, 2000.
6. Davis, R.L., Homer, V.M., George, P.M. and Brennan, S.O. A deep intronic mutation in FGB creates a consensus exonic splicing en- hancer motif that results in afibrinogenemia caused by aberrant mRNA splicing, which can be corrected in vitro with antisense oligonucleotide treatment. Hum. Mutat. 30: 221-227, 2009. 7. de Carli, M., D’Elios, M.M., Mariotti, S., Marcocci, C., Pinchera,
A., Ricci, M., Romagnani, S. and del Prete, G. Cytolytic T cells with Th1-like cytokine profile predominate in retroorbital lympho-cytic infiltrates of Graves’ ophthalmopathy. J. Clin. Endocrinol. Metab. 77: 1120-1124, 1993.
8. Gianoukakis, A.G., Martino, L.J., Horst, N., Cruikshank, W.W. and
Smith, T.J. Cytokine-induced lymphocyte chemoattraction from cultured human thyrocytes: evidence for interleukin-16 and regulated upon activation, normal T cell expressed, and secreted expression. Endocrinology 144: 2856-2864, 2003.
9. Gu, X.J., Cui, B., Zhao, Z.F., Chen, H.Y., Li, X.Y., Wang, S., Ning, G. and Zhao, Y.J. Association of the interleukin (IL)-16 gene poly-morphisms with Graves’ disease. Clin. Immunol. 127: 298-302, 2008.
10. Han, J., Son, G.H., Seong, J.Y. and Kim, K. GnRH pre-mRNA splicing: role of exonic splicing enhancer. Prog. Brain Res. 141: 209-219, 2002.
11. Krug, N., Cruikshank, W.W., Tschernig, T., Erpenbeck, V.J., Balke, K., Hohlfeld, J.M., Center, D.M. and Fabel, H. Interleukin 16 and T-cell chemoattractant activity in bronchoalveolar lavage 24 hours after allergen challenge in asthma. Am. J. Respir. Crit. Care Med. 162: 105-111, 2000.
12. Mathy, N.L., Scheuer, W., Lanzendorfer, M., Honold, K., Ambrosius, D., Norley, S. and Kurth, R. Interleukin-16 stimulates the expres- sion and production of pro-inflammatory cytokines by human mono- cytes. Immunology 100: 63-69, 2000.
13. Moser, B. and Willimann, K. Chemokines: role in inflammation and immune surveillance. Ann. Rheum. Dis. 63 (Suppl II): ii84-ii89, 2004.
14. Moser, B., Wolf, M., Walz, A. and Loetscher, P. Chemokines: mul- tiple levels of leukocyte migration control. Trends Immunol. 25: 75-84, 2004.
15. Pedro, A.B.B., Romaldini, J.H. and Takei, K. Changes of serum cytokines in hyperthyroid Graves’ disease patients at diagnosis and during methimazole treatment. Neuroimmunomodulation 18: 45-51, 2011.
16. Pozzoli, U. and Sironi, M. Silencers regulate both constitutive and alternative splicing events in mammals. Cell. Mol. Life Sci. 62: 1579-1604, 2005.
17. Pritchard, J., Tsui, S., Horst, N., Cruikshank, W.W. and Smith, T.J. Synovial fibroblasts from patients with rheumatoid arthritis, like fibroblasts from Graves’ disease, express high levels of IL-16 when treated with Igs against insulin-like growth factor-1 receptor. J. Immunol. 173: 3564-3569, 2004.
18. Uchimura, K., Itoh, M., Yamamoto, K., Imamura, S., Makino, M., Kato, T., Fujiwara, K. and Sawai, Y. The effects of CD40- and in-terleukin (IL-4)-activated CD23+ cells on the production of IL-10
by mononuclear cells in Graves’ disease: the role of CD8+ cells.
Clin. Exp. Immunol. 128: 308-312, 2002.
19. Wang, C.H., Wu, K.H., Yang, Y.L., Peng C.T., Tsai, F.J., Lin, D.T., Chiu, C.F., Lin, C.C. and Bau, D.T. Association between Ataxia Telangiectasia mutated gene polymorphisms and childhood leu-kemia in Taiwan. Chinese J. Physiol. 54: 413-418, 2011. 20. Wang, Z., Rolish, M.E., Yeo, G., Tung, V., Mawson, M. and Burge,
C.B. Systematic identification and analysis of exonic splicing silencers. Cell 119: 831-845, 2004.
21. Weetman, A.P. Graves’ disease. N. Engl. J. Med. 343: 1236-1248, 2000.