Electrochemical Behavior of the Li
+/Li Couple and Stability of Lithium
Deposits in Tri-1-butylmethylammonium
bis((trifluoromethyl)sulfonyl)imide Room Temperature Ionic Liquid
Po-Yu Chen* ( )
Faculty of Medicinal and Applied Chemistry, Kaohsiung Medical University, Kaohsiung City 807, Taiwan, R.O.C.
The electrochemical behavior of the Li+/Li couple was studied at polycrystalline tungsten, platinum, copper and aluminum electrodes in tri-1-butylmethylammonium bis((trifluoromethyl)sulfonyl)imide ionic liquid mixed with a little propylene carbonate at 30°C. Lithium cations were introduced into the ionic liquid by dissolution of lithium bis((trifluoromethyl)sulfonyl)imide which is highly soluble in ionic liquid. Propylene carbonate was used to reduce the viscosity of this ionic liquid in order to enhance the mass transfer and to additionally improve the stability of lithium deposits. At the tungsten and copper elec-trodes, the cyclic voltammetric behavior of a Li+/Li couple is a quasi-reversible reaction. At the platinum electrode, the behavior becomes very complicated because of the alloy formation. Coulombic efficiency was used to evaluate the stability of lithium deposits at each electrode. The aluminum electrode showed the best efficiency due to the formation of Li-Al alloy. However, lowest efficiency was obtained at the platinum electrode because of the low redox reversibility of the lithium in the Li-Pt alloy. The diffusion coefficient of lithium cation in this solution was 1.0± 0.1 ´ 10-7cm2s-1as determined by chronopotenti-ometry. The best coulombic efficiency obtained at the Al electrode is 97% but dropped to about 90% after 12 hours. The self-discharge current of the lithium deposits at the Al electrode was 0.4mA/cm2during the experimental period.
Keywords: Ionic liquid; Electrodeposition; Lithium; Electrochemistry;
bis((trifluoromethyl)sulfonyl)imide.
INTRODUCTION
Battery technology is a very important field in the chemical industry because mobile electronics cannot func-tion without batteries. Among the various batteries, the lithium metal and lithium ion batteries are most common because of their high cell voltage, high capacity and light weight. Although lithium metal batteries are not as “hot” as lithium ion batteries, there are still many studies1-13 focus-ing on this topic because they have the potential to provide higher capacity and higher output. Lower cycling effi-ciency is the main problem that urgently needs to be solved. Therefore, for secondary lithium batteries, much effort has been concentrated on improving their cycle life. The cycle life is often determined by the lithium cycling efficiency that is always controlled by the solvent, the anion of the lithium salt, the electrode materials and the morphology of lithium deposits. The ideal solvent should have a low
melt-ing point, acceptable conductivity, low volatility and wide enough electrochemical window. In addition, it should not seriously react with lithium deposits, and it can also sup-press the dendrite formation during the deposition of lith-ium.
According to these considerations, ionic liquid is a good candidate because it has almost all of the advantages including low melting temperature, low vapor pressure, good thermal and electrochemical stability and acceptable conductivity. Ionic liquid has been used as a novel solvent for electrodeposition,14,15extraction and organic synthe-sis.16There have been many studies of alkali metal ions car-ried out in ionic liquids,9,17-21,29,30even though there have been more experiments performed in aprotic molecular or-ganic solvents.7,8,21-28Several studies of alkali metal ions in aluminum chloride-alkyl substituted imidazolium chloride ionic liquids have been reported. The frequently used salts of alkyl substituted imidazolium chloride were
methylimidazolium chloride (EtMeImCl),9,17,18 1-methyl-3-propylimidazolium chloride (MePrImCl),19etc. In this classification of ionic liquids, a neutral ionic liquid buf-fered with an alkali metal chloride was used because only the neutral ionic liquid possesses an electrochemical win-dow wide enough for reduction of alkali metal ions. In addition, thionyl chloride (SOCl2) or hydrogen chloride (HCl) was required to improve the coulombic efficiency of the alkali metal redox couples. However, Osteryoung et al.20discovered that the ionic liquid buffered with bromide and iodide salts provides a better environment for reduction and oxidation of alkali metal ions so that SOCl2and HCl are not essential in this system. Recently, Kohl et al.21 re-ported that very stable sodium redox couple could be ob-tained in methanesulfonyl-aluminum chloride ionic liquid, and a coulombic efficiency of 97% was obtained at a plati-num electrode. They also investigated the possible interac-tion between the deposits and the solvent using electro-chemical quartz crystal microbalance (EQCM). In recent years, gel electrolytes based on ionic liquids or propylene carbonate have been reported and are employed as the me-dia for the investigation of Li+/Li couples and lithium ion batteries.10,31,32
The so-called solid electrolyte interfaces (SEI) formed on alkali metal deposits have been widely studied because such an interface plays a key role in the stability and revers-ibility of alkali metal deposits; in other words, it is one of the most important factors that decide the cycling effi-ciency of alkali metal couples. There are a number of re-ports corresponding to the investigation of the formation and composition of the SEI.1-3,6,7,11,13The components of this interface are influenced by the compositions of sol-vents, anions of the lithium salts and even environmental gas molecules and/or impurities in the solvents. Propylene carbonate-based solutions have been used for many elec-trochemical studies of lithium because they have proven to be able to form a SEI layer on a lithium metal surface.
More and more quaternary onium salts such as qua-ternary ammonium salts and quaqua-ternary phosphonium salts have been used to prepare ionic liquids in recent years.33,34 Many of these quaternary onium cations are difficultly re-ducible, so that more negative cathodic limits of electro-chemical windows of the ionic liquids can be obtained. However, these ionic liquids have higher melting points and viscosities, and only a few of the studies using these ionic liquids were involved with electrochemical applica-tions.34,35In this study, the electrochemical behavior of the
Li+/Li couple was investigated at polycrystalline W, Pt, Cu and Al disk electrodes by cyclic voltammetry, chrono-potentiometry and chronoamperometry in the tri-1-butyl-methylammonium bis((trifluoromethyl)sulfonyl)imide ionic liquid (Bu3MeN+Tf2N-) mixed with small amounts of propylene carbonate at room temperature. The stability of lithium deposits at each electrode was evaluated based on the deposition/stripping experiments (coulombic effi-ciency). According to the coulombic efficiency, the self-discharge current of lithium deposits can be determined. Chronopotentiometry was employed to obtain the diffusion coefficient of lithium ions in this solvent system and to ex-plore the reversibility of the lithium deposits. The factors that determine the possibility of Li+reduction and the sta-bility of Li deposits were discussed.
EXPERIMENTAL SECTION Synthesis of Ionic Liquid
The tri-1-butylmethyl ammonium chloride (Bu3MeN+Cl-) (Fluka) was recrystallized from ethyl acetate-acetonitrile mixtures at least three times. The lithium bis((trifluoro-methyl)sulfonyl)imide (Li+Tf2N-) (Aldrich, N-Lithiotri-fluoromethane-sulfoneimide, 97% or Lithium trifluoro-methanesulfonimide, 99.95%) was dried under vacuum at about 100°C for 1~2 days.
The tri-1-butyl methylammonium bis((trifluorometh-yl)sulfonyl)imide ionic liquid (Bu3MeN+Tf2N-) was pre-pared by mixing equal moles of Bu3MeN+Cl-and Li+Tf2N -in proper amounts of distilled water. This solution was stirred vigorously and refluxed under normal atmosphere at 80°C to assure that the reaction would complete. After the completion of the ion exchange reaction, oil-like droplets that were immiscible with water were produced. LiCl, which was formed during this ion exchange reaction, would dis-solve in water, and it has very low solubility in the ionic liq-uid. After the reaction finished, the lower layer in the flask was washed with distilled water in order to remove any res-idues of reactants and LiCl. Afterwards, the liquid was evacuated under 10-4torr at ~120°C for at least 1 day in or-der to remove moisture. Because Li+Tf2N-is very soluble in this ionic liquid, any excessive Li+Tf2N-could dissolve in the ionic liquid and it can be removed by bulk electrolysis at a mercury pool electrode. Other electrochemically active impurities in this ionic liquid can be destroyed during this process, too.
Apparatuses and Chemicals
All of the electrochemical studies were carried out in a glove box (Mbraun, UNI LAB-B) and the atmosphere was continuously circulated by an inert gas purifier. The quality of the atmosphere inside the box was monitored by a O2/H2O analyzer, and the quantities of both were kept un-der 1 ppm, respectively. Dry nitrogen was used for this glove box.
The electrochemical study was achieved by an EG&G Model 263A potentiostat/galvanostat controlled by EG&G Model 270 software. An electrochemical cell composed by a single compartment with three electrodes was used for all electrochemical experiments. An open cell was used in-stead of an air-tight cell. Thus, the electrolyte was exposed directly to the atmosphere inside the glove box. The work-ing electrodes were polycrystalline W (a tungsten wire sealed in a Pyrex glass tube, geometric area = 0.015 cm2), Pt (Bioanalytical Systems MF-2013, geometric area = 0.020 cm2), Cu (a copper wire sealed in a heat-shrinking Teflon tube, geometric area = 0.013 cm2) and Al (an alumi-num rod sealed in a heat-shrinking Teflon tube, geometric area = 0.317 cm2) disk electrodes. A clean silver wire (Alfa AESAR, 99.999%) immersed in the Bu3MeN+Tf2N-ionic liquid contained in a glass tube with a Vycor tip (Bioana-lytical Systems MF-2042) was employed as a quasi-refer-ence electrode. The ferrocene/ferrocenium couple (Fc/Fc+) was used as an internal standard, and all values of potential were reported with respect to the redox potential of the Fc/Fc+couple in this study. A coiled platinum wire dipped in Bu3MeN+Tf2N-ionic liquid in a glass tube that is sepa-rated from the bulk ionic liquid by a porosity E glass frit (ACE Glass) was used as the counter electrode. Li+is intro-duced by dissolution of Li+Tf2N-salt in the ionic liquid.
RESULTS AND DISCUSSION
The voltammetric behavior of Li+/Li couple
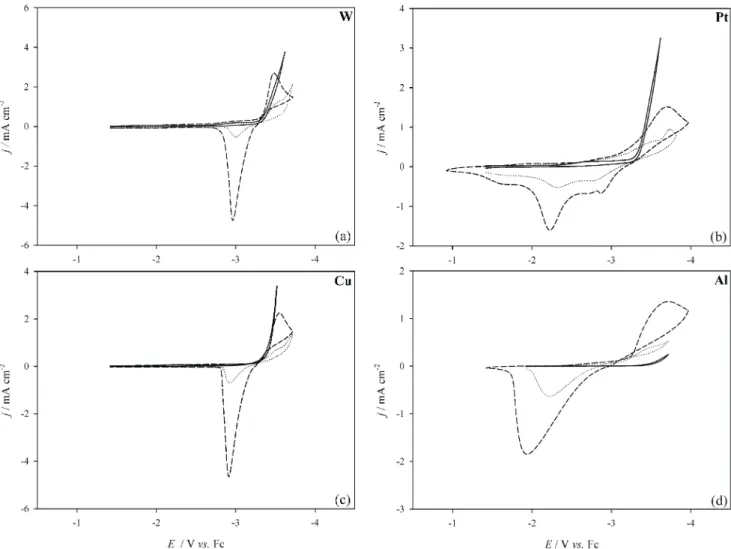
The cathodic limits of the electrochemical window of the ionic liquid and the voltammetric behavior of the Li+/Li couple at W, Pt, Cu and Al disk electrodes are presented in Fig. 1. The cathodic scans were started at -1.42 V (vs. Fc/Fc+) until complete reduction waves appeared. For W and Cu electrodes (Fig. 1(a) and (c)), the behavior of Li+/Li is similar to that of many other metal ions reported in ionic liquids; the reduction wave suddenly increases before the peak potential and is then followed with an fairly
symmet-ric stripping wave. Nucleation of lithium on W and Cu elec-trodes was indicated by the cross-over of current during the reverse scan. The peak separation of the Li+/Li couple in-creased with increasing potential scan rate indicating it is a quasi-reversible reaction at W and Cu electrodes. In addi-tion, the reduction waves of the Li+/Li couple at W and Cu electrodes are very close to or even beyond the cathodic limit of the IL before the addition of Li+Tf2N-. In fact, we always observed a negative shift of the cathodic limit upon the addition of lithium cations. Such a shift in the cathodic limit can not result from the combination of Li+ion and Bu3MeN+cations in ionic liquid because they have identi-cal charges. Therefore, some type of solid electrolyte inter-face (SEI) might have formed on the electrodeposited lith-ium surface and hindered the reduction of Bu3MeN+ cat-ions. Many reports1-3,6,7,11,13discussing the formation of SEI are available. This interface might only provide better permeability for lithium ions instead of the Bu3MeN+ions. The SEI might form from the reaction of Li and/or Li+with the ionic liquid and/or with the products produced from the decomposition of Bu3MeN+at the cathodic limit.
The peak currents of the Li+/Li couple are enormously enhanced by the addition of 10 wt% of propylene carbonate (PC) (dashed lines in Fig. 1) because a better mass transport was achieved by the huge decrease of viscosity resulting from the addition of PC. In addition, the cathodic limit was shifted to a much more negative value (not shown) than that when only Li+Tf2N-was added. This behavior may result from the formation on lithium deposits of a new type of SEI which suppressed the reduction of Bu3MeN+ more effi-ciently. The cathodic limit shifting may also indicate that the formation of the SEI is related to the quantities of lith-ium deposits because more lithlith-ium atoms were deposited on the electrode surface when the viscosity of the ionic liq-uid was decreased upon the addition of PC. The oxidation wave of the Li electrodeposits couple decreased in height and became more complicated in the ionic liquid contain-ing PC when the cathodic scan was reversed at the potential of cathodic limit, indicating that the SEI might have been destroyed at the cathodic limit (not shown).
The redox waves of Li+/Li at the Al electrode (Fig. 1(d)) were analogous to but broader than those observed at W or Cu electrodes. The nucleation current loop for the lithium deposition also exists. The oxidation wave of the Li electrodeposits at the Al substrate gives a single typical stripping wave. However, it is obvious that this oxidation process needs higher overpotential because the oxidation
wave occurred at more positive values than those observed at W and Cu electrodes. Several previous studies reported the formation of a Li-Al alloy during the reduction of Li+in various solvents,36-39and it is believed that the shift of the oxidation wave results from the formation of the Li-Al al-loy. Because the free energy of lithium in a Li-Al alloy is different from that in pure Li deposits, the shift of oxidation wave is expected. The peak currents of the Li+/Li redox couple at the Al electrode were enormously enhanced after the addition of PC.
Unlike the results obtained at W, Cu and Al elec-trodes, the voltammetric behavior of the Li+/Li couple at the Pt electrode is very complicated (Fig. 1(c)). The current of the reduction wave increased very slowly before the peak maximum was reached, indicating that the electron transfer rate between the Li+and the Pt substrate is very
slow. No nucleation cross-over of current was observed at the Pt substrate. Previous literature reports have described the under-potential deposition (UPD) of alkali metal ions at Pt electrodes,23and UPD might lead to the absence of the nucleation current loop at the Pt electrode. A single layer of Li may form through the UPD process at the Pt electrode before the bulk deposition of Li occurs. Thus, a nucleation behavior becomes obscure. Several oxidation waves in-stead of a single stripping wave of the Li+/Li couple were observed at the Pt substrate. Previous reports have dis-cussed the formation of a Li-Pt alloy during the reduction of Li+, and they showed the redox reversibility of lithium in a Li-Pt alloy was not good and that even a portion of a Li-Pt alloy formed at the electrode surface would not be stripped during the oxidation scan, resulting in low coulombic effi-ciency.12Thus, the smaller stripping wave occurring near
Fig. 1. The cyclic voltammograms of (¾¾), pure Bu3MeN+Tf2N-ionic liquid, (××××××××), a Li+/Li couple in ionic liquid and
(---), a Li+/Li couple in ionic liquid with 10 wt% of PC at W, Pt, Cu and Al disk electrodes at 30°C. Scan rate: 50
-2.9 V should be the stripping of the lithium deposit, and the main stripping wave observed near -2.3 V should be the oxidation of lithium in a Li-Pt alloy. The coulombic effi-ciency of the Li+/Li couple was very low at the Pt electrode because of the formation of the Li-Pt alloy. Thus, a Pt sub-strate was not used in the following experiments.
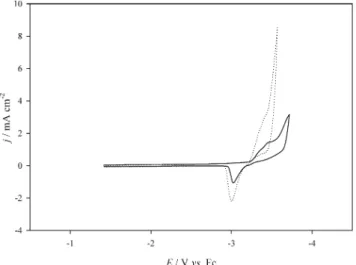
As aforementioned, addition of a little PC solvent can significantly reduce the viscosity of the ionic liquid and en-hance the Li redox currents. In order to understand the role that PC played in the system, toluene was added into the pure ionic liquid because it also can reduce the viscosity of the ionic liquid. Fig. 2 represents the voltammetric behav-ior of the Li+/Li couple in the ionic liquid before and after the addition of 10 wt% of toluene, respectively. This figure clearly shows that addition of toluene decreases the vis-cosity of the ionic liquid because the redox current is en-hanced. However, not only the current of Li+but also that of Bu3MeN+ increased because the reduction current at the cathodic limit apparently increased. This behavior is different from that shown in Fig. 1 where the reduction of Bu3MeN+was substantially suppressed after the addition of PC. It is supposed that PC not only enhanced the mass transfer but also induced the formation of some protective films that shift the cathodic limit to a more negative value. Many reports have discussed the film formation on lithium surfaces.1-3,5-7,11,13Most of them focus on the components of the films that form from the reaction of lithium metal and solvent molecules, anions or impurities. After the films have formed, the reaction between the lithium metal and
other species in the solvent can be suppressed. The en-hancement of cycling efficiency is usually the consequence. If the films only form after the appearance of Li deposits, it cannot explain why the reduction of Li+can occur at the cathodic limit of potential. A few reports have mentioned this point;7however, almost no cyclic voltammogram indi-cating the film formation has been shown.
In Fig. 3, the solid line represents the voltammogram of pure PC at the W electrode without any supporting elec-trolyte. Because of the high resistance, the curve was dis-torted and the cathodic potential limit was not apparent. It is believed that the cathodic current results from the reduc-tion of PC. Although some reports proposed that reducreduc-tion of PC was not observed,7,10several other reports observed that PC could be reduced cathodically.40-43As the dotted line shows in Fig. 3, the cyclic voltammogram became more normal after the addition of tetra-1-butylammonium hexafluorophosphate (Bu4N+PF6
-) as the supporting elec-trolyte as indicated by the rapid increase of current at the cathodic limit. However, we cannot verify whether the cathodic current only results from the reduction of Bu4N+ or from the reduction of PC. Based on the similar chemical structures of Bu4N+and Bu3MeN+and the results obtained from the Fig. 1 and 3, it is proposed that the reduction po-tentials of Bu4N+, Bu3MeN+, and PC are very similar. This result points out that the reduction of Li+ions actually oc-curs at the potential very close to or even beyond the reduc-tion potentials of Bu4N+, Bu3MeN+, and PC. The cyclic voltammograms of the Li+/Li couple in PC are shown in
Fig. 2. The cyclic voltammograms of a Li+/Li couple in
(¾¾), pure Bu3MeN+Tf2N-ionic liquid and in
(××××××××), same ionic liquid with 10 wt% of tolu-ene at W electrode at 30°C. Scan rate: 50 mV/s.
Fig. 3. The cyclic voltammograms of (¾¾), pure PC and (××××××××), pure PC containing Bu4N+PF6
- as
supporting electrolyte at W electrode at 30°C. Scan rate: 50 mV/s.
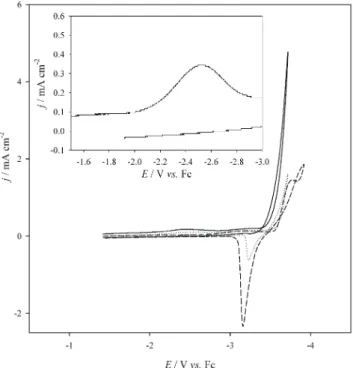
Fig. 4, in which the solution contained only 20 mM of Li+Tf2N-. The solid line represents the 1stcycle; no reaction current from the Li+/Li couple was observed. The redox current of the Li+/Li couple appeared in the 2ndcycle (the dotted line) and became more apparent in the 3rdcycle (the dashed line). Additionally, the cathodic limit of potential was shifted to a more negative value once the reduction of Li+was observed. Similar behavior is apparent in Fig. 1. From careful examination of Fig. 4, it can be found that there is a small reduction wave occurring between -2.0 and -3.0 V which is magnified in the inset of Fig. 4. If we hold the potential beyond this small reduction wave for about 30 seconds during the cathodic scan and then continue the scan to the reverse potential, the redox behavior of the Li+/Li couple can be observed during the 1stcycle (it is not shown here). The redox behavior of the Li+/Li couple can also be observed at the 1stcycle if more Li+Tf2N-(0.2 M) is added into the solution as is shown in Fig. 5. In a word, these phenomena indicate that film formation occurs not just after the bulk deposition of lithium and that this film can suppress many reduction reactions except for the re-duction of Li+. This film makes the reduction of Li+at the
potential more negative than the cathodic limit possible. In addition, the film formation is also controlled by the con-centration of Li+cations, and this indicates that the lithium cation should be one major component in this film. After bulk lithium is plated on the electrode surface, other films form due to the reaction between lithium deposits and PC because the cathodic limit was shifted to a more negative potential when propylene carbonate was used (comparing the results of Fig. 1 and those of Fig. 2). The 2ndsort of film provides better protection for lithium deposits and higher suppression of the reduction of solvent molecules and other species. Several reports have discussed the components and possible mechanism of the film formation produced from the reaction of Li and PC.2,3,6All the abovementioned observations support the results obtained by Ritchie et al.7 They believe that a trace of oxygen and water in PC offered the materials for the formation of the 1sttype SEI,
Li+cation was one component of this film and it explains why the concentration of Li+is important in the film forma-tion. Although no similar reduction wave shown in the in-set of Fig. 4 was observed in Fig. 1, a similar reaction might still occur with very small current because the mass transfer in the solution used to obtain Fig. 1 is not as good as that in PC solution. On the other hand, the negative shift of the cathodic limit of potential also could be observed when
Fig. 4. The cyclic voltammograms of a Li+/Li couple in
PC containing Bu4N+PF6
-as supporting
electro-lyte at W electrode at 30°C. Scan rate: 50 mV/s. (¾¾), 1stcycle, (××××××××), 2ndcycle and (---) 3rd
cycle. The inset showed the magnification of the potential range between -1.6 V and -3.0 V.
Fig. 5. The cyclic voltammograms of a Li+/Li couple in
the same solvent shown in Fig. 4 but a higher concentration of Li+was employed.
2 2 2 2 2 2 2 O Li e LiO O 2Li 2e Li O 2H O 2Li 2e 2LiOH H + -+ -+ -+ + ® + + ® + + ® +
pure Bu3MeN+Tf2N-ionic liquid containing enough Li+ was used (dotted lines in Fig. 1). It may indicate that the 1st type SEI still can form in ionic liquid by a similar mecha-nism as that mentioned above, which allows the reduction of Li+to take place at or even beyond the cathodic limit. The 2ndtype of SEI formed when PC was added into the ionic liquid. The latter one has better ability to suppress the reduction of Bu3MeN+cations because the cathodic limit is shifted to a much more negative potential.
The chronopotentiometric behavior of the Li+/Li cou-ple
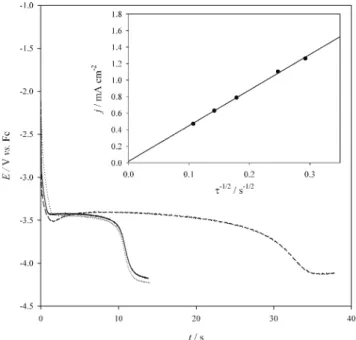
Chronopotentiometry was employed to study the Li+/ Li couple at W, Cu and Al electrodes, respectively, and the data are shown in Fig. 6. The potential required to maintain a constant current at each electrode was recorded. At W and Cu electrodes, the potential dropped suddenly from the rest potential to the value that the reaction at the electrode sur-face was thoroughly diffusion controlled. This value of po-tential remained for a period of time and then dropped rap-idly again to the cathodic limit of potential. At the Al the
electrode, the potential dropped rapidly from rest potential to about -3.5 V and then returned to a more positive value. This behavior indicates that overpotential is needed for the reduction of the Li+/Li couple at an Al electrode and this is coincident with the current cross-over observed in the cy-clic voltammogram shown in Fig. 1.
The diffusion coefficient of Li+was calculated by the Sand equation,44
wheret is called the transition time at which the concentra-tion of the electroactive species on the electrode surface drops to zero as marked by the rapid shift in electrode po-tential. Other terms in the Sand equation have their regular meanings. The diffusion coefficient of Li+, (1.0± 0.1) ´ 10-7cm2s-1, was obtained from the slope of the plot of j (= i/A) vs.t-1/2shown in the inset of Fig. 6. This value is higher than those of other single charged cations in the pure ionic liquid which all fall in 10-8order. This confirms that the presence of PC indeed decreases the viscosity of the ionic liquid with a great quantity.
Chronopotentiometry was also employed to estimate the stability of lithium metal plated on an electrode surface. According to the Sand equation, the transition time con-stant (it1/2
/CO *
) should be a fixed value with i or CO *
when the electrode reaction is not accompanied by the coupled homogeneous chemical reaction, adsorption or measure-ment artifacts.44If we keep the concentration of Li+ con-stant, the jt1/2
(j = i/A) should be a constant with j. Fig. 7 in-dicates that this is true at the Al electrode, and it is almost constant at W and Cu electrodes, respectively, within the current range that was applied. This behavior indicates that the deposited lithium metal is stable at these electrodes within this experimental time scale.
The coulombic efficiency of Li+/Li couple
Coulombic efficiency was utilized to evaluate the sta-bility of lithium electrodeposits. Although the results of chronopotentiometry showed that the lithium deposits were stable, coulombic efficiency can provide more accu-rate information about the long-term stability. The cou-lombic efficiency was obtained from double potential step experiments and it is defined as
Fig. 6. The potential-time plot of a Li+/Li couple obtained
from chronopotentiometry in Bu3MeN+Tf2N
-with 10 wt% of PC at (¾¾), W electrode (1.6 mA/cm2), (××××××××), Cu electrode (1.5 mA/cm2)
and (---) Al electrode (0.8 mA/cm2) at 30°C.
The value in parenthesis is the current density applied at each electrode. The inset shows the plot of j vs.t-1/2obtained from
chronopotenti-ometry at the Al electrode.
1 2 1 2 1 2 2 / / * O O / nFAD C i p t = O R Q Coulombic efficiency Q =
where QOis the total charges obtained during the step of ox-idation and QRis the total charges obtained during the step of reduction. If this ratio is unity, the lithium deposits are very stable. Actually, no solvent system can provide 100% coulombic efficiency till now. The typical chronoamper-ogram resulting from a double potential step experiment carried out at an Al electrode is shown in Fig. 8. During the cathodic step, the potential was held at the value where de-position of Li+at the electrode surface occurred for various periods of time and then stepped to -1.92 V where the oxi-dation of lithium deposits occurred until the current dropped to zero. The QOand QRwere obtained from the area under
the current-time curves corresponding to the cathodic and anodic steps, respectively.
The coulombic efficiencies obtained at W, Cu and Al electrodes are represented in Fig. 9. At each electrode, two deposition potentials were chosen for the cathodic step. This figure shows that less negative deposition potential leads to better coulombic efficiency. For the data obtained at a more positive deposition potential at W and Cu elec-trodes, the efficiencies were about 90% at the beginning and then they dropped to about 80%. For the data obtained
Fig. 7. The plot of jt1/2vs. j obtained from
chrono-potentiometry in the same solution as in Fig. 6 at (l), W electrode, (d), Cu electrode and (t), Al electrode at 30°C.
Fig. 8. The current density-time plot obtained from double potential steps experiment in the same solution as in Fig. 6 at Al electrode at 30°C.
Fig. 9. The coulombic efficiency of the Li+/Li couple
obtained from double potential steps in the same solution as in Fig. 6 at W, Cu and Al elec-trodes at 30°C. The deposition potentials used in the reduction steps are shown in each plot.
at a more negative deposition potential, the efficiencies dropped more rapidly with time. At the Al electrode, this efficiency remained above 95% at a more positive deposi-tion potential with a best value of 97%. It dropped to 70% when more negative deposition potential was employed. At higher deposition overpotential, the formation of lithium dendrite might result in poorer coulombic efficiency. In these cases, the deposition currents gradually increase with time because the formation of lithium dendrite during the cathodic deposition continuously increases the electrode surface area. The lithium dendrite, which is the so-called “dead lithium”,4could not be stripped effectively during the oxidation step and led to low coulombic efficiency. The higher coulombic efficiency obtained at the Al electrodes can be attributed to the formation of Li-Al alloy. Because the Li in Li-Al alloy is more stable and has more difficulty reacting with other species in the electrolyte system, higher coulombic efficiency can be obtained. As can be seen in Fig. 1(d), the oxidation wave occurred at the Al electrode shifted to a more positive potential with respect to those ob-tained at W and Cu electrodes, indicating that the Li in the Li-Al alloy was more difficult to oxidize.
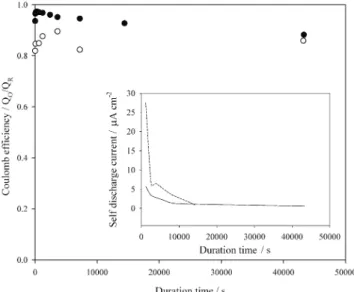
We are interested in how stable the lithium deposit is at open-circuit potential and how large the self-discharge current is. The coulombic efficiency obtained by chrono-amperometry at the Al electrode was used for this evalua-tion because of its high coulombic efficiency. Lithium was deposited at a constant potential for a period of time that ensured the same charge density had been passed through the electrode. This system was held at open-circuit for vari-ous time periods ranging from 1200 s to 12 h, and then an oxidation potential was applied to strip the lithium deposits until the oxidation current dropped to zero. The results from two deposition potentials are shown in Fig. 10. For the data obtained at the more positive deposition potential, the coulombic efficiency was above 90% within 12 h. The columbic efficiency fluctuated more seriously and re-mained above 80% for the data obtained at the more nega-tive deposition potential. Again, it is believed that the lower coulombic efficiency obtained at the more negative deposition potential was a result of the formation of lithium dendrites. The self-discharge current is shown in the inset of Fig. 10, and the effective rate of self-discharge of lithium in this solvent system calculated from the 12 h open-circuit test is 0.4mA/cm2for the data obtained at a lower deposi-tion potential and 1.2 mA/cm2for the data obtained at a higher deposition potential. From Fig. 10, it was also found
that most of the charge loss occurred in the initial stage of the open-circuit period.
CONCLUSION
Li+Tf2N-salt has very high solubility in Bu3MeN+Tf2N -ionic liquid. In this -ionic liquid, Li+can be reduced to its metal state at W, Pt, Cu and Al electrodes. At a Pt electrode, the very low coulombic efficiency results from the poor re-versibility of Li in the Li-Pt alloy that was formed during the electrodeposition of lithium. On the other hand, the highest coulombic efficiency obtained at an Al electrode was also attributed to the alloy formation. However, the lithium in the Li-Al alloy still has good reversibility. In ad-dition, the Li-Al alloy provided higher resistance to the at-tack of other species in the solvent system and resulted in the highest coulombic efficiency. The addition of small amounts of propylene carbonate (PC) enormously decreased the viscosity so that mass transfer becomes more efficient. The products generated from the reduction of oxygen, trace water, or Bu3MeN+cations in the solvent system might re-act with Li+and form protection layers that allow the bulk
Fig. 10. The coulombic efficiency of the Li+/Li couple
obtained from double potential steps in the same solution as in Fig. 6 at an Al electrode at 30°C. The deposition potentials used in the re-duction steps were (l), -2.97 V and (d), -3.40 V (vs. Fc/Fc+), respectively. The inset shows
the change of self-discharge current with time for deposition potential (¾¾), -2.97 V and (××××××××), -3.40 V.
deposition of Li to occur at the potential that is close to or even beyond the cathodic limit of the electrochemical win-dow. PC molecules might react with Li deposits in forming an additional protection layer.
ACKNOWLEDGEMENTS
This research was supported by the National Science Council of the Republic of China, Taiwan, under Grant NSC 93-2113-M-037-001. The author wants to thank the Kaohsiung Medical University for great support and Prof. I-Wen Sun at National Cheng Kung University, Taiwan, for discussions.
Received September 2, 2005.
REFERENCES
1. Koch, V. R.; Young, J. H. J. Electrochem. Soc. 1978, 125, 1371.
2. Geronov, Y.; Schwager, F.; Muller, R. H. ibid 1982, 129, 1422.
3. Aurbach, D.; Daroux, M. L.; Faguy, P. W.; Yeager, E. ibid
1987, 134, 1611.
4. Yoshimatsu, I.; Hirai, T.; Yamaki, J.-I. ibid 1988, 135, 2422. 5. Odziemkowski, M.; Irish, D. E. ibid 1993, 140, 1546. 6. Aurbach, D.; Ein-Ely, Y.; Zaban, A. ibid 1994, 141, L1. 7. Pletcher, D.; Rohan, J. F.; Ritchie, A. G. Electrochim. Acta
1994, 39, 1369.
8. Pletcher, D.; Rohan, J. F.; Ritchie, A. G. ibid 1994, 39, 2015. 9. Fuller, J.; Carlin, R. T.; Osteryoung, R. A. J. Electrochem.
Soc. 1996, 143, L145.
10. Christie, A. M.; Vincent, C. A. J. Appli. Electrochem. 1996,
26, 255.
11. Naoi, K.; Mori, M.; Naruoka, Y.; Lamanna, W. M.; Atanasoski, R. J. Electrochem. Soc. 1999, 146, 462. 12. Park, S. H.; Winnick, J.; Kohl, P. A. ibid 2002, 149, A1196. 13. Mogi, R.; Inaba, M.; Jeong, S.-K.; Iriyama, Y.; Abe, T.;
Ogumi, Z. ibid 2002, 149, A1578.
14. (a) Endres, F. ChemPhysChem 2002, 3, 144. (b) El Abedin, S. Z.; Endres, F. ChemPhysChem 2006, 7, 58.
15. Yang, M.-H.; Sun, I.-W. J. Chin. Chem. Soc. 2004, 51, 253. 16. (a) Stafford, G. R.; Hussey, C. L.; Alkire, R. C. In Advances
in Electrochemical Science and Engineering; Kolb, D. M.,
Eds.; Wiley-VCH, 2001; Vol 7, p 275. (b) Welton, T. Chem.
Rev. 1999, 99, 2071. (c) Wei, G.-T.; Chen, J.-C.; Yang, Z. J. Chin. Chem. Soc. 2003, 50, 1123. (d) Sun, I.-W.; Wu, S.-Y.;
Su, C.-H.; Shu, Y.-L.; Wu, P.-L. J. Chin. Chem. Soc. 2004,
51, 367. (e) Zhang, X.; Fan, X.; Wang, J.; Li, Y. J. Chin. Chem. Soc. 2004, 51, 1339. (f) Hou, R.-S.; Wang, H.-M.;
Huang, H.-Y.; Chen, L.-C. J. Chin. Chem. Soc. 2004, 51, 1417.
17. Fuller, J.; Osteryoung, R. A.; Carlin, R. T. J. Electrochem.
Soc. 1995, 142, 3632.
18. Gray, G. E.; Kohl, P. A.; Winnick, J. ibid 1995, 142, 3636. 19. Gray, G. E.; Winnick, J.; Kohl, P. A. ibid 1996, 143, 3820. 20. Koronaios, P.; Osteryoung, R. A. ibid 2001, 148, E483. 21. Park, S. H.; Winnick, J.; Kohl, P. A. ibid 2001, 148, A346. 22. Eroadhead, J.; Elving, P. J. Anal. Chem. 1969, 41, 1814. 23. Fried, I.; Barak, H. J. Electroanal. Chem. 1971, 30, 279. 24. Diggle, J. W.; Parker, A. J.; Owensby, D. A. Aust. J. Chem.
1975, 28, 237.
25. Jorné, J.; Tobias, C. W. J. Appli. Electrochem. 1975, 5, 279. 26. Baranski, A. S.; Drogowska, M. A.; Fawcett, W. R. J.
Electroanal. Chem. 1986, 215, 237.
27. Lu, W.; Baranski, A. S. ibid 1992, 335, 105.
28. Moshkovich, M.; Gofer, Y.; Aurbach, D. J. Electrochem.
Soc. 2001, 148, E155.
29. Scordilis-Kelley, C.; Fuller, J.; Carlin, R. T.; Wilkes, J. S.
ibid 1992, 139, 694.
30. Boxall, D. L.; Osteryoung, R. A. ibid 2002, 149, E185. 31. Sutto, T. E.; De Long, H. C.; Trulove, P. C. Z. Naturforsch. A
2002, 57, 839.
32. Nakagawa, H.; Izuchi, S.; Kuwana, K.; Nukuda, T.; Aihara, Y. J. Electrochem. Soc. 2003, 150, A695.
33. Sun, J.; Forsyth, M.; MacFarlane, D. R. J. Phys. Chem. B
1998, 102, 8858.
34. Xu, K.; Ding, M. S.; Jow, T. R. J. Electrochem. Soc. 2001,
148, A267.
35. Quinn, B. M.; Ding, Z.; Moulton, R.; Bard, A. J. Langmuir
2002, 18, 1734.
36. Baranski, A. S.; Fawcett, W. R. J. Electrochem. Soc. 1982,
129, 901.
37. Geronov, Y.; Zlatilova, P.; Staikov, G. Electrochim. Acta
1984, 29, 551.
38. Biallozor, S.; Lieder, M. J. Electrochem. Soc. 1993, 140, 2537.
39. Hamon, Y.; Brousse, T.; Jousse, F.; Topart, P.; Buvat, P.; Schleich, D. M. J. Power Sources 2001, 97-98, 185. 40. Dey, A. N.; Sullivan, P. B. J. Electrochem. Soc. 1970, 117,
222.
41. Hill, I. R.; Irish, D. E.; Atkinson, G. F. Langmuir 1986, 2, 752.
42. Aurbach, D.; Gottlieb, H. Electrochim. Acta 1989, 34, 141. 43. Campbell, S. A.; Bowes, C.; McMillan, R. S. J. Electroanal.
Chem. 1990, 284 195.
44. Bard, A. J.; Faulkner, L. R. Electrochemical Methods:
Fun-damentals and Applications; John Wiley & Sons: New York,