Structural evolution and optical properties of TiO 2 thin films prepared by thermal
oxidation of sputtered Ti films
Chu-Chi Ting, San-Yuan Chen, and Dean-Mo Liu
Citation: Journal of Applied Physics 88, 4628 (2000); doi: 10.1063/1.1309039 View online: http://dx.doi.org/10.1063/1.1309039
View Table of Contents: http://scitation.aip.org/content/aip/journal/jap/88/8?ver=pdfcov
Published by the AIP Publishing
Articles you may be interested in
Electrical and optical properties of Nb-doped TiO 2 films deposited by dc magnetron sputtering using slightly reduced Nb-doped TiO 2 x ceramic targets
J. Vac. Sci. Technol. A 28, 851 (2010); 10.1116/1.3358153
Structural, electrical, optical, and photoelectrochemical properties of thin titanium oxinitride films ( Ti O 2 2 x N x with 0 x 1 )
J. Vac. Sci. Technol. A 24, 2199 (2006); 10.1116/1.2362740
Optical properties of TiO 2 thin films estimated by photothermal deflection spectroscopy
Rev. Sci. Instrum. 74, 863 (2003); 10.1063/1.1517149
Nonlinear optical absorption in undoped and cerium-doped BaTiO 3 thin films using Z -scan technique
Appl. Phys. Lett. 76, 1003 (2000); 10.1063/1.125920
TiO 2 electrochromic thin films by reactive direct current magnetron sputtering
J. Vac. Sci. Technol. A 15, 2673 (1997); 10.1116/1.580941
Structural evolution and optical properties of TiO
2thin films prepared
by thermal oxidation of sputtered Ti films
Chu-Chi Ting and San-Yuan ChenDepartment of Materials Science and Engineering, National Chiao-Tung University, Hsinchu, Taiwan 300, Republic of China
Dean-Mo Liu
Department of Metals and Materials Engineering, The University of British Columbia, #309-6350 Stores Road, Vancouver, British Columbia V6T 1Z4, Canada
共Received 8 July 1999; accepted for publication 13 July 2000兲
A dense rutile TiO2thin film was synthesized by the thermal oxidation of a sputtered titanium metal
film in ambient air. The effects on optical properties of TiO2 films of the crystal structure and
microstructural evolution at various oxidation temperatures were investigated. The Ti films transformed into single-phase rutile TiO2 at temperatures ⭓ 550 °C without going through an anatase-to-rutile transformation. Instead, an additional crystalline Ti2O phase was detected at 550 °C only. An increase in the oxidation temperatures ranging between 700 and 900 °C led to an increase in both the refractive index and absorption coefficient, but a decrease in the band gap energy (Eg). According to the coherent potential approximation model, the band gap evolution of the oxidized films was primarily attributed to the electronic disorder due to oxygen deficiency at a higher oxidation temperature rather than the presence of an amorphous component in the prepared films. © 2000 American Institute of Physics.关S0021-8979共00兲07920-2兴
I. INTRODUCTION
Titanium dioxide has been extensively studied in recent decades.1–3 Its remarkable optical and electronic properties have received considerable attention for optoelectronic appli-cations. Several techniques including chemical vapor depo-sition, spray pyrolysis, sol–gel coating, and rf magnetron sputtering have been developed for TiO2 thin films
fabrica-tions. The TiO2films prepared from these techniques exhibit
a wide variety of structures and optical properties.4–8 Three crystallographic modifications occur in TiO2: brookite, anatase, and rutile. The former two modifications are thermodynamically unstable, while the latter is stable. The rutile phase has a greater density (⫽4.25 g/cm3) and refractive index 共n⫽2.75 at ⫽550 nm兲 than the anatase phase共⫽3.89 g/cm3and n⫽2.54 at ⫽550 nm兲. Generally, TiO2 films were deposited by a reactive rf magnetron
sput-tering with controlled partial pressures of Ar and O2. Prior to
a postdeposition annealing, the as-deposited TiO2film exhib-its an amorphous structure. However, it transforms into a mixture of anatase and rutile phases at 700–900 °C anneal-ing, a temperature regime essential for the anatase–rutile transformation to occur.9A higher annealing temperature is normally required to achieve single-phase rutile.10–12
The optical properties of TiO2thin films have been ex-tensively investigated.13–16 A postdeposition annealing of TiO2 films leads to densification of the deposited layers, ac-companied by a microstructural coarsening 共i.e., grain growth and phase transformation兲. Therefore, a decrease in optical transmittance and an increase in refractive index of the TiO2 thin films are frequently observed as annealed at
higher temperatures.13,16In addition to the optical properties, several attempts 共e.g., by doping兲 have been employed to
reduce the band energy of TiO2 to a level allowing a better
quantum yield upon photon–electron conversions.17,18 A very simple method has been employed by means of a direct exposure of Ti metal film to thermal oxidation for the fabrication of TiO2 film in this study. The sputtered Ti film was easily transformed to single rutile phase at temperatures as low as 550 °C in air, without going through an anatase-to-rutile phase transformation. Therefore, optical properties such as transmittance (T%), refractive index共n兲, absorption coefficient 共␣兲, and optical band gap (Eg) of the resulting
TiO2 films were systematically examined in terms of the
structural evolution of the sputtered Ti films after high-temperature oxidation at various high-temperatures.
II. EXPERIMENTAL PROCEDURE
Titanium films were prepared using a dc magnetron sputtering system having a 30 dm3cylindrical stainless-steel chamber. The target was a titanium disk共purity 99.6%兲. The titanium was deposited at a constant dc power of 50 W onto a quartz substrate under a background pressure of 5 ⫻10⫺6Torr. A target–substrate distance was kept at a
con-stant of 70 mm. During this operation, an ultrahigh purity 共99.999%兲 Ar gas was used. Under a sputtering pressure of 8 mTorr, the sputtering time was 15 min and the substrate was maintained at room temperature. Prior to each experiment, the target was presputtered in an argon atmosphere共99.999% purity兲 for 8 min to remove surface oxides on the target. The as-deposited Ti films 共a thickness of ⬃170 nm兲 were sub-jected to postdeposition annealing at temperatures ranging between 400 and 1000 °C for 1 h in air.
An UV–visible spectrophotometer 共Hitachi, UV-3410兲 was used to characterize the optical properties of the
result-4628
0021-8979/2000/88(8)/4628/6/$17.00 © 2000 American Institute of Physics
ing TiO2thin films. the crystal structure was determined by
x-ray diffraction 共XRD兲 共MAC Science, M18X兲. Scanning electron microscopy 共Hitachi, S4000兲 was used for micro-structural examination. The thickness of Ti film and the re-sulting TiO2films was measured by a surface profiler共Sloan,
Dektak3ST兲. Following annealing, the stoichiometry of the films was performed by a Rutherford backscattering spec-troscopy 共RBS兲. The resistivity of the TiO2 films was
ob-tained from the current–voltage measurements of the Pt–TiO2–Pt structures with a HP4156B semiconductor
pa-rameter analyzer.
The volume fraction of amorphous ( fA) and rutile ( fR)
phases in the TiO2 films was determined according to the
method described by DeLoach et al.19 Briefly, the volume fraction of one component, rutile, in an uniform mixture is related to the integrated intensity of a specific reflection, I(110). The selection of a ‘‘standard’’ pure rutile film has to be strictly limited to the one with an identical preferred ori-entation as the film state to be analyzed. In this case, the films annealed at 1000 °C were found to be entirely of the rutile phase, which was used as the standard rutile film for further determination of the rutile volume fraction of TiO2
films under different oxidation conditions. The fR was
de-fined as关I(110)/IS(110)兴 for other film states, where IS(110) is
the integrated intensity of the standard rutile film. Once the fR was determined, the volume fraction for the amorphous
phase ( fA) equaled 1⫺ fR.
III. RESULTS AND DISCUSSION A. Crystal structure
Figure 1 shows the XRD patterns of the Ti films oxi-dized in air for 1 h at various temperatures. When the tem-perature was increased from 400 to 500 °C, a shift to the low angle of the Ti 共002兲 peak was clearly observed. This pro-gressively low-angle shift indicated an enlargement of the lattice volume via the incorporation of oxygen atoms from ambient air. Until annealed at 700 °C, a single rutile phase appeared. The XRD patterns reveal two interesting features. The formation of a single rutile phase TiO2at 700 °C, which
is several hundred degrees lower 共generally near or greater than 900 °C兲 than formations synthesized from other methods.10,11,16 The other feature is the appearance of an amorphous phase. As evidenced from XRD patterns, all peaks presented lower intensities at 700 °C, implying the co-existence of amorphous titanium oxide with crystalline rutile. A further increase to 1000 °C resulted in an increase in diffraction intensity with an associated decrease in the amor-phous background of the XRD patterns, indicating an im-proved crystallinity of the films.
Notably, anatase TiO2 was never detected in this
inves-tigation, especially when subjected to the temperature range, 700–1000 °C,共where the anatase-to-rutile phase transforma-tion would occur兲.10,11,13 A possible explanation is the for-mation of significant quantity of oxygen vacancies in the oxidized film, known as the Mageli phase, which is known to markedly accelerate the anatase-to-rutile transformation.20 However, this explanation appears unconvincing, simply be-cause traces of anatase TiO2 are undetectable. To further
elucidate the phase evolution, the Ti film was annealed at 550 °C for various time periods. Figure 2 indicates that, again, traces of anatase TiO2 were undetected. Instead, the
XRD pattern displays a mixture of rutile TiO2 and Ti2O
phases at 4 h annealing. Following further annealing, the Ti2O phase is thermodynamically unstable and transformed
to rutile structure. According to a study by Padma et al.21 layered structures of several Ti–O intermediate oxides are generated from the surface to the interior of the film. How-ever, other oxides22 such as Ti3O5, Ti2O3, and TiO were undetected. In Fig. 2, an appreciable quantity of the amor-phous phase was observed in the XRD patterns when an-nealed at 550 °C for 4 h. This amorphous phase was also observed at higher temperatures 共Fig. 1兲. Suhail et al.13 re-ported a similar phenomenon in TiO2 films prepared via dc
reactive magnetron sputtering.
The RBS analysis of the stoichiometry of the films, an-nealed at 700–900 °C, revealed an O/Ti atomic ratio of 2. It was strongly believed that oxygen vacancies may also de-velop, but such a relatively small concentration was probably beyond the resolution, approximately 0.5%, of RBS analysis.
FIG. 1. X-ray diffraction patterns of Ti film and Ti films oxidized in air at different temperatures.
FIG. 2. X-ray diffraction patterns for Ti films following oxidation at 550 °C for various time periods.
4629
J. Appl. Phys., Vol. 88, No. 8, 15 October 2000 Ting, Chen, and Liu
This implies that the amorphous phase may have an O/Ti ratio relatively close to the crystalline 共rutile TiO2兲 phase.
This finding seems unexplainable as, in the presence of an appreciable amount of suboxide layers, an overall O/Ti ratio must be substantially smaller than 2. Therefore, one possibil-ity is a significant shortening of the oxidation time to reach a near-stiochoimetric ratio under the experimental control.
A study by Rogers et al.23 verified that the TiO2phase
growth rate heavily depends on temperature. According to this four-layer model, it is possible to estimate the thickness of the TiO2 layer 共the first layer adjacent to the oxygen
at-mosphere兲 upon thermal oxidation in our films. Based on oxygen mass balance and Fick’s diffusion law, the change in the layer thickness共h兲 of TiO2on oxidation, at time t, can be formulated as
dh dt⫽
AD1/2
共t1/2兲2共1⫺W兲, 共1兲
where D is the effective oxygen diffusion coefficient, W is the mass fraction of oxygen, and A is the surface area ex-posed to oxygen.
Following rearrangement and integration, the thickness 共h兲 can be estimated by
h⫽ A共Dt兲
1/2
2共1⫺W兲. 共2兲
Equation 共2兲 is a parabolic expression representing the growth of the TiO2layer upon oxidation, and it is assumed
this relationship is valid for the current system where the oxygen partial pressure is 0.2 atm. Following a substituting of the appropriate values 共A⫽1 cm2, W⫽0.36, D which is estimated to be the order of 10⫺12cm2/s at 700 °C, and t ⫽3600 s兲 into Eq. 共2兲, the calculated h is 468 nm, 共which is considerably thicker than the sputtered Ti film兲. In fact, Rog-ers et al.23suggested that the diffusion coefficient D should be greater than the estimated value, (10⫺12cm2/s), at 700 °C. This finding implies that a thickness greater than 468 nm is expected. Furthermore, a preferential path for the oxygen diffusion along the grain boundary 共or through defect struc-tures in the amorphous phase兲 of the polycrystalline TiO2
film should also increase the oxidation rate. Therefore, we can infer that the Ti film was completely converted to a near-stoichiometric TiO2film at 700 °C共and above兲 within 1
h under ambient oxygen partial pressure. This may be the major reason for the absence of other oxides. The films
oxi-dized at 550 °C were essentially oxygen nonstoichiometric and associated with the formation of a sufficient quantity of oxygen vacancies.
For a low-temperature oxidation, a longer period is re-quired for the transformation of Ti to TiO2 as a result of
slower oxygen diffusion kinetics,23as evidenced by the pres-ence of a crystalline Ti2O in Fig. 2. Further oxidation at
higher temperatures promotes crystallization of the amor-phous phase, resulting in an increase in both the quantity ( fR) and crystallinity共represented by a decreased full width
at half maximum, FWHM兲 of the rutile phase 共Table I兲. Table II lists the lattice parameters of the oxidized films calculated for different temperatures. The lattice parameters of single-crystal rutile TiO2 are also tabulated. Obviously,
the lattice constants of the rutile TiO2 films increased with
temperature and tended towards the single-crystal values, which corresponds to the findings in Table I. This seems consistent with previous XRD analysis 共Fig. 1兲. The crystal structure of the oxidized films tends towards that of single-crystal rutile with increasing temperature, which further sug-gests a better arrangement of O and Ti atoms in the rutile crystals.
B. Film morphology
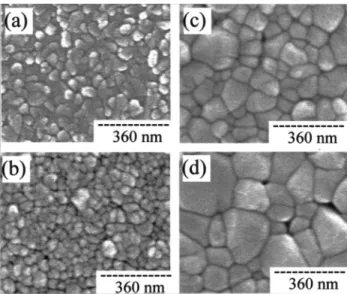
Figure 3 illustrates the microstructural evolution of the films oxidized at different temperatures. The average grain size of the Ti film presented in Fig. 3共a兲 is approximately 60 nm prior to oxidation. As the temperature was raised to 700 °C, the TiO2 film did not significantly alter the grain
size, which has an average size of approximately 58 nm关Fig. 3共b兲兴. However, the grain size rapidly increases to ⬃100 nm at 800 °C and to ⬃155 nm at 900 °C 关Figs. 3共c兲 and 3共d兲兴. The microstructure of the films oxidized at 700 °C is rela-tively homogeneous in comparison to films oxidized at 800 and 900 °C 共where some larger grains can be seen兲. This finding suggests that these films are essentially inhomoge-neous and, therefore, a higher surface roughness can be ex-pected. With increasing temperature, some small voids are present and enlarge. The presence of these small voids within the film structure provides alternative but direct con-duits for the access of oxygen molecules flowing inward from the ambient environment, supporting the hypothesis of an increasing oxidation rate as discussed in the previous section.
TABLE I. Evolution of phase composition共fRand fA兲 and FWHM at 共110兲
peak of the TiO2films prepared at different oxidation temperatures for 1 h.
Temperature 共°C兲 fR fA Diffraction angle (2) at rutile共110兲 peak FWHM共deg.兲 of rutile共110兲 peak 700 86.6 13.4 27.453 0.2358 800 89.5 10.5 27.451 0.1906 900 90.5 9.5 27.447 0.1856 1000a 100 0 27.421 0.1716
aThe film oxidized at 1000 °C under ambient air presented an entire or
predominant rutile phase and was applied as a standard film for the deter-mination of phase composition in other oxidized films.
TABLE II. Lattice parameters共a and c兲 of the rutile TiO2films oxidized at
different temperatures, with the parameters of bulk single-crystal rutile TiO2. Temperature 共°C兲 a(Å) c(Å) 700 4.5863 2.9560 900 4.5892 2.9561 1000a 4.5925 2.9586 Single crystal 4.5933 2.9592
aAt 1000 °C, the optical transmittance of the film is too weak and a further
analysis of optical properties cannot be accurately determined by Swanep-oel’s method.
C. Optical properties
Figure 4 shows the spectra of optical transmittance of the TiO2films annealed at different temperatures. The
poor-est transmittance, especially in the visible region, occurs at 550 °C/4 h, suggesting the presence of a sufficient amount of oxygen vacancies that have significantly absorbed the inci-dent light.24,25This finding seems consistent with the XRD patterns illustrated in Fig. 2, indicating that the film follow-ing a 550 °C/4 h oxidation is oxygen deficient. The optical transmittance can be significantly improved while increasing the oxidation temperature to 700 °C. However, it decreases at 800 and 900 °C. In this case, the optical transmittance is also accompanied by an appreciable blueshift of the spectrum in the lower wavelength region. Suhail et al.13and other related reports attributed共albeit not unambiguously兲 these results to several possibilities, primarily anatase–rutile transformation, films densification, and the partial reduction of TiO2films at high temperatures. However, since such a phase transforma-tion was undetected between 700 and 900 °C, an enhanced
crystallinity (amorphous→crystalline) of the rutile phase with increasing temperature may be one of the major causes under current investigation.
Additionally, since the enthalpy (⌬Hs) of oxygen
va-cancy formation (ns) in TiO2is endothermic, 26
TiO2⫹⌬Hs→TiO2⫺x 共3兲
the population of the vacancy can be enhanced with increas-ing temperature as
ns⫽Nsexp共⫺⌬Hs/2kT兲, 共4兲
where Ns is the maximum number of sites per m3 to form
Schottky defects, k the Boltzmann constant (1.38 ⫻10⫺23J/K), and T the absolute temperature. By
substitut-ing ⌬Hs⫽5⫻10⫺19J, we obtain ns/Ns⫽4.6⫻10⫺8 at
700 °C and 6.6⫻10⫺7at 900 °C, over an order of magnitude greater in concentration than that at 700 °C. The actual popu-lation of the oxygen vacancies can be higher than the calcu-lated values due to the incorporation of impurities originated from both target materials and environment; however, it is difficult to quantify precisely. An earlier study by Blumen-thal et al.27 revealed that an oxygen deficiency can be ex-tended to TiO2⫺x with x⫽0.01 共a value relatively close to the limit of maximum resolution of the RBS analysis兲 via annealing TiO2 between 900 and 1000 °C. When this is ap-plied to our films, the concentration of oxygen defect will be 3.19⫻1014per m3, much greater than the above calculation. Therefore, we believe that the oxygen vacancy should play a role in the observed spectra. The influence of microstructural coarsening on light scattering can be ignored as the transmit-tance displayed a similar trend in the longer wavelength re-gion as observed in the short wavelength rere-gion. Obviously, an appreciable blueshift and the decrease of the transmittance maximum in the low wavelength region at 900 °C suggest the presence of an appreciable quantity of oxygen defects,24,25 which is qualitatively consistent with that de-scribed in Eq. 共4兲. In addition, the resistivity of the TiO2
films postannealed at 900 °C for 1 h increased from 2⫻109 to 1⫻1010⍀ cm under 0.2 atm oxygen 共air兲 ambient and 1 atm oxygen ambient, respectively. These values are much lower than the resistivity of single-crystal rutile 共having a value of⬃1020⍀ cm at room temperature28兲, suggesting that the increased electrical conductivity of the prepared TiO2
films is due to electronic disorder caused by the oxygen nonstoichiometry.29–32 Since the oxygen vacancies can be compensated by postannealing in oxygen ambient,33,34 the resistivity of the TiO2films can increase under a higher
oxy-gen gas pressure. Therefore, it is strongly believed that there really exists an appreciable quantity of oxygen vacancies in the TiO2film annealed at 900 °C/1 h in air.
Figures 5共a兲 and 5共b兲 illustrate the refractive index 共n兲 and absorption coefficient 共␣兲 共as a function of wavelength兲 of the films oxidized at different temperatures, which were derived from the transmittance spectra using Swanepoel’s method.35 The increase in both n and ␣ of the films with raising annealing temperature共which is consistent with pre-vious investigations11,13,16兲 was considered as a result of the increases in compactness, crystallinity and oxygen defects of the rutile TiO2 films.
FIG. 3. Microstructural evolution of共a兲 as-deposited Ti film, and following oxidation at共b兲 700 °C, 共c兲 800 °C, and 共d兲 900 °C.
FIG. 4. Optical transmittance (T%) of the TiO2films, prepared by oxidizing at different temperatures, as a function of wavelength.
4631
J. Appl. Phys., Vol. 88, No. 8, 15 October 2000 Ting, Chen, and Liu
The optical band gap (Eg) of the TiO2 films can be related to absorption coefficient共␣兲 by
␣h⫽const共h⫺Eg兲2. 共5兲
Figure 6 plots the relationship of (␣h)1/2 versus photon energy共E兲 of the rutile TiO2 films and the extrapolated
op-tical band gaps of the films were determined. When the tem-perature is increased from 700 to 900 °C, the value of Eg decreased from 3.20 to 3.12 eV.
Similar band energy evolution has also been noticed in several thin films including TiO212,13,16and perovskite
mate-rials such as BaTiO3.36Martin et al.16 assumed that such an
evolution in TiO2films might be a result of the variation of
density and structural modifications. They also ascribed this evolution to the electronic disorder induced by oxygen non-stoichiometry in sputtered films. Vasantkumar et al.37 in-ferred the decrease in the band gap energy with increasing temperature to be due to the lowering of interatomic spacing (amorphous→crystalline). This was later confirmed experi-mentally by Lu et al.36in their study of BaTiO3applying the
band gap model proposed by Harrison.38 However, in our films the interatomic spacing increases共Table II兲 共rather than decreased as appeared in perovskite materials兲, with an in-creasing temperature. The band gap energy of our films can-not be accounted for in relation to Harrison’s model,38which obviously contradicts current observations. Instead, follow-ing the model proposed by DeLoach et al.19 关based on the framework of coherent potential approximation 共CPA兲 model兴, the optical band gap of a rutile polycrystalline film is directly related to the structural and electronic disorders. However, their study demonstrated only structural disorder due to the presence of a substantial quantity共30 vol %兲 of an amorphous component. The band energy for those disor-dered crystal films共i.e., virtual rutile crystal兲 can be modeled by a generalized equation
Eg共W,T兲⫽3.22 eV⫺3.14 E0共W,T兲, 共6兲
where Eg is the optical band gap of the disordered crystal
and E0the reverse slope of the exponential region共i.e.,
elec-tronic disorder兲, which is proportional to W2/B 共where W is an energy term, increasing with structural and compositional disorder, and B is the sum of the valence and conduction band half widths兲. The value 3.22 eV is the band energy for a virtual rutile phase. According to Eq. 共6兲, a structural dis-order introduced by an amorphous component would in-crease the value of E0 and causes a decrease in Eg.
How-ever, their model cannot account for the variation of Eg in
this study if based solely on structural disorder, as the values of Eg 共designated in Fig. 6兲 decreased with decreasing fA,
关i.e., increasing structural disorder 共Table I兲兴. Therefore, based on the framework of Eq. 共6兲, the primary plausible reason for this discrepancy results from electronic disorder, that is, oxygen nonstoichiometry. Namely, the electronic dis-order resulting from oxygen deficiency dominates the band gap evolution rather than that induced solely by structural disorder for the films prepared in this study. The E0 calcu-lated values based on Eq.共6兲 together with the band energy values共in Fig. 6兲 demonstrate E0⫽6.37⫻10⫺3eV at 700 °C,
E0⫽1.27⫻10⫺2eV at 800 °C, and E0⫽3.18⫻10⫺2eV at
900 °C, which indicates an increased electronic disorder with increasing temperature. This finding is not only qualitatively consistent with the CPA model described in Eq. 共6兲 but also provides alternative support for the argument revealed by Martin et al.16
FIG. 5. Effect of oxidation temperature on 共a兲 refractive index and 共b兲 absorption coefficient of the TiO2films, in terms of wavelength.
FIG. 6. (␣h)1/2as a function of photon energy for the TiO
2films prepared by oxidation at different temperatures.
IV. CONCLUSION
This study investigated the structural evolution and op-tical properties of TiO2thin film prepared by thermal
oxida-tion of sputtered Ti film over temperatures ranging between 700 and 900 °C. A polycrystalline rutile TiO2phase,
accom-panied by an appreciable quantity of an amorphous phase, can be obtained at a temperature as low as 550 °C. High-temperature oxidation results in an increase in the crystalli-zation, refractive index, and absorption coefficient, but a de-creased band gap energy of rutile TiO2 films. Although the
RBS analysis cannot accurately estimate the stoichiometry of the oxidized films, the argument based on the coherent po-tential approximation implies that the electronic disorder due to the formation of oxygen defect in the oxidized films is principally responsible for the observed band gap evolution at temperatures ranging between 700 and 900 °C. Con-versely, the influence of the amorphous component is less significant in these films.
ACKNOWLEDGMENTS
The authors would like to thank the National Science Council of the Republic of China for financially supporting this research under Contract No. NSC-87-2218-E-009-016. Dr. H. Y. Lee and Dr. H. S. Sheu from the Synchrotron Radiation Research Center are appreciated for their helpful discussions. Professor B. X. Qiu is also commended for as-sistance with the optical measurements.
1Y. Lida and S. Ozaki, J. Am. Ceram. Soc. 44, 120共1961兲. 2
G. P. Burns, J. Appl. Phys. 65, 2095共1965兲.
3
J. Yang and J. M. F. Ferreira, MRS Bull. 33, 389共1998兲.
4K. N. Rao, M. A. Murthy, and S. Mohan, Thin Solid Films 176, 181
共1989兲.
5E. Ritter, J. Vac. Sci. Technol. 6, 225共1966兲. 6
J. R. McNeil, G. A. Al-Jumaily, K. C. Jungling, and A. C. Barron, Appl. Opt. 24, 486共1985兲.
7S. Schiller, G. Beister, W. Sieber, S. Schirmer, and E. Hacker, Thin Solid
Films 83, 239共1981兲.
8L. F. Donaghey and K. G. Geraghty, Thin Solid Films 38, 271共1976兲. 9
G. J. Exarhos, J. Vac. Sci. Technol. A 4, 2962共1986兲.
10P. Lo¨bl, M. Huppertz, and D. Mergel, Thin Solid Films 251, 72共1994兲.
11C. J. Ting, S. Y. Chen, and D. M. Liu, presented at the 101st Annual
Meeting of the American Ceramic Society, Indianpolis, IN, 25–28 April, 1999.
12N. Martin, C. Rousselot, D. Rondot, F. Palmino, and R. Mercier, Thin
Solid Films 300, 113共1997兲.
13
M. H. Suhail, G. M. Rao, and S. Mohan, J. Appl. Phys. 71, 1421共1992兲.
14L. J. Meng and M. P. dos Santos, Thin Solid Films 226, 22共1993兲. 15W. G. Lee, S. I. Woo, J. C. Kim, S. H. Choi, and K. H. Oh, Thin Solid
Films 237, 105共1994兲.
16N. Martin, C. Rousselot, C. Savall, and F. Palmino, Thin Solid Films 287,
154共1996兲.
17
G. Blondeau, M. Froelicher, M. Froment, A. Hugot-Le Goff, and J. Zerbino, J. Electrochem. Soc. 126, 1592共1979兲.
18M. Guglielmi, P. Colombo, V. Rigato, R. Battaglin, A.
Boscolo-Boscoletto, and A. DeBattisti, J. Electrochem. Soc. 139, 1655共1992兲.
19J. D. DeLoach, G. Scarel, and C. R. Aita, J. Appl. Phys. 85, 2377共1999兲. 20R. D. Shannon and J. A. Pask, J. Am. Ceram. Soc. 48, 391共1965兲. 21
R. Padma, K. Ramkumar, and M. Satyam, J. Mater. Sci. 23, 1591共1988兲.
22Phase Diagrams for Ceramists, edited by E. M. Levin, C. R. Robbins, H.
F. McMurdie, and M. K. Reser共American Ceramic Society, Columbus, OH, 1964兲, p. 41.
23J. W. Rogers, Jr., K. L. Erickson, D. N. Belton, R. W. Springer, T. N.
Taylor, and J. G. Beery, Appl. Surf. Sci. 35, 137共1989兲.
24
F. Zhang, Z. Zheng, X. Ding, Y. Mao, Y. Chen, Z. Zhou, S. Yang, and X. Liu, J. Vac. Sci. Technol. A 15, 1824共1997兲.
25T. Fujii, N. Sakata, J. Takada, Y. Miura, Y. Daitoh, and M. Takano, J.
Mater. Res. 9, 1468共1994兲.
26L. Smart and E. Moore, Solid State Chemistry, An Introduction共Chapman
and Hall, London, 1992兲, pp. 95–96.
27
R. N. Blumenthal and D. H. Whitmore, J. Electrochem. Soc. 110, 92
共1963兲.
28D. C. Cronemeyer, Phys. Rev. 87, 876共1952兲. 29
D. C. Cronemeyer, Phys. Rev. 113, 1222共1959兲.
30W. Go¨pel, G. Rocker, and R. Feierabend, Phys. Rev. B 28, 3427共1983兲. 31J. Maserjian and C. A. Mead, J. Phys. Chem. Solids 28, 1971共1967兲. 32
Y. Katsuta, A. E. Hill, A. M. Phahle, and J. H. Calderwood, Thin Solid Films 18, 53共1973兲.
33E. M. Logothetis and W. J. Kaiser, Sens. Actuators 4, 333共1983兲. 34
Y. Fukuda, K. Numata, K. Aoki, A. Nishimura, G. Fujihashi, S. Okamura, S. Ando, and T. Tsukamoto, Jpn. J. Appl. Phys., Part 2 37, L453共1998兲.
35R. Swanepoel, J. Phys. E 16, 1214共1983兲. 36
X. M. Lu, J. S. Zhu, W. Y. Zhang, G. Q. Ma, and Y. N. Wang, Thin Solid Films 274, 165共1996兲.
37
C. V. R. Vasantkumar and A. Mansingh, Seventh IEEE International Sym-posium on Application of Ferroelectrics 共IEEE, New York, 1990兲, pp. 713–716.
38W. A. Harrison, Electronic Structure and Properties of Solids共Freeman,
San Francisco, CA, 1980兲, pp. 438–452.
4633 J. Appl. Phys., Vol. 88, No. 8, 15 October 2000 Ting, Chen, and Liu