都市旅遊之手機電子地圖與紙本旅遊地圖使用經驗研究
凃楊筑淵、謝清宇、鄭文皓、王昱舜、張永儒
摘要
儘管手機地圖程式已成為旅客在旅行中頻繁使用的地圖工具,在旅行中,仍有一 些時刻旅客較偏好使用紙本旅遊地圖。然而,關於旅客「何時」與「為何」選擇使用 某一種地圖工具的研究仍十分缺乏。本研究透過現場實地觀察的實驗與訪談,深入了 解十六位手機使用者在都市旅行中,如何交替使用手機地圖程式與紙本旅遊地圖,並 且探討受測者優先使用某一種地圖的時機與背後原因。研究結論按照旅途中四個常見 的尋路任務,分別討論手機使用者在不同時機偏好不同地圖的原因。此外,研究結論 亦介紹三類非尋路相關但會影響使用者對於手機地圖程式與紙本電子地圖使用選擇的 因素:環境、情境、個人因素。最後,本研究對於未來手機地圖程式提出設計概念與 意涵的建議。 ☉關鍵字:手機電子地圖、使用者經驗研究、旅遊地圖、都市旅遊、現場研究法 ☉本文第一作者楊筑淵為國立交通大學研究助理;第二作者謝清宇為國立交通大學研究助 理;第三作者鄭文皓為國立交通大學研究助理;第四作者王昱舜為國立交通大學副教授; 第五作者張永儒為國立交通大學助理教授。 ☉通訊作者為張永儒教授,聯絡方式:Email :[email protected];通訊處:300 新竹 市大學路1001號光復校區工程三館。 ☉收稿日期:2017/12/26 接受日期:2018/09/12Investigating the Choice Between a Mobile Map and a Paper
Tourist Map in an Urban Traveling Task
Chu-Yuan Yang, Ching-Yu Hsieh, Wen-Hao Chen,
Yu-Shuen Wang, & Yung-Ju Chang
Abstract
While electronic mobile maps are increasingly used by mobile users when traveling, there are situations where a paper tourist map is preferred. Yet, little is known regarding when and why a certain map is chosen over another. We conducted an in-situ field observation and interviews with 16 mobile users to understand how they used a mobile map and a tourist map interchangeably when traveling in an urban area. We specifically investigated when and why they chose a specific map at a specific moment rather than the other. We uncovered when and why mobile users would prefer a tourist map or a mobile application over the other in four common travel-related tasks. We identified three types of non-wayfinding factors— environmental, situational, and personal—that affect users’ choice of a paper or a mobile map. We provide some design implications for future mobile maps.
☉Keywords: field study, mobile map, tourist map, urban travel, user experience research ☉Chu-Yuan Yang is a Research Assistant in the Department of Computer Science at National Chiao Tung University. The second author, Ching-Yu Hsieh is a Research
Assistant in the Department of Computer Science at National Chiao Tung University. The third author, Wen-Hao Chen is a Research Assistant in the Department of Computer Science at National Chiao Tung University. The fourth author, Yu-Shuen Wang is an Associate Professor in the Department of Computer Science at National Chiao Tung University. The fifth author, Yung-Ju Chang is an Assistant Professor in the Department of Computer Science at National Chiao Tung University.
☉Corresponding Author: Yung-Ju Chang, email: [email protected], address: University Road, Hsinchu, Taiwan 300, ROC. 1001.
Introduction
Thanks to the advancements in mobile technology and the increased accessibility
of the mobile Internet, mobile electronic maps (e.g., Google Maps, Apple Maps) have
become a common tool for addressing information needs. In recent years, the rise
in the awareness of usability and user experience has further stimulated companies
that develop these mobile map applications (apps) to continuously improve their user
interfaces, usability, and functionality, making them one of the most common apps
being used on the go. One research study (Brown, McGregor, & Laurier, 2013) found
that smartphone users often switch their search from a mobile browser to a mobile
map app on their phone. Interestingly, despite the convenient access to mobile maps
and their powerful capability in supporting most, if not all, of the wayfinding and
travel-related tasks, some recent research studies on mobile information needs found
that, on certain occasions, smartphone users use a paper tourist map rather than a
mobile map to address their travel-related information needs (Chang & Newman,
2015). One study also found that the participants preferred using a tourist map to an
electronic map for sightseeing (Yan & Lee, 2015). Indeed, many tourist centers are
still offering paper tourist maps despite the popularity of mobile maps. It is argued
that tourist maps play a significant role in guiding tourists and marking destinations.
However, it seems that these roles could be replaced by modern mobile maps because
of the significant improvements in navigation guidance and social and review
systems in mobile maps in recent years. What attracts users to a paper tourist map or
a mobile map rather than the other? Answering this question will allow researchers
and developers of mobile maps to identify places for improvement, and further, will
inform the design of future mobile maps. Therefore, in this paper we aim to answer
these research questions, particularly, in the context of traveling in an urban area:
RQ1: When and why would mobile users prefer mobile maps or paper tourist maps when traveling in an urban area?
RQ2: What factors affect mobile users’ choice of paper tourist maps or mobile maps? To answer these questions, we conducted a field study in which we investigated how mobile users interchangeably used a mobile map and a tourist map when traveling in downtown Hsinchu, one of the major cities in Taiwan. We used field observation along with a post-hoc study interview to capture participants’ behavior in the field and to understand their motivations and reasons behind the use of and the switch between a mobile map and a paper tourist map. In a qualitative analysis, we focused on the connections between context, need, tool, outcome, and the factors that affected their choice of tool. The contributions of the paper are threefold:
1. This study uncovers when and why mobile users prefer a paper tourist map or a mobile map app in four travel-related tasks.
2. The study identifies three types of non-wayfinding factors—environmental,
situational, and personal—that affect users’ choice of a paper tourist map or a mobile map.
3. This study provides design implications for future mobile maps.
Literature Background
Choice of Information Source/Tools on the Go
Finding the right map to solve a travel-related task at hand is an informational tool selection problem. Since the last decade, a number of research studies have started studying mobile users’ information needs in the mobile context. These studies not only suggested information needs that more often arise on the go, but also suggested factors affecting how mobile users addressed their needs (Böhmer, Hecht, Schöning, Krüger, & Bauer, 2011; Chua, Balkunje, & Goh, 2011; Church & Smyth, 2009; Church & Oliver, 2011; Heimonen, 2009; Teevan, Karlson, Amini, Brush, & Krumm, 2011). In these studies, travel-related information, not surprisingly, was highlighted as one of the most common needs of mobile users. A recent work (Chang & Newman, 2015) referred to these needs as environmental information needs,
as the information being sought was related to environments, such as searching Points of Interest (POIs) and wayfinding related tasks. Regarding the tools that mobile users choose to address information needs on the go, both Heimonen (2009) and Church, Cherubini, and Oliver (2014) suggested a link between the method of addressing the information needs and the types of information needs. Users’ perceptions of mobile phones also affected how they used the phone to address information needs (Chua et al., 2011). Chang and Newman (2015) suggested that mobile users’ perceived uncertainty of the accessibility of information has a large impact on their choice of the tool for getting environmental information.
However, how people choose a source/tool to address an information need was already widely discussed even before mobile phones became popular. One of the earliest works is the Principle of Least Effort (PLE) proposed by Zipf (1949). He asserted that people strive to minimize the effort to solve their problems. PLE was later examined along with the cost and benefit analysis in Hardy (1982), in which it was argued that the choice of information sources was not only about the effort (cost), but also about the information to be obtained (benefit). Similarly, research shows that accessibility affects people’s choice of information sources (Agarwal, Xu, & Poo, 2011; Culnan, 1985; Fidel & Green, 2004; Gerstberger & Allen, 1968; Hardy, 1982; O’Reilly, 1982; Pinelli, 1991; Rosenberg, 1967; Straub & Karahanna, 1998; Swanson, 1987), of which the concept is typically referred to as
access difficulty, the time and effort required, and the difficulty encountered in reaching a
particular information source. Fidel and Green (2004) suggested that the top three factors of accessibility are: familiarity with the access to the source, how much time it takes to access the source, and the physical distance.
Research also indicates the influence of other factors that affect people’s choice of information sources, such as personal comfort with the source (Xu, Tan, & Yang, 2006), task importance (Agarwal et al., 2011), task urgency (Agarwal et al., 2011; Fidel & Green, 2004; Freed, 1998), and task characteristics (Byström, 2002; Campbell, 1988). For task urgency, in particular, Agarwal et al. (2011) suggested that when a task is perceived as being urgent, people tend to choose a more synchronous channel. For task characteristics, Straub and
Karahanna (1998) argued that the choice of a medium (e.g., an information tool) is based on an individual’s perception of the fit between the characteristics of the medium and their tasks at hand, which they referred to as a task-medium fit theory. The task-medium fit theory is a summary of several theories, including the media (or information) richness theory by Daft and Lengel (1983), the task-technology fit theory by Goodhue and Thompson (1995), and the social-presence theory by Short, Williams, and Christie (1976). The media richness theory proposes that the use of a medium is effective when characteristics of the chosen medium match the information requirements of the task at hand ( Daft & Lengel, 1983). The task-technology fit theory emphasizes the fit between technology and users’ tasks in order to achieve good task performance (Goodhue & Thompson, 1995). The social presence theory proposes that when a task is interpersonally involving, individuals prefer media with more social presence (Short et al., 1976). These theories together suggest the importance of task characteristics in an individual’s choice of an information tool for performing a specific task.
The present paper is largely inspired by these studies and theories. Despite the valuable findings mentioned above, none of them were conducted in the context of traveling, which is one of the most common tasks of smartphone users on the go. The current paper aims to uncover reasons underlying the choices between a paper tourist map and a mobile map in the context of traveling in an urban area.
Maps and the Information Helpful for Traveling
To discuss why users would choose one map rather than another, it is important to consider what kind of information offered by a map would be considered important and helpful for the users who are traveling. Maps are an important tool for people to acquire knowledge of an environment. They are known to be useful for forming configurational knowledge of an area (Golledge, Dougherty, & Bell, 1995; Montello & Freundschuh, 1995; Noordzij, Zuidhoek, & Postma, 2006; Schneider & Taylor, 1999; Taylor & Tversky, 1992; Thorndyke & Hayes-Roth, 1982). That is, compared to direct experience in the environment, from which individuals learn about environments from an egocentric route perspective
with unstable orientation, maps present a survey perspective, characterized by a bird’s-eye viewpoint, with a stable orientation, and availability of information at a given moment (Schneider & Taylor, 1999). In addition, maps also produce accurate estimates of survey measurement such as Euclidean distances and relative position of locations that direct experience cannot offer.
Many mobile maps now have a navigation feature, which typically produces a series of turn-by-turn instructions until arriving at the destination. Some tourist maps also offer route guidance to specific popular attractions. These descriptions present spatial information using a language, as opposed to being a symbolic but analog representation to reality offered by a map. Montello (1998) argued that description has a greater degree of abstraction than learning from direct experience and maps. Instead of dealing with visual cues, learning from descriptions is more to do with people’s text processing ability. In order to ease the text processing process to make descriptions more effective, Schneider and Taylor (1999) suggested that a description should have appropriate determinacy and complexity, where a
determinate description contains complete spatial information, an indeterminate description
contains incomplete spatial information (thus requiring inferences), and an overdeterminate description contains additional spatial information beyond the essential to the described route (Schneider & Taylor, 1999). Indeterminate and overdeterminate descriptions can both harm wayfinding performance (Schneider & Taylor, 1999), as they create uncertainty that leads to difficulty locating relevant wayfinding information in people’s knowledge. Moreover, indeterminacies or overdeterminancies may not be obvious until the description is compared to the environment. When comparing the description to the environment, overdeterminancy is readily obvious from the descriptions, but indeterminacy is emergent.
Wayfinding is an essential activity in traveling. According to Arthur and Passini (1992), wayfinding comprises three specific but interrelated processes: decision-making,
decision execution, and information processing. In these three processes, cognitive maps
serve as a source of environmental information to make and to execute travel plan decisions, including the decision of whether to stay or go, where to go, which route to take, and how
to go (Gärling, Böök, & Lindberg, 1985). However, when a cognitive map is not enough for performing wayfinding, external information must be offered. Landmarks have been recognized as playing a very important role in people’s wayfinding and formation of environmental knowledge. In fact, landmark knowledge has been assumed to be the first developed environmental knowledge (Siegel & White, 1975). A landmark is referred to as an environmental element with the features that have outstanding characteristics (Lynch, 1960). They are also referred to as reference nodes, choice points, or places whose significance is such that many people use them to anchor directions or to act as foci for wayfinding (Golledge, 1992). When guiding a person to a specific location, landmarks are often used to give directional or orientational information (Golledge, 1992). In a recent study investigating how mobile users use mobile maps and kiosk maps to help their wayfinding tasks (Reilly, Mackay, & Inkpen, 2008), they suggested that landmarks and the dynamics and structure of buildings play an important role in wayfinding. After experiences of movement connecting different landmarks, people gradually learn the sequence of landmarks along the paths, and form route knowledge (Golledge, 1991, 1992; Mark, 1993; Montello, 1998; Siegel & White, 1975). In addition to the knowledge of the orders of landmarks, route knowledge also contains information about the actions to perform at landmarks, such as “move forward” or “turn right.” Because both landmark knowledge and route knowledge are typically described without the information of metric distances, they are also considered as nonmetric knowledge. After the formation of landmark and route knowledge, people start to accumulate and integrate the knowledge into more complex and map-like clusters or networks of routes, which is a configurational representation of metric spatial relationships between environment features. This type of knowledge is referred to as survey knowledge or configurational knowledge (Golledge, 1992; Montello, 1998), which adds relational components to the landmark and route knowledge, including distance, angularity, linkage, direction, connectivity, relation, and topology (Golledge, 1991; Golledge et al., 1995). This knowledge gives a person a bird’s eye view (or survey perspective) of an environment, which allows him or her to discern elements in the environment and to be able to describe the elements
relative to one another (Golledge et al., 1995; Hart & Moore, 1973; Siegel & White, 1975). Some researchers assume that configurational knowledge is probably the highest or most advanced level of spatial knowledge (Hart & Moore 1973; Siegel & White 1975). Golledge et al. (1995) further argued that only with complete configurational knowledge can a person reliably and accurately estimate distances and directions between known points, interpret spatial hierarchies of space, and classify and cluster information into meaningful spatial units such as regions.
Supporting Travel with Mobile Maps and Tourist Maps
Researchers have long been interested in supporting wayfinding and navigation via a mobile system by leveraging information helpful for wayfinding. Many systems have focused on investigating the effectiveness of offering different types and forms of information presented to users, with a primary focus on landmark and route knowledge (Bidwell, Lueg, & Axup, 2005; Burnett, Smith, & May, 2001; Davies, Cheverst, Dix, & Hesse, 2005; Evans, Smith, & Pezdek, 1982; Goodman, Gray, Khammampad, & Brewster, 2004; Hile et al., 2008; Kray, Elting, Laakso, & Coors, 2003; Ross, May, & Thompson, 2004; Snowdon & Kray, 2009; Waters & Winter, 2012). For example, Ross et al. (2004) found that landmark information helped participants have greater confidence and reduce errors in wayfinding. May, Ross, Bayer, and Tarkiainen (2003) showed that pedestrians relied heavily on landmarks to make navigation decisions as they are helpful not merely at decision points but also between decision points to promote orientation and confidence. Prior research has also explored how to present information including landmarks, route instructions, and maps to the users to make the navigation assistance more effective. Prior attempts have included using photographs (Beeharee & Steed, 2006; Hile et al., 2008) and 3D maps (Kray et al., 2003). Other researchers have explored different modalities to provide route guidance, including haptic feedback Robinson, Jones, Eslambolchilar, Murray-Smith, and Lindborg (2010) and audio feedback (Etter & Specht, 2005; Hoggan, Crossan, Brewster, & Kaaresoja, 2009; Jones et al., 2008; Strachan, Eslambolchilar, Murray-Smith, Hughes, & O’Modhrain, 2005).
Regarding tourist maps, prior research has been concerned with how to make tourist maps more effective for supporting tourists. Various expectations and functions of tourist maps have been proposed. For example, while Castaldini, Valdati, Ilies, Chiriac, and Bertogna (2005) argued that tourist maps should be easy for people to interpret and should help them to understand the surroundings, Medynska-Gulij (2003) suggested that the two main functions of tourist maps are facilitating the choice of potential attractions and planning routes. Recently, Yan and Lee (2015) conducted a face-to-face survey with users of paper tourist maps to study their general perceptions of the maps. While more respondents reported preferring to use electronic maps, more considered paper tourist maps as being more useful. In addition, the satisfaction with the paper tourist maps was found to be largely determined by the utility of the map, which included the usefulness of planning routes, appropriate scale, helpfulness for choosing tourist sites, traffic information, and information on tourist sites. They also found that respondents’ education level and travel purpose had a significant effect on their overall satisfaction, with it being higher for those traveling for pleasure than for those on business. It is suggested that paper maps are more helpful for an overview of the environment than their electronic counterparts because of the display limitations. However, the self-reported satisfaction in the study was obtained through a survey that measured general attitudes. It did not tell when or why users would use a paper tourist map or a mobile map in situ, thus revealing their actual behavior when traveling.
Finally, in a recent field study, Vaittinen and McGookin (2016) focused on how tourists switch between different types of navigation during travel and their underlying goals, decision-making process, and the tools they used in traveling. They found that during travel, travelers would use both phone and paper maps to find new POIs. Travelers who relied on paper maps liked their simplicity and highlights of points for visiting. Travelers used Google Maps when they tried to estimate travel time. When they found something within a reasonable walking distance, they looked for the route. Indicators of the direction of Google Maps are considered helpful, but the compass was considered unreliable. Finally, they found that participants rarely used their phones for exploration. They focused much attention on
the environment and were excited about seeing unexpected things that revealed the local life. Our study shared many consistent findings with this research. But we additionally provide four travel situations in which we show when and how participants used paper tourist maps rather than mobile maps, and vice versa. We also uncovered non-wayfinding factors that also affected the choice. In the section below, we first present our study methods. We then provide highlights of our findings regarding our participants’ choice of between map tools in relation to their information needs, behavior, and outcomes.
Methodology
We conducted a field study with 16 smartphone users who were new to the study area, downtown Hsinchu in Taiwan. The study reported in this paper was part of a field experiment, of which the goal was twofold: (1) to understand when and why smartphone users preferred to use and not to use a paper tourist map and a mobile map; and (2) to evaluate the usability of a mobile map app developed in our lab. Given these two goals, the experiment was in two conditions for each participant: in one condition participants using a paper tourist map and Google Maps, and in the other condition participants using our map app. In this paper, we report on the study setting and findings derived from the condition of using a tourist map and Google Maps.
The Study Area
The field study was held in a busy downtown area in Hsinchu City, Taiwan. We divided the area into two regions for the study so that the users could take a rest in the middle point. We tried to balance the characteristics of the two regions as much possible, including the number of attractions in the region shown on the tourist map, the complexity of the environment, the size of the regions, and the distance the participants would travel in the region. Each region had a designated starting point, ending point, and one attraction point they must visit. The attraction point was determined so that participants could travel through more attraction points and through a specific area considered potentially complex and
confusing to them. This manipulation was intended to observe more use of maps for helping wayfinding when participants felt confused. All participants we recruited self-reported in the screening survey that they were unfamiliar with the area and wanted to travel and explore in downtown Hsinchu.
Study Design and Protocol
We provided the participants with a tourist map of the area produced by the Hsinchu City Tourism Bureau. We told them that they could use this paper map and Google Maps at will during the study; that is, they had full control of when to use which tool at all times. They could also use any other tools if they wanted. To understand the participants’ in situ experience and behavior when using the maps during their travel, each participant was
shadowed by a research team member and observed during their travel. We then conducted
a post-session interview immediately after a session. Specifically, a shadower followed a participant and observed his/her behavior as he/she was traveling in the area (see Figure 1). This approach has been used for understanding people’s wayfinding and navigation behavior (Vaittinen & McGookin, 2016). In addition, participants were asked to think aloud throughout the process, especially on the following occasions: (1) when they started and stopped using a tool; (2) when they felt confused or uncertain when traveling; and (3) when they were heading to or had arrived at an attraction point. We asked them to think aloud about why they used a certain map, how they used it, the outcome of the use, what they felt confused and uncertain about, why they felt so, and how they resolved the confusion and the uncertainty. Participants were given a sheet of the think-aloud protocol as a reminder. To obtain their think-aloud speech, we gave them a designated Android phone preinstalled with a conferencing application. During the study, the participants’ phones were connected to the shadower’s phone via the conferencing application, with both audio and screen shared with the shadower, allowing us to monitor the screen of the participant’s phone and the think-aloud speech throughout the entire process. In cases where participants forgot to think aloud, the shadower kept monitoring the participant and the screen activity being shared.
The shadower then probed the participant when he/she started using a tool or displayed body movement possibly indicating confusion. We developed a protocol for the shadower to have less intervention in the participants’ behavior, including staying 3-5 meters away from the participants, not proactively speaking to the participants except when probing, and not offering information related to their traveling. The screen and audio of the participants’ phone, as well as participants’ GPS traces, were all recorded.
Study Procedure
Two days prior to the field study, participants were briefed about the overview and logistics of the study. All participants filled the Santa Barbara Sense of Direction test (Hegarty, Richardson, Montello, Lovelace, & Subbiah, 2002) before the field study to measure their spatial abilities. We collected this score because we suspected that sense of direction might affect their choice of and preference for the maps. However, as we will show later, we did not find a consistent connection in our study.
On the day of field study, the participants were given an overview of the study at the initial meeting point, Hsinchu Train Station. Before the start of the first region, the participants received the study instruction and a tutorial on how to perform think-aloud for the study. After the tutorial, they practiced think-aloud on their way to the starting
Figure 1. We followed the participants, with their phone continuously monitored by the
point of the first region, followed by one researcher. The study started when the participant became fluent in the think-aloud procedure. Each session (i.e., traveling in one region) was approximately 1 hour long (thus 2 hours in total). We instructed the participants to travel as they normally would as a tourist in their most comfortable ways, but we also encouraged them to explore the area and visit as many attraction points as possible, including at least three.
Upon completing traveling in each region, the shadower debriefed the participant to clarify his/her think-aloud data and to ask about his/her travel experience and use of the maps. After the debrief, the follower conducted a semi-structured interview to ask the participant to reflect on his/her experience of using the two tools with a focus on comparing the maps. After the questionnaire and the interview, participants were provided with a small monetary gratuity for participating in the study.
Participants
Study invitations and background questionnaires were circulated on a subject pool Facebook Group created in our own and our neighboring university, as well as on the PTT Bulletin Board System, the largest local social network site (BBS) based in Taiwan. The recruiting message invited people who wanted to explore and travel in downtown Hsinchu so that the study was realistic and motivating for the study participants. A questionnaire was used to screen participants according to their familiarity with the study area and their personal experience of and preference for navigation tools. For measuring familiarity, we used Gale, Golledge, Halperin, and Couclelis (2005) familiarity framework (Gale et al., 2005), dimensions including name, image, location, and interaction frequency. For preference, we asked which of Google Maps and tourist map participants preferred if they were on a touring trip. We selected participants who were unfamiliar with the study area. The participants’ information is shown in Table 1.
All 16 participants completed the two study sessions. They traveled on average 2.75 km (SD = 0.59) in 54.9 minutes (SD = 10.9) Despite the requirements such as must-visit
attractions and a minimum number of points to be visited, all participants behaved as if they were on an actual tour of the study area: exploring and searching a variety of points of interest and performing wayfinding along the way using the map at hand, without any of the shadower’s reminder of the requirements. In fact, all participants visited much more than the required number of attractions: they visited on average 6.81 (SD = 2.29) attractions. Their trajectories were also very diverse: they generated 16 different trajectories (Figure 2) and in total 94 different paths between two attractions, showing that they were freely traveling and exploring the attractions they wanted to visit at will.
Table 1
Participants’ Data (Santa Barbara Sense of Direction, SBSOD, Range 1-7)
Age Gender Occupation Preference for Google
Maps or tourist maps SBSOD
U1 26 F Event Planner Mobile maps 5.67
U2 27 F Student Both 4.67
U3 24 F Engineer Mobile maps 2.67
U4 32 F Student Both 4.93
U5 28 M Assistant Both 3.73
U6 23 F Student Both 5.60
U7 20 M Student Both 3.00
U8 46 M Engineer Mobile maps 2.33
U9 24 M Engineer Both 2.73
U10 27 M Engineer Mobile maps 4.47
U11 22 M Student Both 4.07
U12 24 F Student Both 4.80
U13 29 M Teacher Both 2.40
U14 24 F Student Both 2.80
U15 23 M Student Both 5.20
Figure 2. Our participants actively traveled in the study area and had highly diverse travel
routes.
Data Analysis
The material for the qualitative analysis includes: (1) quotes from participants’ in-situ report: their real-time sharing of how, when, and why they used the map(s) at hand, (2) researchers’ field notes: researcher's’ field observations of the participants’ activities, and (3) transcripts from the post-study interviews. Two authors of the paper first created an initial codebook. The coders then coded two random sets of transcripts and in situ reports using an iterative process of generating, refining, and probing emergent themes. They iteratively revised the codebook until their codes reached a high inter-coder reliability of 0.81 using Cohen’s Kappa (Krippendorff, 2004). The coders coded the rest of the data and identified high-level themes regarding the connection between situations, information needs, tool use, preference, factor, and outcomes.
Findings
Our findings are organized into two sections. We first show the participants’ behaviors and needs of the tool in four different situations and reasons behind choosing one tool over another. We then show non-wayfinding factors, including environmental, situational, and
personal factors that also played a role in affecting our participants’ perceptions and choice of maps.
Four Situations and Participants’ Map Choices
We identified four situations of our participants during their travel in downtown Hsinchu during which they displayed distinct information needs and use of the map tool. These situations share the same idea of the major identified environmental information needs identified in previous work (Chang & Newman, 2015), and closely agree with two exploratory types of wayfinding behaviors (i.e., exploring and questing) identified in Allen (1999), with the addition of a travel element. These situations are: (1) Choosing POIs and
Route Planning, (2) Tracking and Confirming Positions and Direction, (3) Anticipating when for next actions, and (4) Serendipity and Incidental Learning.
Choosing POIs and route planning.Choosing POIs and route planning were observed to be an initial stage of almost all participants’ traveling. Often, they just looked around and traveled without a destination in mind. But given the nature of the study task, all participants had chosen at least three destinations to visit before they started traveling. It is noteworthy that the participants’ planning occurred not only at the beginning of the study. Instead, their planning activities were ad hoc and occurred quite often during traveling, usually after they had finished visiting one POI and were ready for the next one. This ad hoc planning was also reported in Vaittinen and McGookin (2016). In the following paragraphs, we illustrate participants’ choice of tools in choosing POIs and route planning.
We observed that all participants conducted two types of planning strategy. The first was determining a route by choosing one destination at a time, typically starting from the one nearby. The second strategy, in contrast, was to first determine a final destination, and then to plan a route by choosing POIs along the way to the final destination. Regardless of which strategy participants were using, we observed that most more often performed planning using the provided paper tourist map than Google Maps. According to the participants’ in-situ reports, the paper tourist map provided a clear and concise configuration of the area,
highlighting of POIs, and major paths that connected these POIs. Many participants explicitly mentioned that highlights were important for them in making a travel plan. For instance, U1 commented, “I normally start with the tourist map, because it gave me an idea of which place I must visit in the area, and also a clear view of the area. It took more time and effort to do the same things on Google Maps.” In contrast, few participants used Google Maps to plan their next destinations. They generally thought Google Maps had too much information and that the absence of highlights made it less efficient to find where to go. For example, U9 commented, “There are so many different kinds of information on Google Maps. It takes a lot of time […] to sort out the information you need.” Another commonly mentioned drawback was the effort of adjusting the zoom level of the area to get information. For example, many participants reported that in order to get an overview of the area to see more POIs, they needed to zoom out the map. However, some POIs would disappear from view when the map was zoomed out, as U8 said, “There were times when I tried to gain an overview of the region on Google Maps. However, when I zoomed out to see the big picture, the name of some POI might be gone or not be in view.”
In addition to the POIs to visit along the route, participants also planned decision points along the route using the paper tourist map. They often included intersections and buildings, two typical types of landmark (Lynch, 1960), in part of their route plan so that they knew when to take a turn or go forward. Below are two excerpts from U12 and U16 respectively when they were thinking aloud during their planning using the paper tourist map, “OK, next I will see Bei-da Church, and then make a right turn, and then follow Chong-cheng Road till the Fire Museum, and then I will arrive at the Image Museum. OK.” said U12. “Now I need to take a look at what I will pass on the way to the Living Art Center. First, find Dong Meng Street and make a right turn when meeting Weng Chon Street. OK. Go,” said U16. Therefore, it seems that at the planning stage our participants preferred using the tourist map over Google Maps because it allowed them to more easily form a configurational knowledge of the area as well as the route knowledge for the upcoming journey.
used the paper tourist map during the entire planning process, others switched to Google Maps because it allowed them to see more details of POIs they were interested in exploring. The details included an introduction to the POIs, visitors’ reviews, the appearance of the POIs, and the exact location of the POIs. Specifically, many participants said they would read the introduction of the POIs listed on the side of the tourist map if there was one. However, since the descriptions were brief, these participants turned to Google Maps for user reviews to get more details. For instance, U6 commented, “I think the tourist map is just providing me with some choices of POIs. To make a better decision, I need further information. Normally, I would then switch to Google Maps to find their reviews and ratings.” Regarding the exact location of POIs, many participants felt that the location information that the tourist map provided was not precise or detailed enough. They used Google Maps to search for information including address, direction instruction, and time estimation to the POIs. U7 reported in the in-situ report, “I don’t know how to get there with the tourist map… let me use Google Maps to find out its address.” Other participants wanted to estimate the time needed to walk to the destination. They reported that it was difficult to use the tourist map to estimate travel time because they did not know the actual distance and they had to calculate it by themselves. They thought it was simpler to look up the estimated time of arrival using the navigation guidance of Google Maps. For example, U16 said after deciding on his travel destinations, “I would like to use Google Maps to find out how much time it takes to walk there.”
Finally, the participants chose Google Maps to search for places not present on the tourist map. While the tourist map highlighted popular POIs, it lacked information on other places that they wanted to visit or pass by, including local restaurants, small shops, ATMs, and toilets during their travel. For instance, U8 was observed to switch to Google Maps to find an ATM for withdrawing money to buy a drink. In fact, these places were absent from the tourist map, but they are also absent from many city tourist maps. The participants seemed to be very aware of this limitation. In our post-study interview, one participant pointed out that what he especially liked about Google Maps was the richness of its information for everyday
life, such as restaurants, ATMs, toilets, or public Wi-Fi. One participant described a feeling of being safe when he traveled with Google Maps, as he thought the information it provided was accurate.
Tracking and confirming position and direction. Tracking and confirming position
and direction were common and frequent tasks of participants during their travel. Information needs belonging to this category included “Where am I?,” “Which direction should I go in?” and “Am I going in the right direction?” Note that in previous research on information needs these needs were treated as different categories. In those research studies, the instances of information needs were described as one instance at a time. In this study, however, the instances of these needs were observed by a shadower and captured via participants’ in-situ think-aloud, through which we found that they were mostly intertwined and occurred simultaneously when they did occur. The participants needed information of both their current location and the direction in order to travel to the next destination. When they were unsure about either one, or sometimes both, a gap existed. They then needed to make sense of their current situation (Dervin, 1998) in order to continue to the destination. “Am I going the right way?,” for example, was a typical combination of losing track of the current location and of the direction. The way they made sense of the situation depended on what caused the gap.
More specifically, it was common for the participants to continually use the map at hand, either Google Maps or the paper tourist map, to make sense of their current location. With the route knowledge they had developed beforehand in the route planning stage, they needed to check their current location relative to the elements on the map at hand to see their progression to the destination and to the next decision point. When the map at hand was the paper tourist map, they tried to match elements they saw in the environment with the items on the tourist map. The elements, including road names and POIs, were treated as reference points for knowing their current location, some of which had been noted earlier during the route planning. We provide U1’s excerpt in her in-situ reports, “This should be the Chen-chia meat ball stand, and next there should be a bubble tea stand....” A few participants tended to
keep saying the name of a reference point until they saw it. This strategy was successful as long as they were tracking their location. For example, U15 said,“I would need to make a left turn when meeting Bei-Da Road, and then right turn at Bei-Meng Street […] Ok, now I’m on Chong-Shan Road, but I’ve not seen Bei-Da Road.”
However, there was not always an item available as a reference point on the paper tourist map. In this situation, when they felt uncertain because they thought it had been a long time without seeing the next reference point, or when they did not see a reference point they expected to see at certain locations, many of them who used the paper tourist map initially switched to Google Maps because of the provision of GPS location and more detailed information about the environment, including places and road information. For example, U10 commented on his way to the travel destination, “Let me check whether this is Chon-yun Road,” then he seemed to be looking for the road sign, and after that, he commented, “Ok, progress along Chon-yun Road.” Google Maps was also usually used for estimating time of arrival as well as distance. Often participants switched to Google Maps if they wanted to estimate distance or time because they had earlier found that the road structure of the tourist map was not accurate. One good example of a participant experiencing this problem is U5, who said on his way to the destination, “I am annoyed. I’ve been walking for a long time, but this road on the tourist map does not look that long.”
Not seeing the expected reference point also occurred often at the arrival of a destination. Many participants were sometimes unsure of their arrival because they did not see the destination. This triggered them to look at the map to make sense of their current location. A major reason for not seeing the destination was because participants were unsure of its appearance. Interestingly, many participants turned to a tourist map to match the 2D or 3D drawing of the destination with it in the environment. Two participants had chosen the street view service of Google Maps when they confirmed their arrival. However, one participant, U13, when arriving at a shop located in a busy and crowded area, which was small and surrounded by many other similar-sized shops, had trouble confirming his arrival using the street view service. Sometimes, the uncertainty about location was not because
of not seeing expected reference points but because of seeing roads or landmarks that they did not expect to see. These roads or landmarks were not necessarily trivial but were simply not displayed on the paper tourist map. In this situation, the participants switched to Google Maps to get more detailed road network information. For example, it was observed that U8 switched to Google Maps to find more details of the surrounding road network when he found that the path was not what he originally expected. Finally, despite only a few instances, sometimes the participants felt that they had totally lost track of their current location and so used Google Maps to find their way in these situations.
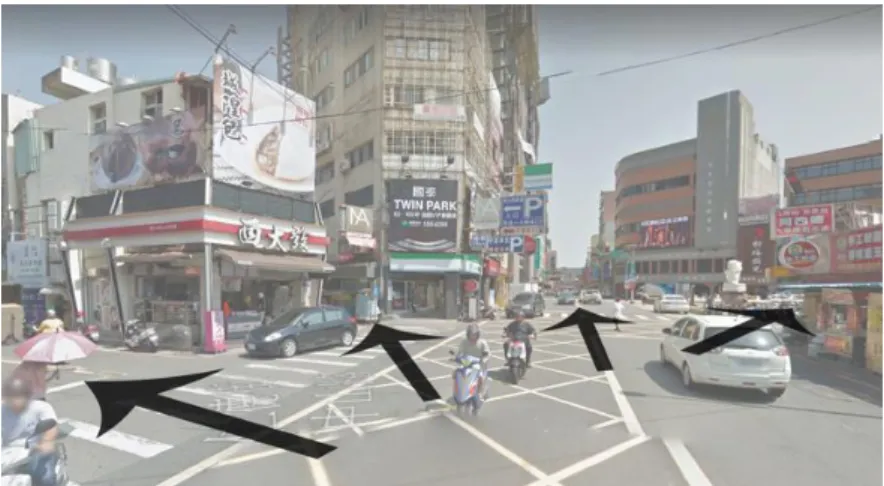
Finally, finding the right direction commonly occurred at intersections. If participants had marked decision points in route planning, they could more smoothly pass the intersection. However, even if they had planned their route earlier, most of the time they still needed to check the map at hand to decide on the direction at an intersection. At decision points, some participants reported that they preferred Google Maps because it had a direction indicator (displayed as an arrow). Other participants preferred directly using its navigation guidance because it was clearer for them to know which direction to go due to the egocentric view. For example, U6 commented, “I feel better with Google Maps, because it provides me with a first-person perspective and direction. It made me feel more comfortable with following the guide of the map to make a right or left turn....” The egocentric view with a visual direction of Google Maps was apparently appreciated by many participants. However, several participants mentioned that the direction indicator was not always reliable. A few participants went in the wrong direction because of the inaccuracy of the direction indicator. The unreliability of the direction indicator was especially a problem when the intersection was complex. Figure 3 is an example of a complex intersection that many of our participants had confusion with, even with the help of the direction indicator.
Figure 3. This is an intersection where many participants had trouble finding which direction
to go
Anticipating timing for the next move. As mentioned earlier, many participants noted
when to make a move (e.g., turn right, go straight) in route planning, as they did for noting reference points to position themselves along the way. They noted decision points in advance to prevent them from making a wrong turn, especially when reaching an intersection. Making a wrong turn was considered a disaster by some of our participants. We observed that anticipating when to act was an ongoing process along the way to the destination. That is, while noting decision points in preplanning gave them a rough idea of how to go, the actual execution of wayfinding relied much on their updates of new decision points. The participants updated the next one or more decision points whenever they reached the current one. Sometimes they did not stick to the original plan simply because they seemed to forget the initial plan before they departed; but at other times they missed a decision point, or made an ad hoc decision of going to other places, such as visiting a drink shop nearby.
In general, we observed usage of both the paper tourist map and Google Maps for finding next decision points. In addition, since route planning, the participants tended to use major paths displayed on the paper tourist map to find their decision points. We observed no instances of participants intentionally switching from the paper tourist map to Google Maps for taking shortcuts through small paths that were not displayed on the paper tourist map.
When they were following the small paths, they were usually already using Google Maps. We think the absence of such a behavior might be because our participants were not familiar with the study area. It is also likely that they were not in a hurry and thus had no need to take a shortcut. However, in the interviews we did not learn the participants’ preference for either map in this situation.
Serendipity and incidental learning. Finally, we observed that along the way to the destination, some participants were attracted by places they passed by and wanted to know more about them. This learning is regarded as incidental learning by some environmental psychologists (Golledge, 2002; van Asselen, Fritschy, & Postma, 2006). This is a natural learning activity encountered frequently in daily life. Some of these incidentally discovered places were on the paper tourist map but had not been noticed by the participants earlier. However, even if the paper tourist map had included or highlighted them, the map did not contain more details about these places. Others that were not on the paper tourist map were not necessarily on Google Maps either. Participants searched for these place on Google Maps if they could not see them on either map. They also searched when they simply wanted to know more about the place. For example, U7 found an open public space on his way to a destination and said, “I want to know the thing is in front of me. I thought that was a park and was curious about its name. I used Google Maps to look it up.”
Non-wayfinding Factors that Affect Map Choice
During the study, we highlighted three types of non-wayfinding factors that affected our participants’ perceptions and choice of the paper tourist map and Google Maps during their travel. These factors are: environmental factors, situational factors, and personal factors.
Environmental factors. The participants were observed to change the tool when
environmental factors played a role. The factors that were obvious in our study included light, rain, and wind. During the study, several participants said they could not see the information on the phone because the sun was too bright. They therefore turned to the paper tourist map or found a place in shadow to use Google Maps. For example, U16 said when he
was walking on the street, “The sun is too bright now. I can’t see what’s showing on Google Maps.” In addition to light, participants in a post hoc interview reflected that they would change the tool because of rain or wind. For example, U13 said, “It’s really inconvenient to use a tourist map to find your way when it’s raining, because it’s made of paper. It might get easily wet.” On the other hand, U8 also commented, “I would avoid using a tourist map when the wind blows hard on the street.” Despite the fact that neither rain nor wind were encountered by our participants on the study day, we think both the mentioned influences are legitimate.
Situational factors. We found six situational factors that would affect participants’
perceptions and use of a map, namely: Activity involved in the travel, transportation type,
safety concern, phone status, Internet connectivity, and time pressure.
During the travel in the study, many participants reported that using two maps was troublesome but unavoidable. It was unavoidable because they thought they simply had to switch between Google Maps and the tourist map to get specific information from each respectively. Sometimes they had to use both at the same time. The fact that they had to switch between two maps was not favored by the participants, many of whom expressed annoyance. For instance, U14 said, “It is very annoying that you have so many things to carry on the way.” Some participants thought carrying a map was especially inconvenient when the activity involved in the travel needed at least one hand. For example, U5 commented on her way to the destination, “I wanted to buy an ice cream and enjoy it on my way. But I have to give up because my hands are full now.” They mentioned that it was more convenient if they only needed to carry one map that could do everything.
Some participants expressed concerns about their safety when using Google Maps on the street. For instance, U4 intermittently used Google Maps on the way to a destination, and said, “When using Google Maps, I need to concentrate on this small screen with much little text. I feel it’s a little bit unsafe. I feel that I was disconnected from the environment. This would put me in danger especially when I am walking on a busy street.” In post-study interviews, many participants said that they prefer Google Maps when they need to take
transportation or drive to a distant destination. However, U14, who was an experienced rider of a scooter—a common form of transportation in Taiwan—made an interesting point, “There’s no route planning for motorcycle riders on Google Maps. It would be a bit confusing when using the route planning service by Google Maps because no matter whether you choose the mode for pedestrians or for car drivers, the plan is likely to suggest a route that does not allow motorcycle riding.”
The influence of the status of the phone was also mentioned, including battery drainage and the connectivity of the phone. Specifically, some participants complained that Google Maps consumes too much phone battery life. They stopped using it if they needed to use the phone for other purposes later. For instance, U1 said in the post-study interview, “I might have to use my phone for other things, but Google Maps drains my battery quickly.” Some others complained that the reliability of Google Maps was easily influenced by the Internet connectivity. For example, U15 said, “Google Maps is not that useful when the connectivity is unstable,” U6 also said, “Sometimes the direction triangle of Google Maps is wrong. I remember there was once when it was totally pointing in the opposite direction.”
The influence of the status of the phone was also mentioned, including battery drainage and the connectivity of the phone. Specifically, some participants complained that Google Maps consumes too much phone battery life. They stopped using it if they needed to use the phone for other purposes later. For instance, U1 said in the post-study interview, “I might have to use my phone for other things, but Google Maps drains my battery quickly.” Some others complained that the reliability of Google Maps was easily influenced by the Internet connectivity. For example, U15 said, “Google Maps is not that useful when the connectivity is unstable,” U6 also said, “Sometimes the direction triangle of Google Maps is wrong. I remember there was once when it was totally pointing in the opposite direction.”
Finally, many participants stated that they would especially prefer Google Maps when they were traveling under time pressure. For example, U12 said, “Using the navigation service of Google Maps saves me a lot of time when finding my way. I don’t want to delay my tour.” However, when traveling without time pressure, some participants said that they
would not necessarily prefer Google Maps because they do not need to be fast. For example, U7 said, “If there’s no time pressure, I don’t care whether I am taking a shortcut. Even if I am led in the wrong destination, it’s ok. I might just explore that place.”
Personal. There were also personal factors that would affect participants’ perceptions
and use of the map. They are sense of achievement, perceived additional utility, and
preplanning habit.
For sense of achievement, some participants who preferred tourist maps enjoyed the process of finding their way. According to them, the process was like an adventure. For example, U5 said, “Finding your way is like playing a game. Finding your way is a challenge but it is also fun.” Some other participants said that the tourist map was not merely a map to them. They mentioned that they treated it as a travel diary that preserved their memory of the tour and allowed them to reminisce. For example, U1 said, “You can draw or write anywhere on the tourist map, […] and you can remember what happened during the trip in the future.”
On the other hand, several participants preferred a paper tourist map for traveling because it already, and only, highlights popular and must visit POIs. They thought they could save effort in pre-planning a trip. On Google Maps, however, they thought they had to filter information to prepare a trip plan because the presented information contained not only tourism-related information but also other types. For instance, U9 stated, “Google Maps is not for those who do not plan in advance at home. It’s not easy to filter what you need from so much information.”
Discussion
The Choice between Mobile Maps and Tourist Maps
Participants had different reasons for preferring tourist maps or Google Maps over the other in different situations. From the study findings, we observed a number of reasons consistent with the literature in information source/channel selection. First of all, we observed that many reasons for choosing a map could be explained by the task medium
fit theory (Straub & Karahanna, 1998): In the four situations where participants needed to solve a travel-related information task, they seemed to be quite aware of the strengths and weaknesses of each map tool for performing the task at hand, including what information and features were available in each tool, how conveniently and quickly they could obtain information from each map, and how reliable the information was on each map. A quick association between the task and a map suggested the participants’ great familiarity with the features of each tool. Nevertheless, there were still situations where the participants would first attempt to use one map but switched to the other afterwards. We observed that it was largely because the first choice at hand was more accessible in terms of convenience. The familiarity with the maps, the perceived amount of time for completing the task, and the feeling that it was troublesome to hold a map during travel, were all captured in the concept of accessibility (Fidel & Green, 2004). However, our study findings revealed additional environmental, situational, and personal factors that also affected the choice of the maps. We believe this addition was largely due to the great variety of mobile contexts that were absent in a workspace context. Nevertheless, we believe there are various other factors that this study did not identify because of the constraints of the study setting. For example, all participants were given a paper tourist map in our study. But in real life, the access to a paper tourist map (e.g., whether it is available online or easy to get at a tourist center) would first influence whether users can use the map. We also did not see much evidence of the personal comfort issue in our study. All of our participants claimed that they were comfortable with both the paper tourist maps and Google Maps. For future mobile maps, we think that, besides personal factors, some environmental and situational factors (e.g., weather, amount of traffic, internet connectivity, battery life) can be detected and anticipated by an intelligent mobile system. The system should predict when users would prefer a paper tourist map or Google Maps according to the present and future status of the environment and situation.
Can a Map be Concise and Detailed at the Same Time?
first suggested that the provided tourist map had the intended function of a tourist map (Medynska-Gulij, 2003). In our study, the major reason participants preferred tourist maps for planning was because it highlighted attractions, which could also explain the absence of other details. As Nielsen and Molich (1990) suggested, every piece of information can compete for the audience’s attention. If there was more information on the paper tourist map, the salience of the highlights would decrease. On the other hand, one of the main reasons for our participants to often choose Google Maps was also its richness of information. For example, when trying to know more about a POI, participants switched to Google Maps. The lack of information of roads and reference points resulted in the participants’ uncertainty about their current position. Displaying concise versus detailed information seems to be a typical tradeoff problem in information presentation. Can a map be concise and detailed at the same time? We argue that the future mobile map systems should embrace both. But these two do not need to exist at the same time. We suggest that future mobile map systems learn to recognize when users would prefer a concise view and a detailed view, respectively. Our findings suggest a two-stage process of route planning: (a) finding candidate POIs using highlights and (b) confirming POIs with details. The system could start with a concise view with highlights when planning but keep the details until the user wants to review the places in more detail. In addition, highlighting users’ current location as well as commonly used reference points nearby can help users quickly position themselves and therefore reduce the likelihood of feeling uncertain. It can also help users quickly identify the direction by showing not just a direction indicator using the sometimes inaccurate compass, but a short direction tail that indicates where the user came from. The map system can also potentially let users obtain specific reference points on the map so that they can use them later to position themselves and confirm their direction. Planning, tracking, and confirming position and direction are the three main situations we found participants had trouble with during their travels. We think these situations are good starting points for a future mobile map system. Finally, the system could consider allowing users to control when to show details by adding a quick toggle button so that they can quickly switch to a concise or to a detailed view
according to their current task at hand.
Study Limitations
The current study has a number of limitations. First, we conducted the study with only 16 participants, all of whom had relatively similar backgrounds. Although our goal was to obtain insights into in-situ use of map technologies using qualitative research with a small sample size, our findings may not be generalized to a larger mobile phone user population. Second, we investigated participants’ choices of maps in a relatively constrained study setting. Although the participants had quite diverse travel trajectories and had a variety of travel-related tasks and environmental information needs that were consistent with previous studies conducted, we could not claim that this study perfectly reflected the real-world situation. It should be noted that we posed several constraints on participants instead of observing them behaving completely naturally. Although we tried to make the study setting as realistic as real travel, these constraints nevertheless would not be present in many travel contexts. In addition, all participants were traveling in downtown Hsinchu instead of to well-known or popular tourist destinations. We expect the results to be more applicable to traveling in an urban area instead of in a tourist domain. We also did not discuss how age and gender related to the choice of map in this study. While one reason is that there were few senior participants in our study, another reason is that, qualitatively, we did not observe noticeable differences between the junior and senior participants. If there had been more diverse ages of participants, we might have been able to observe more nuances in their behaviors and preferences. On the other hand, prior research has conflicting results regarding the influence of gender on spatial abilities (Gilmartin & Patton, 1984; Kitchin, 1996; Montello, 1998). In our data, we also did not observe noticeable differences between genders. Finally, participants could have varied preferences and experiences of using maps and wayfinding strategies. Our qualitative study with a small set of participants unfortunately could not draw any conclusions about the connection between them. A more controlled experimental method would be needed to observe if a statistically significant difference
existed between these characteristics in the study context. However, it is beyond the scope of this paper.
Conclusion
In the study, we conducted an in-situ field observation and interviews with 16 smartphone users to understand how they used mobile maps and tourist maps interchangeably while traveling in an urban area. We investigated when and why they chose a specific map at a specific moment rather than the other. We uncovered when and why mobile users would prefer a tourist map or a mobile app over the other in four common travel-related tasks. Also, we identified three types of non-wayfinding factors—environmental, situational, and personal—that affect users’ choice of a paper and a mobile map. Finally, we provide some design implications for future mobile maps.
Despite the limitations mentioned, we believe the results of this study are not without value. This is the first study that aims to study the choice of two commonly used maps, tourist maps and mobile maps, with the motivation of shedding light on how to improve future mobile maps through investigating the reasons underlying the choices.
Although nowadays an increasing number of people are using electronic maps, many governments still publish and distribute tourist maps for the cities they want to promote. As shown in our study, in a number of situations users also prefer these tourist maps. Consequently, we not only treat this research more as a starting point for future research on this topic, we also provide several design suggestions worth pursuing for building a better mobile map tool in the future.
References
Agarwal, N. K., Xu, Y. (Calvin), & Poo, D. C. C. (2011). A context-based investigation into source use by information seekers. Journal of the American Society for Information
Science and Technology, 62(6), 1087-1104. doi: 10.1002/asi.21513
Allen, G. L. (1999). Spatial abilities, cognitive maps, and wayfinding. In R. G. Golledge (Ed.), Wayfinding behavior: Cognitive mapping and other spatial processes (pp. 46-80). Baltimore (Md.): Johns Hopkins University Press.
Arthur, P., & Passini, R. (1992). Wayfinding: People, signs, and architecture. New York: McGraw-Hill Book Co.
Beeharee, A. K., & Steed, A. (2006, September 12-15). A natural wayfinding exploiting
photos in pedestrian navigation systems. Paper presented at the 8th Conference on
Human-computer Interaction with Mobile Devices and Services, Helsinki, Finland. doi: 10.1145/1152215.1152233
Bidwell, N. J., Lueg, C., & Axup, J. (2005, July 7-8). The territory is the map: Designing
navigational aids. Paper presented at the 6th ACM SIGCHI New Zealand Chapter's
International Conference on Computer-Human Interaction: Making CHI Natural, Auckland, New Zealand, ACM. doi: 10.1145/1073943.1073959
Böhmer, M., Hecht, B., Schöning, J., Krüger, A., & Bauer, G. (2011, August 30-September 2). Falling asleep with angry birds, facebook and kindle: A large scale study on mobile
application usage. Paper presented at the 13th International Conference on Human
computer Interaction with Mobile Devices and Service, Stockholm, Sweden, ACM. doi: 10.1145/2037373.2037383
Brown, B., McGregor, M., & Laurier, E. (2013, April 27-May 2). iPhone in vivo: Video
analysis of mobile device use. Paper presented at the 6th ACM SIGCHI New Zealand
Chapter's International Conference on Computer-Human Interaction: Making CHI Natural, Paris, France, ACM. doi: 10.1145/2470654.2466132
of’good’landmarks. Contemporary Ergonomics, 2001, 441-446. doi: 10.1.1.471.4526 Byström, K. (2002). Information and information sources in tasks of varying complexity.
Journal of the American Society for Information Science and Technology, 53(7),
581-591. doi: 10.1002/asi.10064
Campbell, D. J. (1988). Task complexity: A review and analysis. The Academy of
Management Review, 13(1), 40-52. doi: 10.2307/258353
Castaldini, D., Valdati, J., Ilies, D. C., Chiriac, C., & Bertogna, I. (2005). Geo-tourist map of the natural reserve of Salse di Nirano (Modena Apennines, northern Italy). Il
Quaternario, 18(1), 245-255.
Chang, Y.-J., & Newman, M. W. (2015, April 18-19). Making local information more
accessible: A diary study of information channel selection of mobile Users. Paper
presented at the 3rd International Symposium of Chinese CHI, Seoul, Republic of Korea, ACM. doi: 10.1145/2739999.2740000
Chua, A. Y. K., Balkunje, R. S., & Goh, D. H.-L. (2011, February 21-23). Fulfilling
mobile information needs: A study on the use of mobile phones. Paper presented
at the 5th International Conference on Ubiquitous Information Management and Communication, Seoul, Korea, ACM. doi: 10.1145/1968613.1968721
Church, K., & Smyth, B. (2009, February 8-11). Understanding the intent behind mobile
information needs. Paper presented at the 14th International Conference on Intelligent
User Interfaces, Sanibel Island, Florida, USA, ACM. doi: 10.1145/1502650.1502686 Church, K., & Oliver, N. (2011, August 30-September 2). Understanding mobile web and
mobile search use in today's dynamic mobile landscape. Paper presented at the 13th
International Conference on Human Computer Interaction with Mobile Devices and Services, Stockholm, Sweden, ACM. doi: 10.1145/2037373.2037385
Church, K., Cherubini, M., & Oliver, N. (2014). A large-scale study of daily information needs captured in situ. ACM Transactions on Computer-Human Interaction, 21(2), 10:1-10:46. doi:10.1145/2552193
for the delivery of information systems and services. Journal of the American Society
for Information Science, 36(5), 302-308. doi: 10.1002/asi.4630360504
Daft, R. L., & Lengel, R. H. (1983). Information richness. A new approach to managerial
behavior and organization design. (No. TR-ONR-DG-02). Texas A and M Univ
College Station Coll of Business Administration.
Davies, N., Cheverst, K., Dix, A., & Hesse, A. (2005, September 19-22). Understanding
the role of image recognition in mobile tour guides. Paper presented at the 7th
International Conference on Human Computer Interaction with Mobile Devices & Services, Salzburg, Austria, ACM. doi: 10.1145/1085777.1085809
Dervin, B. (1998). Sense-making theory and practice: An overview of user interests in knowledge seeking and use. Journal of Knowledge Management, 2(2), 36-46. doi: 10.1108/13673279810249369
Etter, R., & Specht, M. (2005, May 8-13). Melodious walkabout: Implicit navigation with
contextualized personal audio contents. Paper presented at the 3rd International
Conference on Pervasive Computing, Munich, Germany. doi: 10.1.1.130.8157
Evans, G. W., Smith, C., & Pezdek, K. (1982). Cognitive maps and urban form. Journal of
the American Planning Association, 48(2), 232-244. doi: 10.1080/01944368208976543
Fidel, R., & Green, M. (2004). The many faces of accessibility: Engineers’ perception of information sources. Information Processing & Management, 40(3), 563-581. doi:10.1016/S0306-4573(03)00003-7
Freed, M. (1998, July 26-30). Managing multiple tasks in complex, dynamic environments. Paper presented at the 15th National Conference on Artificial Intelligence and Tenth
Innovative Applications of Artificial Intelligence Conference, Madison, Wisconsin, USA.
Gale, N., Golledge, R. G., Halperin, W. C., & Couclelis, H. (2005). Exploring spatial familiarity. The Professional Geographer, 42(3), 299-313. doi:10.1111/j.0033-0124.1990.00299.x