ELSEVIER Materials Chemistry and Physics 55 (1998) 94-101
Mechanical
properties of a low-temperature-cured
ceramic
matrix composite
C.S. Shin’@, J.B. Wang
Received 20 August 1997; received in revised form 27 November 1997; accepted 18 March 1998
Abstract
An alumina matrix composite reinforced by S-glass woven fabric has been developed which can be cured at below 300°C. The current work examines the flexural strength and fracture toughness of this composite in various directions relative to the fabric weaving direction at
room temperature, 200 and XlO”C. It is found that the flexural strength decreases as the angle between the flexural axis and the reference weaving direction increases from 0 to 45”. The strength is not affected by raising the temperature to 200°C but decreases by - 65% at 500°C. Flexural strength is markedly higher when loading is parallel to the plane of the fabric than normal to it. At all three temperatures tested, the 0” specimens have the highest fracture toughness; the toughness then drops in the 22.5” specimens and rises slightly again in the 45” specimens.
Possible mechanisms leading to the observed phenomena are discussed. Preliminary room-temperature fatigue strength results are also
reported. Results presented herein can form part of a design data base of mechanical properties for this composite. Besides, the current results also indicate the optimum orientations to be adopted in component design to derive better strength and toughness. Fatigue testing data suggest
that structural integrity under cyclic loading can be tracked by monitoring appropriate material stiffness values. 0 1998 Elsevier Science
S.A. All rights reserved.
Keywords: Ceramic matrix composites; Fibre reinforcement; Low-temperature curing -
1. Introduction
Fibre-reinforced polymeric composites are light, stiff and
strong and can be tough. However, they cannot normally be used at temperatures above 250°C because the polymeric matrix will soften [ I]. On the other hand, ceramics have extremely high Young’s modulus, hardness and wear resis-
tance. In particular, their excellent creep and oxidation resis-
tances enable ceramics to retain reasonable strength at temperatures far higher than those applicable to metals, Their extreme brittleness makes ceramics materials highly suscep- tible to small defects and seriously limits their application to structural components. This drawback can in part be offset by the addition of reinforcing fibres to form a ceramic matrix composite (CMC). CMCs have a working temperature higher than that attainable by metals. However, the cost of fabrication of CMCs is also higher and it is rather difficult for CMCs to be formed into complex shapes. For interme- diate-temperature applications, the Chung Shan Institute of Science and Technology, Taiwan, has recently developed a
i: Corresponding author. Tel.: +X86-2-23622160; Fax: + 886-2-23622160; E-mail: [email protected]
series of composites which can be cured at a lower tempera-
ture and applied at temperatures far higher than those achiev- able by conventional polymeric matrix composites [ 2-41.
In the present work, the mechanical properties of a low- temperature-cured ceramic matrix composite reinforced by a woven glass fabric have been investigated. The composite was prepared from woven fabric prepreg. This allows good flexibility in the fabrication process. Moreover, woven fabric reinforcement potentially renders better out-of-plane stiff- ness, strength, impact resistance and toughness than tape lam- inates [ 5,6]. This kind of reinforcement is essentially two dimensional. Accordingly, the mechanical properties may depend differently on the direction of the reinforcing fibres. The llexural strength and the fracture toughness in various directions relative to the fabric weaving direction at room temperature have been investigated in this work. Preliminary tests on higher-temperature properties and room-temperature fatigue properties have also been evaluated.
2. Experimental
The as-received CMC materials were in the form of 27 cm X 27 cm X4 mm plates. Fabrication of the plate involved
0254-0584/98/$ - see front matter 0 1998 Elsevier Science S.A. All rights reserved. PI1 SO254-0584(98)00127-S
C.S. Shin, J.B. Wang/Mum-i& Chrmistry and Phpics 55 (1998) 94-101 95
the preparation of its prepreg, which was made by pre- impregnating an orthogonally woven S-glass fabric with a mixture of alumina and an aluminium phosphate binder. A plate was then fomred by stacking up a number of prepregs to the desired thickness. The resulting plate was hot pressed and cured at 180°C for 4 h, followed by a postcure at 280°C for another 2 h [ 41. On curing, the binder precipitated into a crosslinked polymeric structure. It was then infiltrated with Dow Coming DC2 104 silicone laminating resin. The edges of the plates are parallel to the two orthogonal directions of the fibre in the fabric.
All the room-temperature tests were carried out on an MTS 8 10 servohydraulic machine using a four-point bending fix- ture. The nominal size of the flexural strength and fatigue specimens was 40 mm X 3 mm X 4 mm. The size of the frac- ture toughness specimens was 38 mm X 6 mm X 4 mm. Spec- imens were cut with a diamond-impregnated saw at O”, 22.5” and 45” to one of the plate edges. These different specimen orientations will be referred to as specimen directions.
The flexural strength test essentially followed the CNS 1270 1 standard [ 71. The inner and outer spans for four-point bending were 10 and 30 mm, respectively. To understand the effect of in-plane and out-of-plane loading on flexural strength, the transverse bending load has respectively been applied nomlal to the plane of the fabric (denoted as the N direction) and parallel to the plane of the fabric (P direction). These different modes of loading will be referred to as dif- ferent loading directions. Flexural tests for each combination of specimen direction and loading direction were repeated on
10 specimens.
Fracture toughness tests were carried out under P-direction loading. A starter notch extending 30% of the specimen width was cut in every fracture toughness specimen with a 127 mmX0.4 mm diameter diamond saw. The notch tip is roughly circular, with a root radius m 0.2 mm. The above specimen sizes were chosen so as to be compatible with existing grips and the furnace for high-temperature tests. To guard against the existence of size effects, larger fracture toughness specimens ( 76 mm X 14 mm X 4 mm) have also been tested. The notched toughness tests for each specimen size and orientation were repeated on five specimens.
Fatigue tests were carried out under P-direction loading using the same gripping fixture as the flexural tests. Sinus- oidal loading of 20 Hz and a stress ratio (minimum load/ maximum load) of 0.1 have been employed. A test was dis- continued if the specimen survived 10’ cycles of loading. The load versus load-line displacement data were recorded inter- mittently to allow the specimen stiffness variations over the loading history to be deduced.
Fracture toughness tests normally employed starternotches as cut by the saw. To evaluate possible conservative effect associated with blunt starter notches, fatigue pre-cracking has been employed in a limited number of 0” specimens. Pre- cracking was carried out under four-point bending with the starter notch facing a tensile load. The pre-cracking load was chosen to give a nominal fatigue life of 10’ cycles in the
vicinity of the notch tip as follows: the cyclic stress for the required fatigue life was first estimated from the fatigue test results; the load to produce such a stress at a distance 0.4 mm (twice the notch root radius) ahead of the notch tip was then calculated using a notch stress distribution formula suggested in Ref. [8]. Since no macroscopic crack was normally observed after lo5 cycles, a considerably larger number of pre-cracking cycles have also been employed.
Tests under 200 and 500°C were carried out with an Instron screw-type machine equipped with a furnace. The specimens were preheated and kept at the testing temperature for 5 min before loading commenced to ensure a uniform temperature distribution within them. The number of tests carried out under these higher temperatures were limited due to the limited availability of material.
3. Results and discussion
3.1. Flexrwal strength
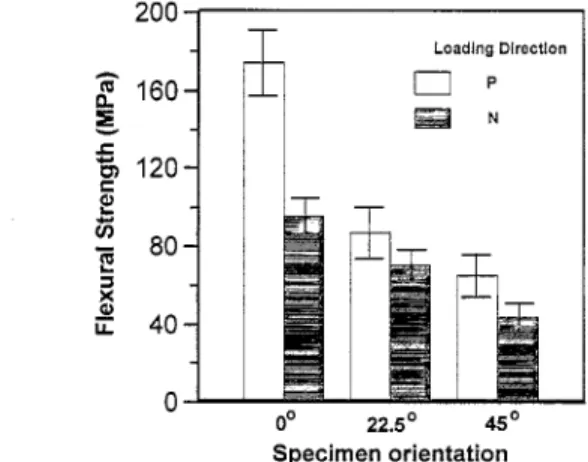
Fig. 1 shows the average flexural strength data together with the standard deviations for different specimen and load- ing directions. For the same specimen direction, the strength is lower when the applied loading is normal to the plane of woven fabric (N direction) than parallel (P direction) to it. If the loading direction is fixed, the flexural strength decreases as the angle between the specimen axis and the reference weaving direction increases. Fig. 2 compares the typical load versus load-point displacement behaviour under P- and N- direction loading. Both load-displacement traces have a roughly equal initial linear stage. Following this, the slope of the load-displacement trace under N-direction loading tends to decrease and lag behind that of the P direction. On reaching the maximum load, a considerable amount of deformation occurred under N-direction loading. During this period, the applied loading dropped gradually before final fracture took place. Under P-direction loading, the specimen reached a
200 z 160 z. .c El 120 5 R i 80 5 iI L 40 0 O0 22.5’ 45” Specimen orientation
Fig. 1. Flexural strength for different specimen and loading directions at room temperature (error bars represent the standard deviations of the corresponding data).
CS. Shin, J.B. Wang /Maren’& Chmistty and Physics 55 (1998) 94-101
0.5 1
Loading-Point Displacement (mm) Fig. 2. Comparison of load vs. load-point displacement behaviour P- and N-direction loading.
Fig. 3. Local delamination defects (arrows) in N-direction loaded specimen.
higher maximum load. The load then dropped abruptly on the occurrence of fracture.
Examining the sides of the N-direction-loaded specimens revealed extensive local delamination voids (Fig. 3). In some layers these local voids joined up to produce the delamination of a complete layer. Under the same magnification, local delamination voids were not evident in the P-direction-loaded specimens. The latter typically failed by fracture into two segments and macroscopic damage appeared to be mainly in the vicinity of the fractured area.
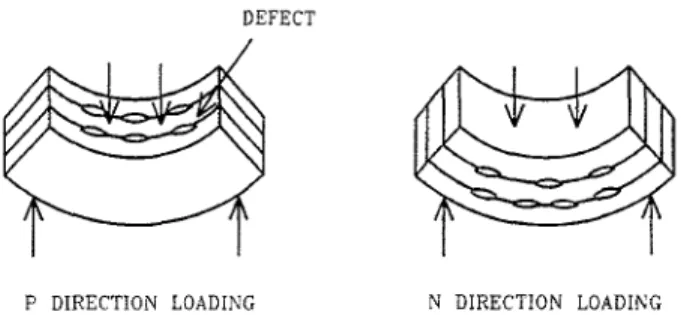
Rief and Kromp [9] have explained the observed local delamination damage of laminated composites using a ‘stack model’ based on the beam theory. Their explanation can be applied to the current case and is better expounded schemat- ically by Fig. 4. Under the four-point bending configuration, classical beam-bending theory predicts that shear force will develop in the region between the inner and outer loading points. The plane of action of this shear force is parallel to the interface between the fabric and the matrix when the specimen is under N-direction loading. If the interfacial bond- ing between fabric layers is weak and contains defects as shown, this shear force will favour the growth of interfacial
DEFECT
P DIRECTION LOADING N DIRECTION LOADING Fig. 4. Schematic comparison between the effect of different loading directions on incompletely bonded layers.
defects, leading to extensive local delamination voids. In the meantime, this shear force will also bring about localized relative sliding between the delaminated surface, giving rise to a considerable amount of bending deformation prior to complete fracture. As the degree of local delamination devel- ops, the flexural rigidity of the specimen drops continuously. This gives rise to the phenomenon that the applied loading remains more or less steady while a large amount of defor- mation is occurring. In the P-direction-loaded specimens, the shear force is not acting on the interfacial planes and so little damage occurs until the specimen is near to fracture. This schematic comparison helps to explain the observed differ- ence in flexuraf behaviour between the P- and N-direction- loaded specimens.
A tentative explanation for flexural strength decreases as the specimen orientation angle increases runs as follows: for the 0” specimens under bending, the tensile bending stress is parallel to yarns running along the specimen length direction. This stress is basically carried by yarns in this direction. As the specimen axis makes an angle with the reference weaving direction, the yams are less efficient in carrying the applied stress. The brittle matrix is then subjected to a higher stress and is more susceptible to cracking. Once matrix cracking becomes widespread, the fibres are more prone to breakage. This phenomenon will be promoted by increasing the off- axis angle up to a maximum of 45”. This may explain the phenomenon of decreasing flexural strength when the speci- men axis make an increasing angle with the reference weav- ing direction.
Figs. 5 and 6 present average flexural strength results with standard deviations at 200 and 500°C for some of the speci- men orientations under P- and N-direction loading. It can be seen that there is no deterioration in strength up to 200°C. Serious strength degradation is evident at 500°C. Even then, the material still possesses a strength of 60 MPa at 0” under P-direction loading.
Shin and Wang [ lo] reported the 0” room-temperature flexural strength of the same material under P-direction load- ing without resin infiltration treatment as 113.1 i 9.8 MPa. Infiltration treatment raised the flexural strength by about
50%.
The above results suggest that component design can make use of the optimum orientations to derive the best possible strength. Besides, for sample mechanical-property testing,
C.S. Shin, J.B. Wang/Materials Chemistyv and Physics 55 (1996) 94-101 97
Specimen orientation
Fig. 5. Flexural strength for diffcrcnt specimen directions at different tem- peratures under P-direction loading (error bars represent the standard devi- ations of the corresponding data).
O0
1
22P 45O
Specimen orientation
Fig. 6. Flexural strength for different specimen directions at different tem- peratures under N-direction loading (error bars represent the standard devi- ations of the corresponding data).
one should be careful to simulate the correct spec-imen ori- entation and loading direction to get the correct result. 3.2. Fracture toughness
Fig. 7 shows the average and standard deviation of fracture toughness for the three specimen orientations at room tem- perature, 200 and 500°C. At room temperature, the 0” speci- mens have the highest toughness while the 22.5” and 45” specimens have roughly the same values. Room-temperature fracture toughness for the large 0” specimens is the same as that for the corresponding small specimens and so a size effect did not occur with the current specimen dimensions. Raising the temperature to 200°C increased the scatter in toughness data. For the same specimen direction, the scatter range of the room-temperature toughness data overlapped and was even totally within that at 200°C. On raising the testing tem- perature further to 5OO”C, the fracture toughness in all three orientations dropped significantly.
Observation of the specimens during room-temperature testing showed that a damage zone ahead of the starter notch was seen instead of a clear macroscopic crack just before final
25 -z 4 20 % 2 15 E c g B 10 : ij 5 e u 0 O0 22.P 45O Specimen orientation
Fig. 7. Fracture toughness for different specimen directions at different temperatures under P-direction loading (error bars represent the standard deviations of the corresponding data).
fracture. Fig. 8 compares the typical room-temperature frac- tured specimens of the three different orientations. In each orientation, the overall fracture has a clear tendency to occur along one of the fibre directions (indicated by feathered arrows in Fig. 8). As a result, the major fracture directions make angles of 90”, 67.5” and 45”, respectively, with the specimen axis in the O”, 22.5” and 35” specimens. In the 22.5” and 45” specimens, the appearance of the pulled-out fibres (indicated by curved arrows in Fig. 8) suggested that the separation of specimens also occurred at an angle orthogonal to the predominant fracture directions (i.e., along the other fibre direction) in some layers of fabric. This tendency decreases as the testing temperature was raised. At 500°C the fracture appeared to be relatively more brittle in that a well- defined macroscopic crack was visible. The crack growth directions were also along one of the fibre directions and were quite uniform through the thickness in this case.
In fibre-reinforced composites, two important toughening mechanisms are crack bridging by fibres [ 1 l-151 and fibre pull-out [ E-171, In the former, unbroken fibres behind the crack tip restrain the opening of the crack. In the latter, fibre fracture occurs inside the matrix instead of on the plane of the matrix crack. Crack opening involves the pulling out of the broken fibre from the matrix and work must be done to overcome the frictional force between fibre and matrix. In woven fabric, additional friction occurs at the cross-over points between the warp and fill [ 181. Both mechanisms reduce the crack driving force and thus increase the fracture toughness. Fig. 9(a) and (b) shows a typical fracture surface revealing the pulled-out fibres. From the action of fibre in the above two mechanisms, it is reasonable to deduce that given the same loading direction, the effectiveness of toughening will decrease as the fibres make an increasing angle with the specimen axis.
On the other hand, in a homogeneous isotropic material, it has been shown that under the same external loading, a mode I crack deflected from its perpendicular-to-load-axis direction will suffer a reduction in crack driving force [ 15,19-211 .The amount of reduction will increase with the degree of deflec-
98 C.S. Shin, J.B. Wmg/Mareriols Chemirrry and Physics 55 (1998) 94-101
Fig. 8. Macroscopic views of the broken 0, 22.5 and 45” fracture toughness specimens showing the respective fracture directions (feathered arrows) and pulled-out fibres (curved arrows indicate some pulled-out fibres in directions perpendicular to the fracture directions).
tion. In other words, a specimen with a deflected crack will appear tougher. The same effect is expected to exist in the current composite. As the crack has a tendency to grow along one of the fibre directions, the apparent toughness increase will be the highest in the 45” specimens.
As a result, the toughening effects of fibre bridging/pull- out and crack deflection have opposite trends for the differ- ently oriented specimens. This may in part explain the observation that fracture toughness drops from 0” specimens to 22.5” specimens and then rises slightly but consistently in the 45” specimens at all three temperatures tested. More work is needed to clarify the mechanisms that lead to toughness drop in the 0” specimens but toughness rise in 22.5” and 45”
Fig. 9. (a) Low- and (b) high-magnification photographs of a typical fracture surface showing fibre pull-out.
specimens when the testing temperature changed from room temperature to 200°C.
It is interesting to note that without the infiltration of sili- cone resin, the 0” specimens have a room-temperature tough- ness of 8.5 i 0.6 MPa m1’2 [ IO], which is very close to that of the infiltrated 0” specimen at 500°C. Apparently the resin helps to bind the fibre to the matrix and increase the frictional resistance to fibre pull-out. At 500°C, the resin may have vaporized or disintegrated and so the toughness value drops to that of the uninfiltrated case. It would be useful to carry out high-temperature tests for the uninfiltrated specimens to understand the contribution of resin infiltration better.
The above variation in toughness in different directions with testing temperature suggests that if a notch or a change in cross-sectional geometry has to be put into a component, the optimum direction in which this stress concentration should lie depends on the operating temperature.
The above fracture toughness tests were carried out on notched specimens. Several 0” specimens pre-cracked by cyclic bending for different numbers of cycles have also been tested at room temperature. We expect the existence of a sharp crack will lower the measured toughness
C.S. Shin, J.B. Wang/Materials Chentistv and Physics 55 (1998) 94-101
16 - ; .--_ -__
, I I
OEtO SE+6 lE+6 2E+6 2E+6
No. of precracking Cycles
Fig. 10. Comparison of measured fracture toughness under different numbers of fatigue pre-cracking cycles.
Fig. 10 compares the fracture toughness of the pre-cracked specimens with that of the notched specimens. Although all the pre-cracked toughness values lie within the scatter band of the notched toughness values, all except the one under- going 10 000 pre-crack cycles have toughness values higher than the average notched toughness value. Close observation of the specimen undergoing 200 000 cycles revealed a num- ber of microcracks initiating from the notch tip (Fig. 11). Apparently, the increase in crack driving force due to the existence of a sharp crack is offset by the occurrence of multiple crack initiation [ l-5,22,23]. Although cracks are not observed in all the pre-cracked specimen surfaces, it is rea- soned that such multiple initiation may still have occurred at notch tip positions through the thickness, giving rise to the higher-than-average fracture toughness. For a small number of load reversals, such multiple initiation may not have fully developed and so the specimen undergoing 10 000 loading cycles did not give an above-average toughness value. 3.3. Fatigue strength
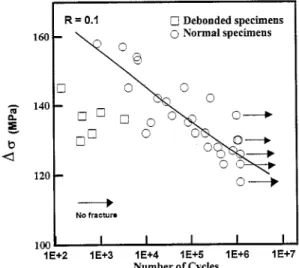
The S-N curve of the P-direction specimens is shown in Fig. 12. The fatigue strength is about 120 MPa. There is considerable scatter in data. It was observed that marked delamination failure occurred at an early stage in specimens with exceptionally low fatigue lives. Disregarding these delaminated specimens (square symbols in Fig. 12)) the data fall into a more reasonable scatter band, the average of which may be described by
where Aa is the stress range in MPa and N is the number of cycles to failure.
One commonly used approach to quantify the degree of fatigue damage in fibre-reinforced composites employs the degradation of specimen stiffness [ 24-291. This is reasona- ble, as in the course of fatigue damage, localized debonding,
Fig. 11. Multiple crack initiation at notch dp under 200 000 fatigue pre- cracking cycles.
R = 0.1 0 Debonded specimens
160 - 0 Normal specimens
1
I- NO tnctun
ml
lE+2 I E+3 lE+4 lE+5 lE+6 I!37 Number of CyclesFig. 12. Room-temperature S-N curve for 0” specimens under P-direction loading.
delamination, fibre breakage and matrix cracking will develop [30] and increase in extent. This will result in a gradual decrease in specimen stiffness. Specimen stiffness can be deduced from the load versus load-point displacement curve during fatigue testing. Fig. 13 shows part of the devel- opment of the load versus load-point displacement traces from a typical fatigue specimen. Two commonly used meas- ures of stiffness are exemplified in this Figure. These include the initial elastic modulus (line BC in Fig. 13) [26] and the fatigue modulus (line OA in Fig. 13) [ 291.
In the current work, it was found that the loading rollers made dents in the specimens during the initial stage of cyclic loading. Roller indentations quickly became saturated after a few hundred loading cycles. The initial rapid changes in mod- uli associated with the development of these indentations were not relevant to the bulk fatigue damage. Moreover, in all the fatigue tests, it was observed that the initial elastic stiffness for any loading cycle (e.g., line BC in Fig. 13) was significantly lower than that observed at the remaining part of the cycle. This low initial stiffness may be attributed to the loose damaged material beneath the indentations and so does
100 C.S. Shin, J.B. IVung/Marerinls Chemisrty and Physics 55 (1998) 94-IUI
Fntigw modulus - Initial l Iastic mcdulus
_---- Unlerding modulus 2000 - 1500 - 1000 - 600 - I I I I 0.0 0.4 0 0.8 1.2 Dlsplacement(mm)
Fig. 13. Typical development of load vs. load-point displacement traces during fatigue testing showing the definition of fatigue modulus (line OA), initial elastic stiffness (line BC) and unloading stiffness (line AD).
not represent the bulk stiffness of the specimens. For this reason, the unloading stiffness (line AD in Fig. 13) was monitored instead.
Figs. 14 and 15 show respectively the change in the fatigue modulus and the unloading modulus during fatigue tests for some specimens. Both moduli were normalized to the cor- responding moduli at the thousandth loading cycle. The mod- uli at the first cycle were not used for normalization to avoid inaccuracy associated with the roller indentation phenome- non mentioned above.
The fatigue modulus decreases continuously as the cycle number increases (Fig. 14)) while in the unloading modulus, ripples up and down are superimposed on an essentially downward trend (Fig. 15). Physically the fatigue modulus reflects the sum of cumulative specimen extension as well as the extension due to the current loading cycle, while the unloading modulus only reflects the latter. Instantaneous extension values due to the current cycle are subjected to some degree of scatter, giving rise to the ripples in Fig. 15. Conversely, the cumulative extension is far greater than the instantaneous one and so Fig. 14 is comparatively free from ripples.
If screening criteria for fatigue integrity of the specimens are to be chosen for these two moduli, a lower-bound nor- malized fatigue modulus of 0.85 can be safely taken. This lower bound appears to be reasonable forthe shorter-lifecases ( < 1 O5 cycles), but may be too conservative for the long-life cases. On the other hand, a lower-bound normalized unload- ing modulus of 0.9 may be chosen as a fatigue integrity screening criterion. The conservative margin of this latter criterion is tight for the shortest-life specimen here but is reasonable for the other five cases. In particular, this screening criterion will not be overly conservative for the long-life specimens as is the case for fatigue modulus. This preliminary study suggests that structural integrity under cyclic loading
- . I
lE+3 lE+4 lE+5 1 E+6 1 E+7 Number of Cycles
Fig. 14. Change in the fatigue modulus during fatigue tests.
J
1 E+3 lE+4 lE+5 1 E+6 1 B-7 Number of Cycles
Fig. 15. Change in the unloading modulus during fatigue tests.
can be monitored if the stiffness change at a damage-prone region is tracked. This topic is worth more thorough inves- tigation and verification on different specimen and compo- nent geometries.
4. Conclusions
The flexural strength, fracture toughness and fatigue prop- erties of a low-temperature-cured glass-fabric-reinforced alumina composite has been investigated. A number of con- clusions can be drawn:
( 1) The flexural strength is higher when loading is applied parallel to the plane of fabric rather than normal to it. This may be explained by the different degrees of shear stress acting on interfacial defects under the two loading directions. Also, the flexural strength decreases as the angle between the specimen axis and the reference weaving direction increases from 0 to 45”. This suggests that component design can make use of the optimum orientations to derive better strength.
Besides, sample mechanical-property testing should pay attention to employ the correct specimen orientation and to apply the relevant loading direction.
(2) The flexural strengths at 200°C are similar to that at room temperature. The material can still be used at 500°C at a reduced yet still usable flexural strength.
(3) At all three temperatures tested, the fracture toughness of the 0” specimens is the highest; that of the 35” specimens is slightly better than that of the 22.5” specimens. The relative toughness magnitudes of the three specimen orientations change under different testing temperatures, suggesting the interaction of mechanisms which include fibre pull-out and crack deflection. These toughness results indicate that the optimum direction to put a stress concentration in a compo- nent depends on the operating temperature.
(4) The fracture toughness of pre-cracked specimens is higher than that of the notched specimens. This is attributable to multiple crack initiation in the former case.
(5) The fatigue strength under P-direction loading is about 120 MPa. Structural integrity under cyclic loading can be tracked and monitored using suitable bounding values for the fatigue modulus or unloading modulus. To this end, provision for measuring the material stiffness should be considered during the component design stage.
Acknowledgements
The authors are grateful to the Materials R&D Center, CSIST, and in particular Dr C.C. Young and Mr Y.P. Hwang for providing the test material and other necessary aids to make this work possible.
References
[I] M.F. Ashby, Materials Selection in Mechanical Design, Pergamon Press, Oxford, UK. 1992.
[2] SE. Hsu, J.C. Chen, J.F. Chang,B.J.Weng,D.G.Hwang, W.Y. Chen, High temperature organic and ceramic hybrid composite, Proc. National SAMPE Technical Conf., 1989, vol. 21, pp. X03-81 1. [3] S.E. Hsu, H. Liu, C.H. Liu, J.C. Chcn, D.G. Hwang, W.Y. Chen, C.I.
Chen, J.F. Chang, High temperature behaviour of the innovation car- bon/CSPI composite, Proc. National SAMPE Symp. and Exhibition,
1990. vol. 35, part 1, pp. 132-146.
[ 4 I A phosphate based ceramic matrix composite and its fabrication, Tai- wanPatentNo. 162 158 (1991).
I51 A. Kelly (Ed.), Concise Encyclopedia of Composite Materials, Per- gamon Press, Oxford, UK, 1989.
[ 61 R.A. Naik, Failure analysis of woven and braided fabric reinforced composites, J. Composite Materials 29 ( 1995) 2334-2363. 171 Standard testing procedures for measuring the flexural strength of
engineering ceramics, CNS 12701, National Bureau of Standards, Taiwan. 1990. 181 I91 [lOI 1111 1121 [I31 1141 1151 1161 [I71 r181 1191 1201 [211 1221 ~231 1241 1251 1261 1271
C.S. Shin, K.C. Man, CM. Wang, A practical method to estimate the stress concentration factors of notches, Int. J. Fatigue 16 (1991) 242- 256.
C. Rief, K. Kromp, A new model to describe the damage in a laminated carbon ftbre reinforced carbon composite, in: A.M. Brandt, I.H. Mar- shall (Eds.), Brittle Matrix Composites 2, Proc. 2ndInt. Symp. Brittle Matrix Composites (BMC?), Cedzyna, Poland, 1988, pp. 108-l 17. C.S. Shin, Y.Y. Wang, Investigation on the mechanical properties of some toughened ceramics matrix composites, Tech. Report CS 84. 0210-D-002-029, National Science Council, Taiwan, 1995. D.B. Marshall, B.N. Cox. A.G. Evans, The mechanics of matrixcrack- ing in brittle-matrix fibre composites, Acta Metallurgica 33 ( 1985) 2013-2021.
D.B. Marshall, B.N. Cox, Tensile fracture of brittle matrix composites: influence of fiber strength, Acta Metallurgica 35 (1987) 2607-2619. M.D. Sensmeier, P.K. Wright. The effect of fibre bridging on fatigue crack growth in titanium matrix composites, in: P.K. Liaw, M.N. Gungor (Eds.), Fundamental Relationships between Microstructures and Mechanical Properties of Metal Matrix Composites, The Miner- als, Metals and Materials Society, 1990, pp. 441-157.
Y.C. Chiang, A.S.D. Wang, T.W. Chou, On matrix cracking in fiber reinforced ceramics, J. Mech. Phys. Solids 41 ( 1993) 1137-l 154. R.O. Ritchie, Mechanisms of fatigue crack propagation in metals, ceramics and composites: role ofcrack tip shielding, Mater. Sci. Eng. A103 (1988) 15-28.
A.G. Evans, R.M. McMeeking, On the toughening of ceramics by strong reinforcements, Acta Metallurgica 34 ( 1986) 2435-2441. P.F. Becher, C.H. Hsueh, P. Angelini, T.N. Tiegs, Toughening behav- iour in fiber-reinforced ceramic matrix composites, J. Am. Ceram. Sot. 71 (1989) 105C-1061.
N. Pan, Analysis of woven fabric strengths: prediction of fabric strength under uniaxial and biaxial extension, Comp. Sci. Technol. 56 (1996) 311-327.
S. Suresh, Micromechanisms of fatigue crack growth retardation fol- lowing overloads, Engng. Fracture Mechanics 18 ( 1983) 577-593. K.T. Faber, A.G. Evans, Crack deflection process, Acta Metallurgica 31 (1983)565-576.
Y.C. Chiang. Crack deflection by rod-shaped inclusions, J. Mater. Sci. 27 (1992) 68-76.
A.G. Evans, Y. Fu, Some effects of microcracks on the mechanical properties of brittle solids, Acta Metallurgica 33 (1985) 1525-
1531.
T. Kishi, M. Enoki, Quantitative evaluation of microcracking in alloys and ceramics, in: K. Iida, A.J. McEvily (Eds.), Advanced Materials for Severe Service Application, Elsevier Applied Science. Amster- dam, 1987, pp. 61-76.
H.T. Hahn, R.Y. Kim, Fatigue behavior of composite laminates, J. Composite Mater. 10 (1976) 156-180.
T.K. O’Brien, K.L. Reifsnider, Fatigue damage evaluation through stiffness measurements in boron+poxy laminates, J. Composite Mater. 15 ( 1981) 55-70.
A. Poursatip, M.F.A. Ashby, P.W.R. Beaumont, The fatigue damage mechanics of a carbon fibre composite laminates: I - development of the model, Composites Sci. Technol. 25 ( 1986) 193-218.
A. Poursatip, P.W.R. Beaumont, The fatigue damage mechanics of a carbon ftbrr composite laminates: II - life prediction, Composites Sci. Technol. 25 ( 1986) 283-299.
[28] W. Hwang, KS. Han, Fatigue of composites - fatigue modulus con- cept and life prediction, J. Composite Mater. 20 ( 1986) 154-165. [29] W. Hwang, KS. Han, Fatigue of composites materials - damage
model and life prediction, in: P.A. Lagace (Ed.), Composite Materi- als: Fatigue and Fracture, vol. 2, ASTM STP 1012, American Society for Testing and Materials, Philadelphia, 1989. pp. 87-102.
[30] R. Talreja, Fatigue of composite materials: damage mechanisms and fatigue life diagrams, Proc. Roy. Sot. London, Series A 378 (1981) 461475.