國立交通大學
工學院
聲音與音樂創意科技碩士學位學程
碩士論文
音樂情緒及其腦電波頻譜動態之探討
Exploring EEG Spectral Dynamics of Music-Induced
Emotions
研 究 生:葉人慈
指導教授:林進燈 博士
黃志方 博士
音樂情緒及其腦電波頻譜動態之探討
Exploring EEG Spectral Dynamics of Music-Induced
Emotions
研 究 生:葉人慈
Student:Ren-Cih Ye
指導教授:林進燈
Advisor:Chin-Teng Lin
黃志方
Chih-Fang Huang
國 立 交 通 大 學
工學院聲音與音樂創意科技碩士學位學程
碩 士 論 文
A ThesisSubmitted to Master Program of Sound and Music Innovative Technologies College of Engineering
National Chiao Tung University in partial Fulfillment of the Requirements
for the Degree of Master in Engineering July 2011 Hsinchu, Taiwan
中 華 民 國 一 百 年 七 月
i
音樂情緒及其腦電波頻譜動態之探討
研究生:葉人慈 指導教授:林進燈博士 黃志方博士 國立交通大學工學院聲音與音樂創意科技碩士學位學程摘 要
本研究使用 Vieillard 等人所設計出的 56 個可以引發情緒的音樂片段,分析其 MIDI 音樂以得到音樂特徵;在實驗中,請 17 位受測者聆聽這些音樂並為自己聽音樂的情緒 作二個維度的評量:正負向(valence)與強弱向(arousal);同時並量測受測者的腦 電波(Electroencephalography),以探討聽音樂時的腦電波頻譜動態現象。本研究中 使用 Gomez 與 Danuser 的迴歸方式,歸納五個音樂特徵與受測者的自我情緒評量之間的 關係。音樂特徵分析的結果顯示,不同音樂特徵與聽者的情緒存在某些相關性,例如大 調的音樂使人有正向感覺、小調的音樂則令人感到低落;音樂速度的快慢也影響聽者情 緒的激昂或平靜。但較複雜的音樂特徵,例如節奏、旋律變化甚至和聲組成,則較難用 簡單的音樂計算得到有效的情緒音樂特徵。本研究將聽音樂時的腦電波分為 5 個頻帶 delta (1~3 Hz), theta (4~7 Hz), alpha (8~12 Hz), beta (13~30 Hz), 及 gamma (31~50 Hz),並先以獨立成份分析(ICA)分出不同訊號源,再依訊源特徵對訊號分群,所得的腦 波訊號大小(EEG power)再經 ANOVA 分析,檢驗特定腦區頻帶的作用是否與受測者的 情緒正負向或情緒強弱有關係。研究發現,大腦的前額葉,特別是兩側腦半球現象的不 對稱性,在左邊 alpha 及右邊 gamma 頻帶都分別與情緒的正負向相關;而在額葉中線的 alpha、左側軀體運動區的 delta 以及枕葉區的 theta 頻帶都分別發現與情緒強度相關 的現象。由本研究可再次證實,大腦兩邊的不對稱現象是情緒正負趨向的指標;而大腦 在許多區域都對聽音樂引發的情緒有反應。關鍵字:情緒、音樂特徵、情緒正負向、情緒強弱向、腦電波、獨立成份分析 、頻譜 動態、不對稱性
ii
Exploring EEG Spectral Dynamics of Music-Induced Emotions
Student: Ren-Cih Ye
Advisor: Dr. Chin-Teng Lin
Dr. Chih-Fang Huang
Master Program of Sound and Music Innovative Technologies National Chiao Tung University
Abstract
Vieillard et al. (2008) has designed 56 emotional musical excerpts that convey four different emotions. The MIDI formats of the musical excerpts were analyzed to obtain their musical features. In addition, 17 participants were invited to listen to the musical excerpts and to assess their emotions by two evaluative dimensions: positive/negative valence and high/low arousal. The regression model developed by Gomez and Danuser was used to discover the relationships between the assessments by the participants and the five musical features. The result of the musical feature analysis indicated a correlation between musical features and the emotions of the listener. For example, major musical keys created positive feelings, minor musical keys created depressed feelings, and music tempo made the participants feel excited or peaceful. Rhythm, melody, and harmony (i.e. more complex musical features) were rather difficult to calculate with simple musical features to determine the relationship of complex musical features with emotional state. In part two of the study, the participants’ electroencephalography (EEG) was measured while they listened to musical excerpts to investigate their EEG spectral dynamics. The five frequency bands for EEG were delta (1~3 Hz), theta (4~7 Hz), alpha (8~12 Hz), beta (13~30 Hz), and gamma (14~50 Hz). First, the Independent
iii
Component Analysis (ICA) was completed to distinguish the source of different signals. Then, all signals were classified based on the feature of the sources. The obtained EEG power of the signals was analyzed with ANOVA to determine if frequency bands of specific brain regions were related to participants’ positive/negative valences and high/low arousals. The results demonstrated that the frontal lobe was characterized by hemispheric asymmetry with the left-frontal alpha and the right-frontal gamma indicating a relationship with positive/negative valences. Furthermore, the frontal midline alpha, the left somatomotor delta, and the occipital theta were found to be related to high/low arousal. This study reaffirmed the phenomenon of hemispheric asymmetry as a good indicator for positive/negative valences. Furthermore, responses of many brain regions have an observable relationship with music-induced emotions.
Keywords: emotion, musical feature, valence, arousal, Electroencelography (EEG), independent component analysis (ICA), spectral dynamic, asymmetry
iv
Acknowledgement
致 謝
三年前炎熱的暑假,一通電話把我從去臺北的心拉了回來,從此就進入了交大。第 一次跟兩位老師 meeting 的情景與心情依然在心頭迴盪,到如今可以完成碩士學位,真 感謝指導老師 林進燈教授及 黃志方教授,讓我在聲音與音樂創意科技碩士學位學程 (SMIT)這個特別的環境中受益良多,從基本而深奧的聲學、音樂理論,到各種聲音工程 領域的基本知識,令我大開眼界。 尤其是能夠在國際頂尖的研究環境──交大腦科學研究中心(BRC)裡面學習,更是 人生中一個難忘而特殊的經歷。老師讓我們在充分的研究資源中,為認知、神經科學的 研究盡一份心力。也感謝中心裡的柯立偉學長、陳世安學長等多位前輩不時給我研究上 的建議,以及青甫、俞凱、鈞翔、冠智等學長姐在生活及研究中的提點,更有研究夥伴 Apple、Lala、謹譽與勝弘,以及祈翔、昱駿、幸育的陪伴,還有學弟妹們群樹、哲維、 潔明、耀隆……還有 BRC 的助理……好多人的支持,讓我在這段時光中充滿歡笑和回憶。 黃老師的音樂造詣令人難忘,在音樂科技實驗室中,感謝向斌、宏儒、欣名學長, 毅凡、怡瑩、尹均、鶴雄同學,以及舒方、季芳、為博等學弟妹的幫忙,也感謝 SMIT 的所有人,讓我的研究所生活更加多采多姿。 特別非常感謝美國 UCSD/中國醫藥大學的段正仁老師、UCSD/臺大/交大的林遠彬博 士,給我的研究充分的指導及全力的協助,使我能一步步完成論文。最後感謝家人及所 有幫助我與默默支持我的所有人。v
Table of Contents
摘 要 ... I ABSTRACT ... II ACKNOWLEDGEMENT ...IV TABLE OF CONTENTS ... V LIST OF TABLES ... VII LIST OF FIGURES ... VIIICHAPTER 1 INTRODUCTION ... 1
1.1. MOTIVATION ... 1
1.2. LITERATURE REVIEW ... 1
1.3. AIMS AND OBJECTIVES ... 2
CHAPTER 2 EXPERIMENTAL DESIGN ... 4
2.1. STIMULI ... 4
2.2. PRESENTATION ORDER OF STIMULI ... 4
2.3. EXPERIMENTAL ENVIRONMENT ... 5
2.4. EXPERIMENTAL PROCEDURE ... 5
2.5. SUBJECTS ... 7
2.6. EEGRECORDING... 8
CHAPTER 3 DATA ANALYSIS ... 9
3.1. MUSICAL FEATURE ANALYSIS ... 9
3.1.1. Musical features selection and evaluation ... 9
3.1.2. Affective space regression to musical features ... 9
vi
3.2.1. Analysis tools ... 10
3.2.2. Epoch Extraction ... 10
3.2.3. Independent component Analysis (ICA) and ICA Decomposition ... 12
3.2.4. Time-frequency transform and statistic for EEG data ... 13
CHAPTER 4 RESULTS ... 15
4.1. SUBJECTIVE RATINGS RELATED TO PRE-LABELED EMOTIONAL TYPES ... 15
4.2. SUBJECTIVE RATINGS REGRESSION TO MUSICAL FEATURES ... 17
4.3. RESULTS OF ICCLUSTERS ... 18
4.4. RESULTS OF EEG SPECTRAL DYNAMICS ANALYSIS ... 19
CHAPTER 5 DISCUSSION ... 23
5.1. MUSICAL FEATURES AND AFFECTION ... 23
5.2. EEG ACTIVITIES FEATURES ... 26
5.3. THE LIMITATION OF THIS STUDY ... 28
CHAPTER 6 CONCLUSION ... 29
REFERENCES ... 31
APPENDIX I IC CLUSTERS RESULTS ON INDIVIDUAL COMPONENTS ... 34
APPENDIX II MUSICAL FEATURES EVALUATION ... 44
APPENDIX III INSTRUCTIONS OF EXPERIMENT ... 46
APPENDIX IV A LETTER OF CONCENT TO PARTICIPENTS ... 49
APPENDIX V QUESTIONNAIRE FOR PARTISIPENTS’ PROFILE ... 50
APPENDIX VI QUESTIONNAIRE AFTER EXPERIMENT ... 51
APPENDIX VII MENTAL ASSESSMENTS ... 52
APPENDIX VIIISUBJECTS’ PROFILES ... 54
vii
List of Tables
TABLE.1.THE AFFECTIVE RATINGS OF FOUR INITIATED EMOTION TYPES. ... 15
TABLE.2.MEDIANS OF THE ESTIMATED REGRESSION COEFFICIENTS ΒV(VALENCE), ΒA(AROUSAL), AND ΒVA(VALENCE × AROUSAL) FOR THE SIX MUSICAL FEATURES ... 17
TABLE.3.THE BASE INFORMATION ABOUT ICCLUSTERS ... 19
TABLE.4.THE OUTLINE OF IC CLUSTERS UNDER ANOVA SIGNIFICANT LEVEL ... 20
viii
List of Figures
FIG.1.THE CHART FOR EXPERIMENTAL PROCEDURE. ... 5
FIG.2.THE 9-SCALE-SAM(SELF-ASSESSMENT MANIKIN). ... 7
FIG.3.THE LAYOUT OF ELECTRODES ON THE EEG CAPS USED IN THE EXPERIMENTS. ... 8
FIG.4.THE CHART OUTLINES THE EEG PRE-PROCESSING STEP BY STEP. ... 11
FIG.5.AN EXAMPLE FOR EEG ARTIFACT OF THIS STUDY. ... 12
FIG.6.THE CHART OF THE TIME RELATIONSHIP OF AN EPOCH. ... 14
FIG.7.THE RADAR CHART INDICATE THE SUBJECTIVE RATING DISTRIBUTION OF IN FOUR INITIATE EMOTIONAL TYPES. ... 16
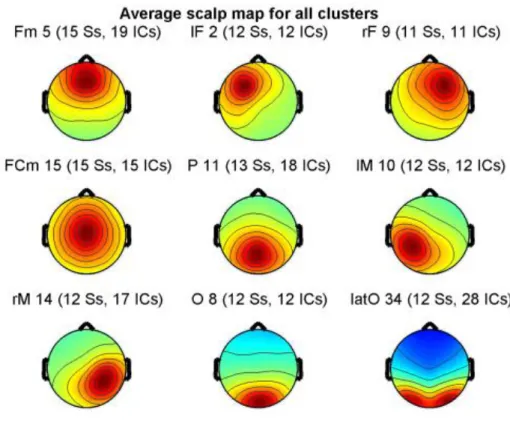
FIG.8.AVERAGE SCALP MAP FOR ALL CLUSTERS. ... 18
FIG.9THE AVERAGE POWER AND STANDARD DEVIATION OF CLUSTERS WITH SIGNIFICANT LEVEL (P<0.05). ... 22
FIG.10.THE FIVE FEATURES IN THE AFFECTIVE SPACE DEFINED BY VALENCE AND AROUSAL... 25
FIG.11.THE SCALP MAP, DIPOLE LOCATIONS, AND SPECTRA OF FRONTAL MIDLINE CLUSTER. ... 34
FIG.12.THE SCALP MAP, DIPOLE LOCATIONS, AND SPECTRA OF LEFT FRONTAL CLUSTER ... 35
FIG.13.THE SCALP MAP, DIPOLE LOCATIONS, AND SPECTRA OF RIGHT FRONTAL CLUSTER. ... 36
FIG.14.THE SCALP MAP, DIPOLE LOCATIONS, AND SPECTRA OF FRONTAL-CENTRAL MIDLINE CLUSTER. 37 FIG.15.THE SCALP MAP, DIPOLE LOCATIONS, AND SPECTRA OF PARIETAL CLUSTER. ... 38
FIG.16.THE SCALP MAP, DIPOLE LOCATIONS, AND SPECTRA OF LEFT MOTOR CLUSTER. ... 39
FIG.17.THE SCALP MAP, DIPOLE LOCATIONS, AND SPECTRA OF RIGHT MOTOR CLUSTER. ... 40
FIG.18.THE SCALP MAP, DIPOLE LOCATIONS, AND SPECTRA OF OCCIPITAL MIDLINE CLUSTER. ... 41
FIG.19.THE SCALP MAP, DIPOLE LOCATIONS, AND SPECTRA OF LATERAL OCCIPITAL CLUSTER. ... 42
1
Chapter 1 Introduction
1.1. Motivation
While human listening to music, their emotion can be influenced. Music can change emotions, release emotions. People enjoy or comfort themselves while listening to music [1, 2].
People listen to different types of music which can induce different
emotions. What composition of music can be used to induce specific emotion type was interesting to explore. Furthermore, besides the listener‟s
self-reports, the emotional bio-signals induced by music are also worth to investigating.
1.2. Literature review
Several researchers have explored the relationships between musical structure and perceived emotions [3, 4]. There are various studies on music affective characterization from acoustic features [5, 6]. In the study of Gomez & Danuser, published by Emotion(2007) [7], the relationships between
musical structure and felt emotions were investigated. They invited three musical experts to judged 11 musical features of all musical excerpts that would be listened in the experiment of their study. They used a regression model to figure out the relationship between musical feature and affections of subjects. The model could reveal that, for these subjects, some musical
2
feature settings would induce certain emotional states.
The autonomic nervous system (ANS) is excited during music listening. These reactions are similar to those shown to other emotional stimuli,
including changes in heart rate, skin temperature, electrodermal response, and respiration, etc. [8-12]. Besides ANS, the central nervous system (CNS), including brain, can provide informative characteristics in responses to the emotional states. In the brain research, listeners‟ responses to music involve regions of the brain that are known from previous research to be implicated in emotional responses, including thalamus, hippocampus, amygdale, prefrontal cortex, orbitofrontal cortex, midbrain/periaqueductal gray (PAG), insula, and nucleus accumbens [13-17]. The Electroencephalogrphy (EEG) is a
noninvasive measurement with temporal resolution in milliseconds. The studies using EEG to investigate the processing of emotion have shown some EEG evidence related to emotion. One of the common indicators is the anterior alpha-power asymmetry derived from the spectral differences
between a symmetric electrode pairs [18-20]. Other emotional EEG activities have been found in many regions, such as frontal, frontal-central, parietal areas [21-26]. Due to different experimental design, some findings from different studies have controversies [27].
1.3. Aims and Objectives
In this study, the pre-labeled 56 musical excerpts published by Vieillard et al. [28] were used in the musical feature analysis and listening tasks. All selected musical features were evaluated by computer, not by human
3
judgment. During music listening, subjects‟ 62-channel EEG signals were recorded simultaneously. Independent component analysis (ICA) was used to decompose the 62-channel EEG signals into temporally independent processes, whose sources originated from multiple brain regions, and power spectra were computed from the activation time course of each independent component. Finally, independent components with similar features, such as topographic maps, dipole sources, and power spectra, were grouped into clusters across subjects. Besides, subjects were ask to have self-reports for their feelings for listened musical excerpts.
This study aims to 1) figure out the relationship between affection and musical features according to subjective emotion ratings, 2) investigate the emotional EEG power responses during listening to music.
4
Chapter 2 Experimental Design
2.1. Stimuli
The stimuli were musical excerpts which were designed by Viellard and collaborators [28]. All excerpts were piano sounds. The duration of each excerpts ranged from 8 to 16 seconds (mean duration = 12.5 secs). According to the original study, these excerpts were labeled to four emotional types,
happiness, sadness, peacefulness and scary. Each type includes 14 excerpts. By the research of Viellard et al., in each emotional type, there are 4 excerpts which had lower confidence level, respectively, though we put these 16
excerpts in the latest session of our experiment.
2.2. Presentation order of stimuli
All excerpts except the 16 excerpts which had low confidence rating level were presented in early sessions. The 40 excerpts were sorted by each “mean valence + mean arousal” value which pre-rated by Viellard et al. and they were separated to four blocks, each had 10 excerpts. Of the 24 possible
arrangements of the four blocks, eight were selected, with the condition that each block had to be twice in first, second, third and fourth position. The order of the 10 stimuli within each block was randomly determined. The eight presentation orders were counterbalanced across subjects. This is done to guarantee a permissible emotional difference between stimuli as
5
regards affective ratings [29]. In the first two sessions, each one had 20 stimuli. In the latest session, the other 16 excerpts were presented in the random order.
2.3. Experimental environment
The experiment was run in a shielding room with a little light and
comfortable temperature. Each subject was seated in front of a 19-inch LCD monitor. Subjects were asked to follow the instructions displayed in the monitor and evaluate subjective ratings by mouse. They moved the mouse cursor and click one certain button to choose their answers. Musical
excerpts were played with an appropriate volume in a well covered earphone (TDH-49P, Telephonics).
2.4. Experimental procedure
6
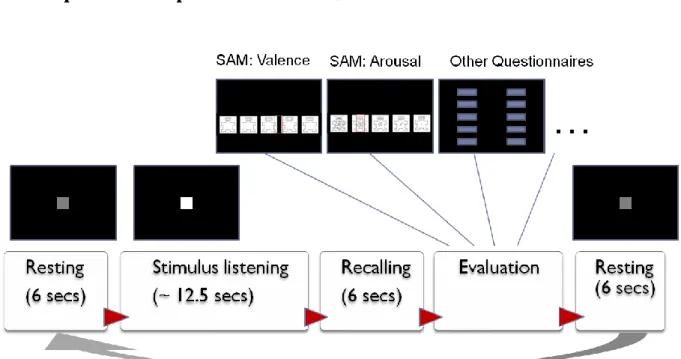
The experimental scenario was wrote and played in the software
Presentation (version 0.60, Neurobehavioral Systems). As the Fig. 1 shows, each musical excerpt was in one trial. The duration of excerpt was varied by each excerpt. Before and after each trial, there were fifteen seconds resting time, subjects had to sustain their physiological state in a steady condition until they were asked to evaluate their ratings. After each musical excerpts listening, the subjects had six second to recall the music that they had listened just before, and then, they were asked to evaluate their affections. The subjective valence and arousal ratings were evaluated through the modified 9-scale-SAM (Self-assessment manikin, [30], Fig. 2). The valence and arousal rating values were recorded as 1, 2, …, 9, respectively. Then other questionnaires, include adjectives come from the analysis for emotional responses [31], were answered, therefore, subjects were assured to fully engage in the musical listening. All questions had limited choices. The evaluation time was not limited though subjects were asked to response without too much thinking.
7
Fig. 2. The 9-scale-SAM (Self-assessment manikin): the top: the valence manikin; the bottom: the arousal manikin. In the experimental scenario, the valence and arousal manikin was played in sequence. The participates did not saw the number from 1 to 9 associated to each position, they just moved the red rectangle left or right with mouse to select their choice.
2.5. Subjects
Seventeen subjects were invited to this experiment. They all
voluntarily participated in this experiment and have signed a letter of consent. All subjects but one men were right-handed. They were undergraduate or graduate students in Hsinchu, Taiwan. Subjects were majored in different colleges but not in the music department. More details of subjects‟ profiles are in the Appendix VIII .
8
2.6. EEG Recording
The EEG data were recorded at 1000 Hz sampling rate from an electrode cap (Neuromedical Supplies 62-channel Quik-Cap) based on the international 10-20 system (Fig. 3), used a NeuroScan NuAmps amplifier with a band-pass filter (0.1 to 50 Hz). The reference channel, REF, was placed on the center of head (between Cz and CPz). The impedance of each electrode was ensured to be less than 10 k ohms before the EEG acquisition began.
Fig. 3. The layout of electrodes on the EEG caps used in the experiments.
Fpz AFz Fz C z C 2 C 4 C 6 T 8 C 5 C 3 C 1 T 7 C Pz Pz PO z O z Fp2 AF7 F8 FT 7 FT 8 F7 AF8 Fp1 T P8 P8 PO 8 O 2 O 1 PO 7 T P7 P7 C P1 C P3 C P5 C P2 C P4 C P6 P1 P2 P4 P6 P3 P5 PO 3 PO 4 FC 1 FC 2 FC 3 FC 5 FC 4 FC 6 F5 F3 F1 F2 F4 F6 AF3 AF4 FC z
9
Chapter 3 Data Analysis
3.1. Musical Feature Analysis
Each musical feature comes from dissecting the MIDI files of musical excerpts. All features were analyzed in MATLAB environment with the MIDI toolbox1.
3.1.1. Musical features selection and evaluation
Five musical features were analyzed in this study. They are mode, tempo, rhythm, pitch range and pitch level. These musical features were easy to be evaluated and were thought to be important features with related to emotions of human [7]. The evaluation of five features used the MIDI toolbox to analyze the MIDI information of each musical excerpt. The details were described in Appendix II .
3.1.2. Affective space regression to musical features
The analytic approach was used by Gomez et al. [7] to correlate the musical features with subjective ratings, valence and arousal, simultaneously. The musical feature model Y = + V + A + V*A was fitted by the
1 Eerola, T. & Toiviainen, P. (2004). MIDI Toolbox: MATLAB Tools for Music Research. University of Jyväskylä: Kopijyvä, Jyväskylä, Finland. Available at
10
M-estimator with Huber type psi function. V and A are the valence and arousal ratings evaluated by each subjects. Models were fitted by each subject separately. The coefficients were tested by Wilcoxon signed-ranked test against the null hypothesis of symmetry around zero. The coefficients were used if they are much different from zero, p < 0.05. The median of subjects‟ coefficients was used to figure out the correlation for affective space and musical features.
3.2. EEG Data Analysis
3.2.1. Analysis tools
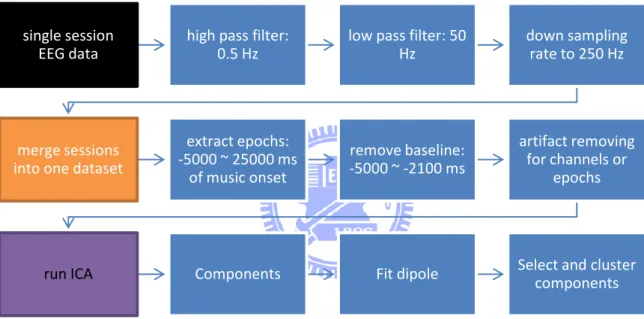
The EEG raw data were loaded to the MATLAB (7.4.0) environment and dealt with the EEGLAB toolbox (v6.03b). Most of calculation methods done to the EEG data in this study were followed to the EEGLAB functions [32]. The EEG pre-processing flow was shown in the Fig. 4. The three-session-EEG data were merged in the order of experimental procedure. The original EEG data were put into high-pass- and low-pass-filter, 0.1 ~ 50 Hz, and the
sampling rate was decreased from 1000 to 250 Hz.
3.2.2. Epoch Extraction
Each epoch was extracted from -5 sec to 25 sec, with the stimulus onset (zero sec) was set in the beginning of each musical excerpt. Some EEG artifacts caused entire epoch to be rejected. Such as big body movements
11
might result to big noisy signals through some channels, and, in some periods, a few electrodes lost skin contacts would make these channels to be useless in these periods. An example for artifact removal was in Fig. 5. In one epoch, if the artifacts occurred in the resting time (this period would be treated as baseline), or in the interesting period of this study (when musical excerpt was playing, or subject was recalling), this epoch would be rejected.
Fig. 4. The chart outlines the EEG pre-processing step by step.
single session EEG data
high pass filter: 0.5 Hz
low pass filter: 50 Hz
down sampling rate to 250 Hz
merge sessions into one dataset
extract epochs: -5000 ~ 25000 ms of music onset remove baseline: -5000 ~ -2100 ms artifact removing for channels or epochs
12
Fig. 5. An example for EEG artifact of this study. The left red rectangle indicate wide noisy signals that might be caused by big body movements; in the right side rectangle, there are single channel noise.
3.2.3. Independent component Analysis (ICA) and ICA Decomposition
The ICA was extensively applied to solve the problem of EEG source separation, identification and localization [33]. The ICA related functions in the EEGLAB toolbox were used to run the analysis. In the procedure of the ICA decomposition, the two-dimensional topographic scalp map which
indicates the activation weights distributed across electrodes for each independent component was generated for further judgment. Then, each interesting component was fitted dipole by the implemented functions of EEGLAB. After the EEG pre-processing of all subjects, the STUDY tool in the EEGLAB was used for clustering all useful components from all subjects. In
13
this study, the component scalp maps, dipoles and power spectra were measures for clustering. The clusters were generated by the K-means algorithm. Finally, some human manual re-assignment or rejections were performed to confirm that all dipoles in the same cluster were in a reasonable distribution.
3.2.4. Time-frequency transform and statistic for EEG data
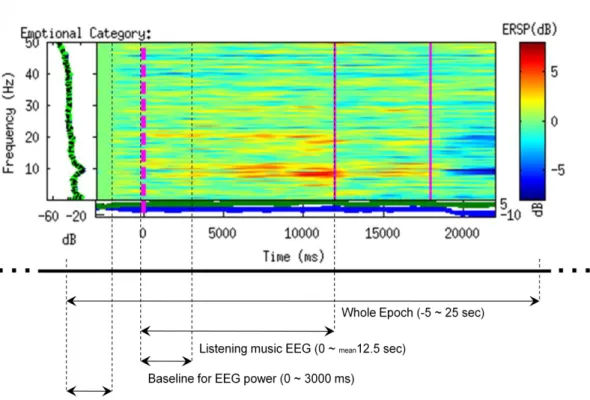
The EEG data were computed in time-frequency domain by the FFT computation. The “winsize” and “padratio” of the “newtimef” function were set to be 512 and 2. The EEG power baseline of each epoch was on the 0 ~ 3000 ms in order to remove the excitation from sounds.
EEG spectrum were separated to five frequency bands, delta(1 ~ 3 Hz), theta(4 ~ 7 Hz), alpha(8 ~ 12 Hz), beta(13 ~ 30 Hz), and gamma(31 ~ 50 Hz). In each epoch, frequency band power during listening to music was averaged. These power levels were treated as observations in the analysis of variation (ANOVA). Each excerpt was labeled to PV(positive valence)/NV(negative valence) and HA(high arousal)/LA(low arousal) according to the subjective SAM ratings. The neutral scale of valence or arousal ratings was excluded in ANOVA. The clearer sight was in Fig. 6.
14
Fig. 6. The chart of the time relationship of an epoch. The epoch was extracted from each trial from -5 ~ 25 sec of the music onset. The baseline for ICA was in the -5000 ~ -2100 ms, before the music playing. The baseline for each trial of music listening EEG power was from 0 ~ 3 sec.
15
Chapter 4 Results
4.1. Subjective ratings related to pre-labeled emotional types
Table. 1. The affective ratings of four initiated emotion types.
Pre-labeled Types
Affective Ratings Types
PVHA PVLA NVHA NVHA PV NV HA LA
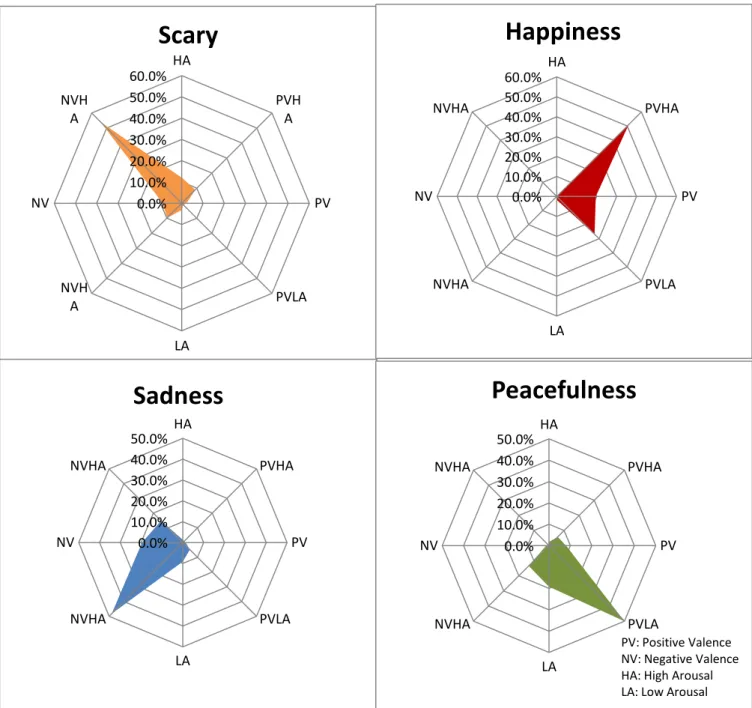
Peacefulness (PVLA) 5.8% 50.0% 13.4% 0.4% 8.0% 1.3% 1.8% 19.2% Happiness (PVHA) 51.1% 26.8% 0.0% 0.9% 19.6% 0.0% 0.0% 1.7% Scary (NVHA) 8.9% 0.9% 9.8% 54.0% 2.2% 8.9% 12.1% 3.1% Sadness (NVLA) 0.9% 4.8% 48.3% 14.8% 1.3% 19.6% 1.3% 9.1%
PV: positive valence, NV: negative valence, HA: high arousal, LA: low arousal
The affective ratings distribution to the pre-labeled four types was shown in Table. 1. As listed in the table, only about 50 % (< 60 %) of the ratings belong to the pre-labeled emotion type, about 10 % to 20 % trials were just rated to one of the two dimension, another one scale were rated on neutral scale. These results indicate that self-report have some different ratings between participants, even though they were rating on the same excerpt. The radar chart on below has a clearer view Fig. 7.
16 0.0% 10.0% 20.0% 30.0% 40.0% 50.0% 60.0% HA PVH A PV PVLA LA NVH A NV NVH A
Scary
0.0% 10.0% 20.0% 30.0% 40.0% 50.0% HA PVHA PV PVLA LA NVHA NV NVHASadness
0.0% 10.0% 20.0% 30.0% 40.0% 50.0% HA PVHA PV PVLA LA NVHA NV NVHAPeacefulness
PV: Positive Valence NV: Negative Valence HA: High Arousal LA: Low Arousal0.0% 10.0% 20.0% 30.0% 40.0% 50.0% 60.0% HA PVHA PV PVLA LA NVHA NV NVHA
Happiness
17
4.2. Subjective ratings regression to musical features
Table. 2. Medians of the Estimated Regression Coefficients β
V(Valence), β
A(Arousal),
and β
VA(Valence × Arousal) for the six Musical Features
Musical feature Constant α Valence estimate coefficient βV
Arousal estimate coefficient βA
Valence × Arousal estimate coefficient βVA
Feature 1 (mode) 2.801 (0.62) 0.309*** (0.07) - 0.053** (0.08)
Feature 2 (tempo) 3.076 (0.67) 0.009 (0.15) - 0.104 (0.18) 0.051*** (0.04)
Feature 3 (rhythm) 3.390 (0.13) 0.005 (0.02) 0.078*** (0.02)
Feature 4 (pitch level) 3.782 (1.64) 0.089 (0.25) - 0.114* (0.36) 0.025* (0.05)
Feature 5 (pitch range) 2.014 (1.71) 0.400*** (0.34) 0.405*** (0.34) - 0.084*** (0.06) Note. Standard deviations are in parentheses.
* p < .05 ** p < .01 *** p < .001 (Wilcoxon signed rank test against the null hypothesis of symmetry around zero).
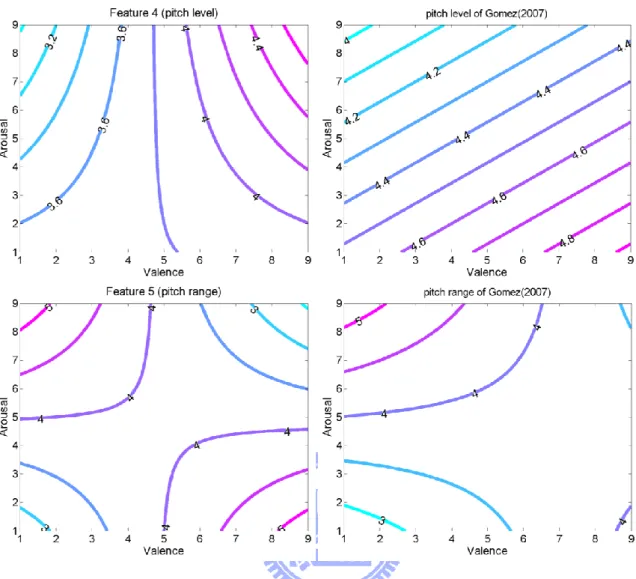
The estimated models for the 5 musical features are presented in Table. 2. In order to have a clear understanding to the relationships between musical features and felt valence and arousal, Fig. 10 (in the next chapter) shows contour plots for features in the 2-D emotion space. Mode was mostly related to valence, i.e. major mode could induce positive valence, minor mode could induce negative valence; in addition, mode had very little but meaningful effects on arousal dimension. Fast tempo could induce positive high-arousal, and even the arousal level was low or if the valence level was negative, it might be induced by slow tempo. For rhythm model, only the coefficient of arousal had significant effect. The rhythm was more complex for high arousal and simpler for low arousal. The pitch level was the lowest on negative
high-arousal state, and was the highest on positive high-arousal state; thus, the middle pitch level was on any valence low-arousal level and on neutral
18
valence with regardless arousal emotions. The pitch range was wider for negative high-arousal excerpts and positive low-arousal excerpts with
narrower ranges in the negative low-arousal and positive high-arousal states.
4.3. Results of IC Clusters
Fig. 8. Average scalp map for all clusters.
Fig. 8 shows the average scalp map for the final nine IC clusters. They are frontal-midline, left frontal, right frontal, frontal-central midline, parietal, left motor, right motor, occipital-midline, and lateral occipital. The number of subjects included in each cluster is range from 11 to 15, of totally 17 subjects. The mean Talairach locations and more details about the nine clusters are listed in Table. 3. In some clusters, there are more than one
19
component from one subject, especially the lateral occipital cluster included some components with bilateral dipoles. The residual variances of dipole fitting were small enough thus the dipole fitting were good for use. The clustered IC topographic maps, dipole sources, and power spectra were shown in Appendix I .
Table. 3. The base information about IC Clusters
IC Cluster name #sets #ICs
Talairach
coordinates (x, y, z)
Residual variance (%)
rvmax rvmin rvmean Frontal-midline (Fm) 15 (88%) 19 (-1, 29, 30) 9.6 0.38 3.06 Left-frontal (lF) 12 (71%) 12 (-24, 21, 42) 6.37 0.93 3.43 Right-frontal (rF) 11 (65%) 11 (24, 12, 27) 4.48 0.83 2.72 Frontal-cental-midline (FCm) 15 (88%) 15 (0, -11, 34) 6.94 0.77 2.77 Parietal (P) 14 (82%) 19 (-2, -54, 38) 6.28 1.45 3.2 Left-motor (lM) 12 (71%) 12 (-32, -31, 40) 8.89 1.21 3.3 Right-motor (rM) 12 (71%) 17 (33, -37, 40) 7.15 0.79 3.13 Occipital-midline (Om) 11 (65%) 11 (1, -74, 15) 2.99 1.71 2.14 Lateral-occipital (latO) 12 (71%) 28 Left (-22, -67, 13) 6.31 0.54 2.94 Right (20, -71, 11)
4.4. Results of EEG spectral dynamics analysis
Table. 4 shows the EEG spectral dynamics with significant differences between groups, positive/negative valence, high/low arousal, or with the
20
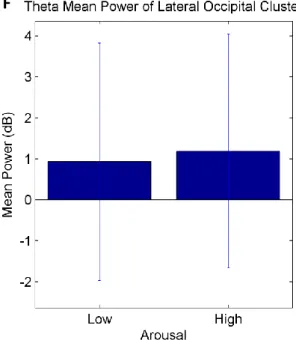
interaction terms. On the other hand, the mean power and standard deviation of pairs with significant differences were shown in Fig. 9. Frontal-midline has gamma difference related to valence and has alpha difference related to arousal. In the left frontal cluster, alpha band activity was related to valence. Right frontal gamma had differences between
positive/negative affection; also in the right frontal cluster, beta reaction was related to the interaction between valence and arousal. Furthermore, in the left motor cluster, there are arousal related delta activities. Finally, in this study, occipital midline, as well as lateral occipital, had difference on theta power related to arousal.
Table. 4. The outline of IC clusters under ANOVA significant level
IC Cluster
Valence Arousal Valence*Arousal
δ θ α β Γ δ θ α β Γ δ θ α β Γ Fm ** ** lF * rF * *** FCm P lM * rM Om * latO * * p<0.05 ** p<0.01 *** p<0.005
21
A B
22
Fig. 9 The average power and standard deviation of clusters with significant level (p< 0.05). A) Frontal-midline alpha, B) frontal-midline gamma, C) left frontal alpha, D) right frontal gamma, E) left motor delta, F) lateral occipital theta, and G) occipital midline theta.
E F
23
Chapter 5 Discussion
5.1. Musical features and affection
The MIDI content of the 56 excerpts was analyzed with simple algorithm. The regression results of this study were compared with the results of Gomez & Danuser [7]. In order to have a clear comparison, the affective space of regression results of these two studies were put together in Fig. 10.
Mode not only influences the valence but also the intensity of affection slightly. Comparing with the results of Gomez, the human sense of mode is not simple as major/minor separation, however, the mode could be in
different degrees to influence the emotion of human. In this study, the tempo is related to the interaction of valence and arousal; in clearly, the rapid music could induce positive high-arousal emotion, but the affection might tend to be negative and low arousal. The rhythm perception was not easy to evaluate by calculation, the regression results of human-perception rhythm were more complex than the algorithm used in this study. The regression result of pitch level in the current study was consisted with the study of [7], that is, the low pitch could induce negative high-arousal emotion but they are not in agree on the high pitch level. The high pitch level could cause not only low but also high arousal emotion in positive condition. The results of pitch range which were quadrant distribution were much similar with the results of Gomez & Danuser.
24
The estimated models of two studies were very different in some features especially rhythm. The complex features couldn‟t be simulated with simple algorithm.
25
Fig. 10. The five features in the affective space defined by valence and arousal. On the x- and y-axes, 1=most negative valence/lowest arousal and 9=most positive valence/highest arousal. The estimated models represented as follows:
This study: Gomez & Danuser:
26
5.2. EEG activities features
As in many studies, the frontal lobe plays an important role in human emotion. The current study found the alpha power variation related to arousal found in the frontal-midline region was similar with the other study which found the overall frontal EEG alpha activity could distinguish the intensity of the emotions [20]. Besides, the frontal-midline have gamma power related to valence in the current research can be verified by the emotion-related study of MEG which detects beta-low gamma ERDs in the anterior cingulated cortex (ACC) [34]. Furthermore, the asymmetric oscillation of anterior brain region was also a common indicator related to affections. In this study, the alpha power activity difference was found related to valence in left frontal region, and the gamma power in right frontal region; also, the beta rhythm was found in right frontal related to the
interaction of valence and arousal. In the top-30 emotional EEG feature pairs listed in the study of Lin el al. [27], the similar findings such as the alpha asymmetry at FP1-FP2 sites, gamma asymmetry at F3-F4 and FP1-FP2 sites, and beta asymmetry at F7-F8 and FT7-FT8 sites could be corresponded. Moreover, the study of Koelstra [35], investigated the correlations of valence and arousal with powers in four frequency bands, shown electrodes on the left frontal region had alpha power significant correlation to valence. In addition, also in [35], FC6-beta correlated to valence and FC6, F8-gamma correlated to valence were found to correspond to the current study with right frontal beta and gamma reactions.
27
The EEG reaction was found in motor region during listening to music however the participant did not have body movement. It is referred to the role of a mirror-neuron system in perception of emotion [36]. For example, the music with slow tempo, lower pitched sounds, resembling with sad music, which involved slow, low-intensity movements; on contrary, the fast,
high-pitched music, could be regarded as happiness music, is associated with rapid, high-energy movements, such as can be observed in spontaneous dancing to music. The sensory-motor interactions were involved during listening to music. In the current study, the delta oscillation was found in the left somato-motor region related to affective arousal. In the other study [35], the theta power with significant correlation to arousal was found on CP6, near to left somato-motor area. Although it is not the same frequency band power found as the current study, it could be evidence that left somato-motor area would be aroused during listening to music. Specifically, the right handed people may have more tendencies to move with right side body, in spite of they are just imagining. For almost subjects, it is reasonable that the motor EEG activate in the opposite side to the preferred hand.
The theta activity was found in occipital-midline and lateral-occipital region related to human arousal while listening to music. On the other hand, in the findings of [35], the occipital theta was found to be correlated with valence. Furthermore, the O1-O2 asymmetry was in the top-30 feature pairs of [37]. The occipital region involved the visual processes of brain.
Nevertheless, these emotional related EEG activities were not caused by visual stimuli.
28
standard deviations were larger than the distance of difference between two groups. That might be attributed to the personal difference of affection.
5.3. The limitation of this study
As the research of music psychologies, the mode, tempo would be the major effective factor to valence and arousal. Besides, other musical features such as melody, harmonic, timbre, or articulation also influence emotion of listeners [1, 7]. In this study, only five musical features were selected for the reason of the 56 musical excerpts were all synthesized piano sound.
Therefore, the timbre of all excerpts was the same and their articulation was unitary.
The participants in this study were all students in Taiwan. Though, the personality profiles, such as music experience, with or without music training, or the preference of music, even the culture background of participants were not manipulated to distinguish its EEG activities between participants.
This study was a touchstone of emotion research. The initial motivation of this study was to using the EEG to recognize human‟s emotion during listening to music. Furthermore, if we known personality‟s emotion EEG feature, the musical features of specific emotion type could be modeled
according to subject‟s EEG characteristics. For more advanced applications, that can be used to music therapy, or to make lots of computer games to be more colorful in auditory.
29
Chapter 6 Conclusion
In this study, 56 musical excerpts were analyzed according to the MIDI information, using simple algorithm to get five musical features of each
excerpts. In the experiment, 17 participants were invited to listening musical pieces, and were asked to report their affections after each song. EEG
(Electroencephalogrphy) was recorded during listening. EEG was
pre-processed and decomposed into independent brain processes with ICA (independent component analysis).
As the results shown, the estimated musical features compared with results of Gomez & Danuser indicated that we can simulate simple features, such as mode, tempo, pitch range, without more details about human
perceptions. Some discrepancies exist on more complex features involved advanced musical analysis.
EEG results show that the asymmetric on lateral frontal lobe which react to pleasantness, there are left frontal-alpha, right frontal-gamma. The
frontal lobe also distinguished levels of arousal on alpha band and valence on gamma band. That somato-motor region also activated during musical listening revealed that people had motivation or imagery to dance with musical sounds. And in the occipital also had some information related to arousal.
This study confirms that the asymmetry plays an important role in valence processing. Beside, multiple brain regions are involved in emotions induced by music.
30
The future work may investigate the relationship between EEG and multi-scaled valence and arousal reported by subjects. In this way, the difficult might be the data of grouped subjects may cause the correlation to be much small as the reason of some individual differences.
31
References
[1] P. N. Juslin and P. Laukka, "Expression, perception, and induction of musical emotions: A review and a questionnaire study of
everyday listening," Journal of New Music Research, vol. 33, pp. 217-238, Sep 2004.
[2] P. N. Juslin and D. Vastfjall, "Emotional responses to music: the need to consider underlying mechanisms," Behavioral and Brain
Sciences, vol. 31, pp. 559-75; discussion 575-621, Oct 2008.
[3] A. Gabrielsson and E. Lindstrom, "The influence of musical structure on emotional expression," in Music and emotion: theory
and research, P. N. J. J. A. Sloboda, Ed., ed London: Oxford University Press, 2001, pp. 223-248.
[4] G. A. and J. P, "Emotional expression in music," in Handbook of affective sciences, R. Davidson, K. R. Scherer, and H. H.
Goldsmith, Eds., ed New York: Oxford University Press, 2003, pp. 503-534.
[5] Y. H. Yang and H. H. Chen, "Music Emotion Ranking," 2009 Ieee International Conference on Acoustics, Speech, and Signal
Processing, Vols 1- 8, Proceedings, pp. 1657-1660, 2009.
[6] L. Lu, D. Liu, and H. J. Zhang, "Automatic mood detection and tracking of music audio signals," Ieee Transactions on Audio
Speech and Language Processing, vol. 14, pp. 5-18, Jan 2006.
[7] P. Gomez and B. Danuser, "Relationships between musical structure and psychophysiological measures of emotion," Emotion, vol.
7, pp. 377-87, May 2007.
[8] D. Vaitl and W. S. Vehrs, S., "Promts-Leitmotif-Emotion: play it again, Richard Wagner," in The sturcture of emotion:
psychophysiology, cognitive, and clinical aspects, N. B. A. Ohman, Ed., ed, 1993, pp. 169-89.
[9] I. Nyklicek, J. F. Thayer, and L. J. P. van Doornen, "Cardiorespiratory differentiation of musically-induced emotions," Journal of
Psychophysiology, vol. 11, pp. 304-321, 1997.
[10] L. O. Lundqvist, F. Carlsson, P. Hilmersson, and P. N. Juslin, "Emotional responses to music: experience, expression, and
physiology," Psychology of Music, vol. 37, pp. 61-90, 2008.
[11] C. L. Krumhansl, "An exploratory study of musical emotions and psychophysiology," Canadian Journal of Experimental
Psychology, vol. 51, pp. 336-52, Dec 1997.
[12] D. L. Barrett, "Physiological reactions to music and acoustic stimuli," in Handbook of music psychology, D. A. Hodges, Ed., 2nd
ed: IMR Press, 1996, pp. 343-85.
[13] A. J. Blood and R. J. Zatorre, "Intensely pleasurable responses to music correlate with activity in brain regions implicated in
32
Sep 25 2001.
[14] A. J. Blood, R. J. Zatorre, P. Bermudez, and A. C. Evans, "Emotional responses to pleasant and unpleasant music correlate with
activity in paralimbic brain regions," Nature Neuroscience, vol. 2, pp. 382-387, Apr 1999.
[15] S. Brown, M. J. Martinez, and L. M. Parsons, "Passive music listening spontaneously engages limbic and paralimbic systems,"
Neuroreport, vol. 15, pp. 2033-2037, Sep 15 2004.
[16] V. Menon and D. J. Levitin, "The rewards of music listening: Response and physiological connectivity of the mesolimbic
system," Neuroimage, vol. 28, pp. 175-184, Oct 15 2005.
[17] S. Koelsch, T. Fritz, D. Y. Von Cramon, K. Muller, and A. D. Friederici, "Investigating emotion with music: An fMRI study,"
Human Brain Mapping, vol. 27, pp. 239-250, Mar 2006.
[18] J. J. B. Allen, J. A. Coan, and M. Nazarian, "Issues and assumptions on the road from raw signals to metrics of frontal EEG
asymmetry in emotion," Biological Psychology, vol. 67, pp. 183-218, Oct 2004.
[19] W. Heller, D. L. Lindsay, J. Metz, and D. M. Farnum, "Individual-Differences in Right-Hemisphere Activation Are Associated
with Arousal and Autonomic Response to Lateralized Stimuli," Journal of Clinical and Experimental Neuropsychology, vol. 13,
pp. 95-95, Jan 1991.
[20] L. A. Schmidt and L. J. Trainor, "Frontal brain electrical activity (EEG) distinguishes valence and intensity of musical emotions,"
Cognition & Emotion, vol. 15, pp. 487-500, Jul 2001.
[21] L. I. Aftanas, N. V. Reva, A. A. Varlamov, S. V. Pavlov, and V. P. Makhnev, "Analysis of Evoked EEG Synchronization and
Desynchronization in Conditions of Emotional Activation in Humans: Temporal and Topographic Characteristics," Neuroscience
and Behavioral Physiology, vol. 34, pp. 859-867, 2004.
[22] D. Sammler, M. Grigutsch, T. Fritz, and S. Koelsch, "Music and emotion: Electrophysiological correlates of the processing of
pleasant and unpleasant music," Psychophysiology, vol. 44, pp. 293-304, Mar 2007.
[23] M. Sarlo, G. Buodo, S. Poli, and D. Palomba, "Changes in EEG alpha power to different disgust elicitors: the specificity of
mutilations," Neuroscience Letters, vol. 382, pp. 291-296, Jul 2005.
[24] M. Balconi and C. Lucchiari, "Consciousness and arousal effects on emotional face processing as revealed by brain oscillations. A
gamma band analysis," International Journal of Psychophysiology, vol. 67, pp. 41-46, 2008.
[25] E. Basar, C. Basar-Eroglu, S. Karakas, and M. Schurmann, "Oscillatory brain theory: A new trend in neuroscience - The role of
oscillatory processes in sensory and cognitive functions," Ieee Engineering in Medicine and Biology Magazine, vol. 18, pp. 56-66,
33
[26] D. J. L. Schutter, P. Putman, E. Hermans, and J. van Honk, "Parietal electroencephalogram beta asymmetry and selective attention
to angry facial expressions in healthy human subjects," Neuroscience Letters, vol. 314, pp. 13-16, Nov 13 2001.
[27] Y. P. Lin, J. R. Duann, J. H. Chen, and T. P. Jung, "Electroencephalographic dynamics of musical emotion perception revealed by
independent spectral components," Neuroreport, vol. 21, pp. 410-5, Apr 21 2010.
[28] S. Vieillard, I. Peretz, N. Gosselin, S. Khalfa, L. Gagnon, and B. Bouchard, "Happy, sad, scary and peaceful musical excerpts for
research on emotions," Cognition & Emotion, vol. 22, pp. 720-752, 2008.
[29] P. Gomez and B. Danuser, "Affective and physiological responses to environmental noises and music," Int J Psychophysiol, vol.
53, pp. 91-103, Jul 2004.
[30] M. M. Bradley and P. J. Lang, "Measuring emotion: The self-assessment manikin and the semantic differential," Journal of
Behavior Therapy and Experimental Psychiatry, vol. 25, pp. 49-59, 1994.
[31] M. Zentner, D. Grandjean, and K. R. Scherer, "Emotions evoked by the sound of music: Characterization, classification, and
measurement," Emotion, vol. 8, pp. 494-521, Aug 2008.
[32] A. Delorme and S. Makeig, "EEGLAB: an open source toolbox for analysis of single-trial EEG dynamics including independent
component analysis," Journal of Neuroscience Methods, vol. 134, pp. 9-21, Mar 15 2004.
[33] S. Makeig, J. Onton, M. Westerfield, and J. Townsend, "Imaging human EEG dynamics using independent component analysis,"
Neuroscience and Biobehavioral Reviews, vol. 30, pp. 808-822, 2006.
[34] M. Hirata, S. Koreeda, K. Sakihara, A. Kato, T. Yoshimine, and S. Yorifuji, "Effects of the emotional connotations in words on the
frontal areas - A spatially filtered MEG study," Neuroimage, vol. 35, pp. 420-429, Mar 2007.
[35] C. M. Sander Koelstra, Mohammad Soleymani, Jong-Seok Lee, Ashkan Yazdani, Touradj Ebrahimi, Thierry Pun, Anton Nijholt,
Ioannis Patras, "DEAP: A Database for Emotion Analysis Using Physiological Signals," IEEE Transactions on Affective
Computing, 06 Jun. 2011.
[36] R. J. Zatorre, J. L. Chen, and V. B. Penhune, "When the brain plays music: auditory-motor interactions in music perception and
production," Nature Reviews Neuroscience, vol. 8, pp. 547-558, Jul 2007.
[37] Y. P. Lin, C. H. Wang, T. P. Jung, T. L. Wu, S. K. Jeng, J. R. Duann, and J. H. Chen, "EEG-Based Emotion Recognition in Music
Listening," Ieee Transactions on Biomedical Engineering, vol. 57, pp. 1798-1806, Jul 2010.
[38] E. T. G. T. Toussaint, "On the relation between rhythm complexity measures and human rhythmic performance," presented at the
34
Appendix I IC clusters results on
individual components
35
36
37
38
39
40
41
42
43
Fig. 20. The dipole locations projected to 3 planes: Sagittal view(top left), Coronal view(top right), Horizontal view(bottom), group clusters with same colors.
44
Appendix II Musical features evaluation
The note numbers and their note-onset time and duration of each excerpt were loaded by „midi2nmat.m‟. The note number was ranged from 0 to 127, where middle C(C4) was 60. Feature 1 (Mode)
The Feature 1 was referred to the mode. In this analysis, the mode was determined by key finding instead of investigating the tendency to major or minor. The key finding was performed by the K-S key-finding algorithm using the „kkkey‟ function. If the key with the highest correlation coefficient was in major, the mode will set to major, and vice versa.
Feature 2 (Tempo)
This feature was referred to the tempo of each excerpt. The tempo could be elucidated in the numbers of notes-on-set in one period. In the analysis of midi files, if more than one note sang at the same time, it should be regarded as one note-on. In this method, the tempo of each excerpt was evaluated to be
# of on-set notes / total duration time. Feature 3 (Rhythm)
The evaluation of rhythm was according to the algorithm designed by Thul & Toussaint [38], which is one of methods used to calculate measurement of musical pieces, and it can be regarded as rhythm complexity.
Feature 4 (Pitch level)
45
one song was in upper or lower register. In this study, the pitch distribution of one excerpt was supposed to be normal distribution. We use the
„normfit.m‟ function of the Statistics Toolbox to fit the normal form of the pitch distribution. The mean value of the fitted distribution was tough to be the pitch level of one musical excerpt.
Feature 5 (Pitch range)
The Feature 5 was referred to pitch range. In this study, the pitch range was simply evaluated by the range of the highest pitch and the lowest pitch of one song. That is,
max(pitch number) – min(pitch number).
The z-scores of these five musical features were transformed. Then, the scores were extended and translated to 0 ~ 7.
46
Appendix III Instructions of Experiment
Musical Emotions 實驗指導語 2010/1/20 口頭上的指導語: 簡介 我先簡單介紹一下,我是葉人慈,現在是交大聲音科技學程碩士班二年級的學生。我在交大腦科學研究中心做 的是與音樂情緒相關的生理資訊研究。 我們會量測受測者的腦電波、心跳以及呼吸,這些測量的裝置都是非侵入式的,不會對人體造成侵入性的傷害。 如此之外,我們也會請你填寫一些與研究相關的問卷,我們不會把這些個人的資訊公開,請你放心填寫。 首先要請你填一份受測者同意書… 我們的實驗大概需要一個半小時的時間,所以大概每隔二十分鐘左右,我們會讓你休息一下… 熟悉場景及流程 我們在前面跟後邊都有放一個監視器,所以如果你在過程中有問題,你可以蓋住鏡頭或舉手讓我知道。 (確認耳機正常…) 我現在給你看一下實驗的場景和流程。 首先進入到這個簡介畫面,它會告訴你說,聆聽音樂的時候請你看著螢幕上的十字;出現方塊的時候,請你放 鬆,保持心情平靜。 實驗的流程就是,請你仔細聆聽每個音樂片段,在每個片段之後,螢幕上會出現一些問題,這些問題跟音樂引 發的情緒有關,請你用滑鼠選擇一個適當的答案。 看過這個說明後,就可以按滑鼠左鍵開始實驗。 首先是方塊,這時候請你保持放鬆。 接下來就開始放音樂… 之後經過一小段的回想,螢幕上會有一些問題,你只要選擇跟音樂內容有點符合的答案就可以了,不需要選出 跟你所想的完全相同的答案。 這個畫面是要選擇這個片段讓你開始有感受的時間點,請你在這個時間軸上,點選一個你開始有感受的時間… 如果不確定,可以選”不確定”… 之後請你選出你的感受的正/負面程度,左邊是最正面(可能是快樂或愉快)、右邊是最負面(可能是哀傷或憤怒); 你可以選每張圖,或是每個圖的中間,所以總共有九個選項… 然後是選你的感受的強烈程度,如果這個片段會讓你激動起來(可能是很興奮或很憤怒),就往左邊選;如果這 個片段會讓你趨向緩和(可能是很舒服到讓你想睡覺,或是讓你悲傷到很無力的狀態),就往右邊選;一樣是有五個圖 包含中間總共九個選項…。 接下來的三個問題,你可能會找不到可以完全表達你的感受的選項,但是沒關係,就請你選一個跟你的感覺有 點相似的答案就可以了。如果你真的判斷不出來,或是你忘記你的感受,那你可以選擇”不確定”。 如果沒有任何其他問題,最後要提醒你,實驗過程中,尤其是聽音樂的時候,為了生理訊號的品質不受到干擾, 請不要任意移動或晃動你的身體、四肢或臉部、頭部、眼睛,所以你可以先找到一個比較舒適的狀態,然後保持放 鬆。 好,那我們準備開始!門關上之後,進入黑色畫面實驗就正式開始!47 休息時間 現在休息 10 分鐘,我先幫你把耳機拿下來…請等一下(拔 sensor 接頭)… 好,現在請你到外面休息一下,有一份問卷給你填… 螢幕上的指導語: 實驗前 Recall
Question and Response
注意事項: 聆聽音樂時, 請你注視螢幕中央的 + 符號; 當你看到螢幕中間出現方塊圖樣時, 請保持心情平靜, 等候音樂出現. 實驗前, 請將你的身體調整到最舒適的位置; 實驗過程中, "不可”任意改變臉部及身體(含手,腳)的狀態. 請你在實驗過程中, 仔細聆聽每個音樂片段; 在每個片段播放之後, 我們將會讓你根據每段音樂的內容回答問題, 這些問題與音樂引發的情緒有關. 回答問題時, 請用滑鼠點選最符合當時感受的選項. 閱讀完以上說明後, 請按滑鼠左鍵開始實驗... 現在請你回想剛才播放的音樂片段... 之後根據這個片段, 回答螢幕上的問題... 請在橫軸上標出這段音樂開始引發你的情感的時刻 time bar/不確定 請為這段音樂標出代表情緒正/負面程度的人像 SAM valence 請為這段音樂標出代表情緒激動/放鬆程度的人像 SAM arousal 在你的印象中,有沒有聽過這段音樂? 確定有聽過/好像有聽過/沒有聽過/不知道 你覺得這段音樂可能類似以下何種情境? 聖歌聲中的殿堂 安詳、皎潔的月夜 與愛人的溫情約會 英勇、豪壯的場面 溫馨、感性的時刻 歡樂的慶祝會 傷感的離別 緊張刺激的橋段 往事回憶 令人煩燥的氣氛 不確定
48 休息前 結束前 休息時間... 請等候實驗操作者為你整理實驗裝置之後再放鬆...! 謝謝你! 本階段實驗結束! 請等候實驗操作者為你整理實驗的裝置之後再放鬆...! 謝謝你! 你覺得這段音樂是: 柔暢的 強勁的 沉重的 跳躍的 平靜的 激動的 緩和的 急切的 有精神的 哀傷的 不確定
49
Appendix IV A Letter of Concent to
participents
國立交通大學腦科學研究中心
受試者同意書
本人已充分了解本實驗的流程,並了解腦電波及周邊生理信號
量測為非侵入性的實驗方法,且受測者所填問卷資料僅供實驗分
析使用,願意擔任受試者,並對實驗之細節保密。
受試者: (請簽名)
日期:
年 月 日
50
Appendix V Questionnaire for
partisipents’ profile
國立交通大學 腦科學研究中心 受試者基本資料
記錄員:
實驗項目名稱:Musical Emotions 填寫時間: 年 月 日
受測者編號 出生 年 月 年齡 歲 性別 □男 □女
身高 公分 體重 公斤 血型 □O □A □B □AB
教育程度 □高中 □大學 □碩士 □博士 職業 □學生 □公教 □工 □商 視力 □正常 □矯正後正常 色盲 □有 □沒有 聽力 □正常 □需助聽器輔助 慣用手 □左手 □右手 電話 Email 音樂經驗與背景 1. □念過音樂班(系/所): □參加過音樂類社團: □參與過音樂表演或比賽:□合唱□歌唱□樂團□卡啦 OK □其他: 2. 視譜能力: □辨識非常快速 □了解大部分的樂譜內容 □稍微了解樂譜內容 □看過樂譜但不懂內容 □對樂譜完全陌生 3. □學習/使用樂器: ,學習/使用期間: 4. 自認辨識音準能力:□非常準確/有絕對音感 □還不錯/沒有絕對音感 □聽得出音階及旋律 □能分辨相鄰兩音的差別 □無法辨識音準 5. 聽音樂的時機(可複選): □不會刻意去聽 □安靜或休息時會想聽 □看書時會聽 □隨時有機會就聽 6. 就大部分的經驗來說,聽音樂時會: □當作背景音樂 □仔細聆聽音樂的內容 7. 常聽的音樂類型:□西洋古典 □歐美 □日韓 □台灣及華人 □拉丁 □印度 □非洲 (可複選) □國樂 □老歌 □閩南語 □客語□原住民 □其他: 8. 喜歡的音樂風格: □金屬/搖滾樂(快節奏) □抒情歌曲(舒緩節奏) (排出喜好的順序,最喜歡 = 1)□激昂的古典樂(如:交響曲) □優美的古典樂(如:室內小品) 健康狀況 1. 過去是否有重大傷病史: □沒有 □有,請說明 2. 過去是否需要定期看醫生: □沒有 □有,請說明 3. 目前是否有任何健康上的問題需要長期服藥或動手術: □沒有 □有,請說明 4. 是否有特殊飲食安排: □沒有 □有,請說明 5. 是否有飲用含咖啡因飲料之習慣: □沒有 □有,請說明何種飲料: ,咖啡因濃度: 平均每週喝________瓶(或 CC) 6. 平均每日睡眠時數: 小時;自評睡眠品質:□非常好 □好 □尚可 □差 □很 差 7. 運動習慣: 運動項目: 平均每月 次,每次 小時
51
Appendix VI Questionnaire after
Experiment
國立交通大學腦科學研究中心
Musical Emotions 實驗
實驗後的評量 受試者編號: 受測時間: 年 月 日 : ~ : 1. 前一晚的睡眠狀況 □極充足 □很充足 □普通 □有點不充足 □非常不充足 2. 音樂整體音量 □大到受不了 □有點大 □適中 □可以再大一點 □聽不清楚 3. 評量正向/負向的感受 □極容易 □很容易 □普通 □有點難 □非常難 4. 評量激動/冷靜的感受 □極容易 □很容易 □普通 □有點難 □非常難 5. 評量對音樂的感受 □極容易 □很容易 □普通 □有點難 □非常難 6. 受到先前播放的音樂 □很受影響 □有點影響 □普通 □不受影響 7. 其他事項補充說明或建議:52
Appendix VII Mental Assessments
Depression, anxiety and alexithymia were assessed by the Chinese versions 2 3 4 of the Back Depression Inventory (BDI-II; Back, 1996), theState-Trait Anxiety Inventory (STAI; Laux et al., 1981) and the
Toronto-Alexithymia Scale (TAS; Taylor et al., 1985). As in Table. 5, all subjects were non-alexithymia, minimal or mild (5 persons) depression, except 2 person had no data.
Table. 5 The results of subjective self-mental assement.
TAS-20 STAI-state STAI-trait BDI-II
s07 X - X X X -
s19 X - X X X -
s20 10 Non-alexithymia 38 54 9 Minimal depression
s21 35 Non-alexithymia 37 39 7 Minimal depression
s22 27 Non-alexithymia 36 49 17 Mild depression
s23 37 Non-alexithymia 41 44 15 Mild depression
s24 25 Non-alexithymia 52 46 8 Minimal depression
s25 20 Non-alexithymia 40 46 14 Mild depression
s26 31 Non-alexithymia 36 48 15 Mild depression
s27 11 Non-alexithymia 43 43 14 Mild depression
s28 34 Non-alexithymia 48 62 9 Minimal depression
s29 33 Non-alexithymia 37 45 7 Minimal depression
s31 34 Non-alexithymia 40 46 10 Minimal depression
s32 14 Non-alexithymia 31 46 4 Minimal depression 2 盧孟良、車先蕙、張尚文、沈武典(2002)。中文版貝克憂鬱量表第二版之信度和效度。台灣精神醫學,第 16 卷(第 4 期)。 3 鍾思嘉 & 龍長風(1984)。修訂情境與特質焦慮量表之研究。測驗年刊,第 31 卷,頁 27-36。 4 林育臣、陳展航(2003)。台灣版多倫多述情量表之因素分析。台灣精神醫學,第 17 卷(第 4 期),頁 276-282。
53
s33 17 Non-alexithymia 42 48 13 Minimal depression
s34 24 Non-alexithymia 31 31 9 Minimal depression
s35 25 Non-alexithymia 39 51 5 Minimal depression
Average 25.13333 39.4 46.53333333 10.4 S.T.D. 8.447386 5.376492 6.561165208 3.860915
54
Appendix VIII Subjects’ Profiles
年 齡 性別 就讀科系 慣 用 手 音樂背景 自評 識譜 能力 演奏樂器 自評 音準 辨識 能力 聽音樂時機 聽音樂習慣 常聽的音樂類型 喜愛的音樂 風格 S07 25 Male A 大聲音 左 玩樂團 4 吉他 3 年 4 有機會就聽 聽內容 2,3 1,2 S19 24 Male A 大聲音 右 合唱團,卡拉 OK 2 鋼琴 10 年 2 安靜休息時聽 當背景 1,4 2>4>1>3 S20 20 Female A 大工工 右 管樂團,打擊樂 2 打擊 6 年 3 有機會就聽 聽內容 1,2,9 1>2>3>4 S21 20 Male A 大運管 右 直笛表演 1 直笛 3 年,鋼琴 6 年 2 安靜看書時聽 當背景 1,2,4,9 2>4>3>1 S22 19 Male A 大土木 右 無經驗 3 口琴 1 月 3 有機會就聽 當背景 2,3,4,9,10,12 2>4>3>1 S23 24 Male A 大顯示 右 合唱團,卡拉 OK 5 直笛 6 年 5 不刻意去聽 聽內容 1,10 1 S24 19 Female - 右 玩樂團 2 Bass 吉他 1 年 3 有機會就聽 當背景 2,3,4,8,9,10 2>4>1>3 S25 21 Male B 大物理 右 弦樂團 2 小提琴 7 年 2 安靜看書時聽 當背景 24,10 1>2>3>4 S26 24 Male A 大材料 右 音樂性社團 2 大提琴 1 年 5 安靜看書時聽 當背景 1,2,4 2,4 S27 19 Female B 大化學 右 合唱團,卡拉 OK 3 無 3 有機會就聽 聽內容 1,2,3 1>2>4>3 S28 21 Male - 右 合唱團,卡拉 OK 5 無 3 有機會就聽 當背景 1,2 2>4>3>1 S29 24 Male A 大電子 右 無經驗 4 無 5 不刻意去聽 當背景 1,2,3 2>4>1>3 S31 23 Male C 大電機 右 吉他社,歌唱 3 吉他 3 年 4 不刻意去聽 聽內容 2,4,9 4>2>3>1 S32 21 Female A 大運管 右 無經驗 2 鋼琴 3 年 3 不刻意去聽 當背景 2,3,4 2>1>4 S33 20 Female A 大電機 右 鋼琴表演 1 鋼琴 10 年 3 看書時聽 聽內容 1,2,3 1>3>4>2 S34 19 Female A 大工工 右 玩樂團 3 豎笛 3 年 3 安靜看書時聽 當背景 1,2,4 2>4>3>1 S35 20 Female A 大傳播 右 合唱團,卡拉 OK 3 無 3 不刻意去聽 當背景 4,9,10 2>4>1>3 自評識譜能力:1 非常快速精準 2 了解大部分樂譜內容 3 稍微了解樂譜內容 4 看過樂譜但不懂內容 5 對樂譜完全陌生 自評聽音準能力:1 很準確 2 還不錯 3 能辨識出旋律 4 能辨別兩個音 5 無法辨識音準 常聽的音樂類型:1 西洋古典 2 歐美流行 3 日韓流行 4 華人流行 5 拉丁 6 印度 7 非洲 8 中國 9 華語老歌 10 閩南語 11 客語 12 原住民 喜愛的音樂風格:1 金屬/搖滾樂(快節奏) 2 抒情歌曲(舒緩節奏) 3 激昂的古典樂 4 優美的古典樂(如:室內小品)
55
Autobiography
Wrote for the course of Academic English Writing on May, 2009
My experience is very simple if you just see what I learned before graduate school. I graduated from general high school, and attended the department of electrical engineering in National United University. Then, many or most people may go to work being an engineer in a technical company, or, may study in electrical related graduate school, but I did not, because of music.
I am not a typical music learner. In my elementary school years, I admired some classmates for their piano talents. Before following any piano teacher, I played the electrical piano just for fun at home. In one special opportunity, I learned to play the piano from a Korean piano teacher for about one year. In the one year, I achieved the intermediate level of formal piano lessons. Besides, I also learned how to use chords for improvisation. I stopped the class because school works became harder. However, I still practice playing the piano in my free time.
Besides the piano learning, I also attended the chorus in high school and university. The high school chorus I attended is one of the best high school choruses in Taiwan. And the university’s student-chorus was a new club in the school. By the way, I participate in a choir for singing the song about nature loving, and sometimes, play an accompaniment.