The Associations between Arsenic in
Drinking Water and the Occurrence of
Chronic Kidney Disease: A Nationwide
Population-Based Study in Taiwan
Ya-Yun Cheng
Department of Environmental and Occupational Health College of Medicine, National Cheng Kung University
Tainan, Taiwan
01 Sep. 2016
Conflict of Interest (COI)
I have no financial interests to disclose
NCKU 2
Arsenic
Important
Nevertheless, epidemiology studies on the
association between arsenic exposure and the
occurrence of CKD / ESRD are still limited.
3NCKU 4
Objective
1.
To evaluate the associations between arsenic
exposure and the occurrence of CKD / ESRD
in Taiwan.
We conducted a nationwide population-based
study including both the BFD endemic area
and other areas in Taiwan.
NCKU 5
Materials and methods
NCKU 6
Arsenic exposure index
Data on well water arsenic were obtained from a
nationwide survey conducted by the Taiwan
Provincial Institute of Environmental Sanitation
using the standard mercuric bromide stain method.
(Lo et al.,1977; APHA, 1985)
There were more than 80,000 wells, mostly
between 1974 and 1976, and were available for 311 townships (85%).
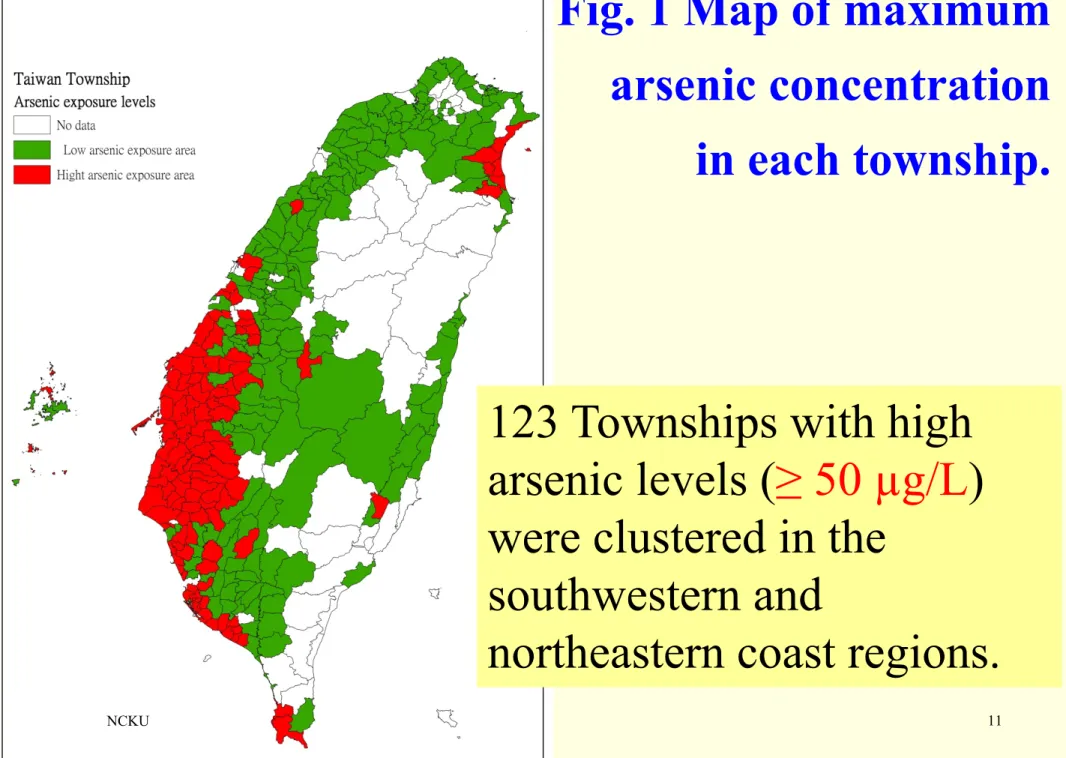
According to the cut-offs adopted by the survey reports, which was the regulatory standard at the time of the survey, we defined a high arsenic level as ≥ 50 µg/L
Jan 1, 1996
Jan 1, 1998
Dec 31, 2010
New ESRD cases once diagnosis with Catastrophic illness code 001 Prevalent
CKD / ESRD
Follow up 13 years
Allowing at least 24 months wash-out period
New CKD cases 3 times OPD diagnosis by a psychiatrist
LHID2000 Population-based ecological cohort study:
1,000,000 random sampling enrollees during 1996-2010 Adjust comorbidity
SL Wang, 2003 National Health Insurance (NHI)
Longitudinal Health Insurance Database (LHID)
Evaluate the associations between arsenic exposure and the occurrence of CKD / ESRD.
Drinking history Address at 1998 Age ≥40 at 1998
NCKU 8
Risk factors of CKD
Epidemiological and clinical evidence have shown a link between hypertension, diabetes, obesity, and
metabolic syndrome (Comorbidity) and the onset and progression of CKD.
SEX, Age, Edu, SES (Yang WC, 2008; Wen CP, 2008)
Western medicines
NSAID (non-steroidal anti-inflammatory drugs)
Acetaminophen (Chiu et al. 2008; Wen et al. 2008; Lai et al. 2009; Lai et al. 2010)
Chinese herbal medicine (Aristolochic acid)
(Vanherweghem JL, 1993; Yang CS, 2000; Chang CH, 2001; Yang HY, 2006)
Disease ICD-9-CM / A-CODE Criteria CKD 016.0, 095.4, 189.0, 189.9, 223.0, 236.91, 250.4,
271.4, 274.1, 283.11, 403.01, 404.02, 404.03, 440.1, 442.1, 447.3, 572.4, 580–589, 590-591, 593, 642.1, 646.2, 753.12–753.17, 753.19, 753.2, 794.4.
≧3 OPD visits
ESRD Dialysis 585-586 combined with copayment code ‘‘001’’
(indicated the presence of a Catastrophic illness)
1 OPD visits
Hypertension 401- 405, A260 ≧3 OPD visits
Diabetes 250, A181 ≧3 OPD visits
Hyperlipidemia 272.0-272.4, A182 ≧3 OPD visits
CAD 410-414 ≧3 OPD visits
Stroke 430-438 ≧3 OPD visits
Malignancy 140–208 ≧3 OPD visits
Assessment of kidney disease and comorbidity
International Classification of Diseases, 9th Revision, Clinical Modification (ICD-9-CM)
NCKU 10
Statistic
•
Chi-square test, T-test, ANOVA
• Cox PH regression (Survival analysis): CKD ESRD
Kaplan–Meier, Log-rank
Cox regression: Hazard Ratio, 95% C.I.
Single, multiple, backward stepwise (include p<0.05;
exclude p>0.15)
•
SAS 9.3 + SPSS1 17.0
•
Two-side p<0.05
NCKU 11
123 Townships with high
arsenic levels (≥ 50 µg/L)
were clustered in the
southwestern and
northeastern coast regions.
Fig. 1 Map of maximum
arsenic concentration
in each township.
12
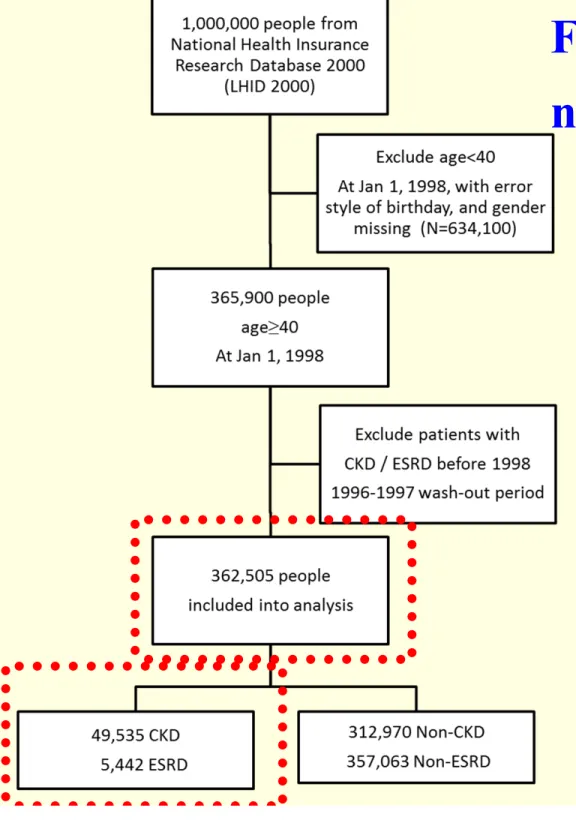
Fig. 2 Flow chart of the
nationwide cohort study
NCKU 13
1-1
TABLE-1 Cox regression models for occurrence of chronic kidney disease (N=362,505).
NCKU 14
1-2
TABLE-1 Cox regression models for occurrence of chronic kidney disease (N=362,505).
NCKU 15
1-3
TABLE-1 Cox regression models for occurrence of chronic kidney disease (N=362,505).
NCKU 16
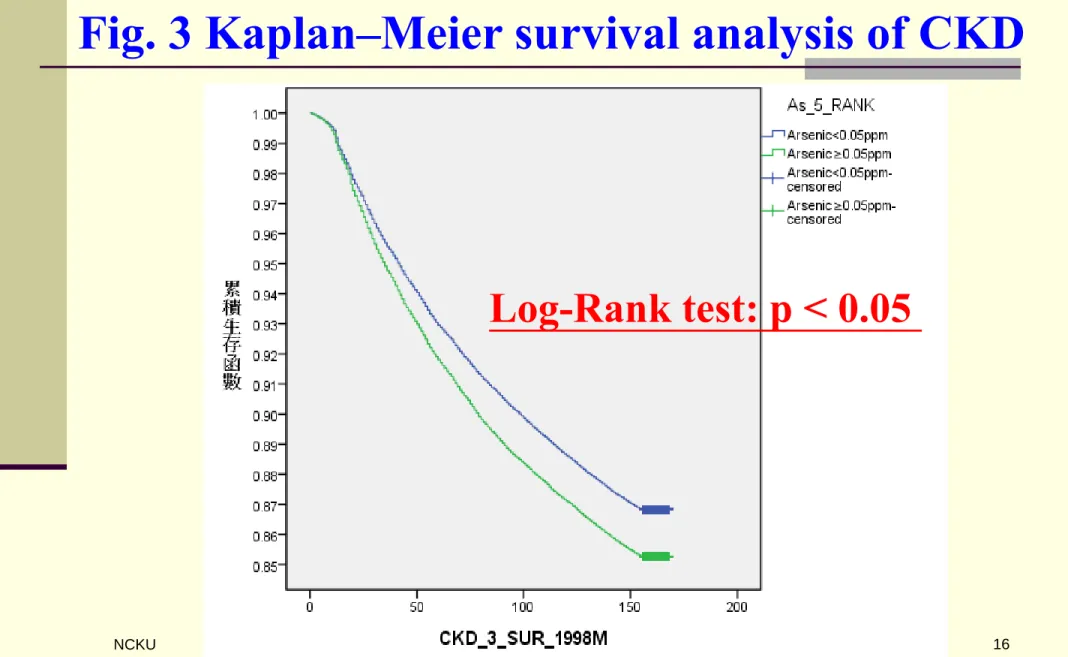
Fig. 3 Kaplan–Meier survival analysis of CKD
Log-Rank test: p < 0.05
NCKU 17
2-1
TABLE-2 Cox regression models for occurrence of end-stage kidney disease (N=362,505).
NCKU 18
2-2
TABLE-2 Cox regression models for occurrence of end-stage kidney disease (N=362,505).
NCKU 19
2-3
TABLE-2 Cox regression models for occurrence of end-stage kidney disease (N=362,505).
NCKU 20
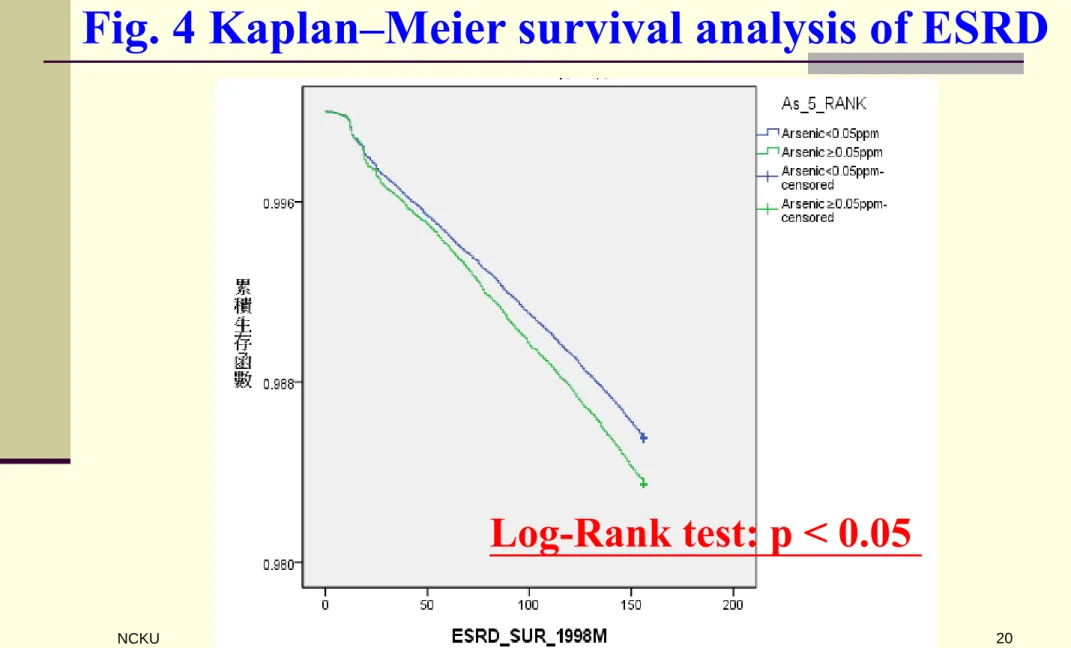
Fig. 4 Kaplan–Meier survival analysis of ESRD
Log-Rank test: p < 0.05
Strengths and limitations
A large sample size and a long duration: therefore, the results should be more reliable than those from smaller case-control or cross-sectional studies.
Ecological fallacy.
Ours study using resident area measurements
instead of personal exposure data: series of studies have been conducted using similar approaches and identified increased risk of cerebrovascular
disease, pterygium, and liver cancer.
(Lin et al., 2008; Cheng et al., 2010; Chung et al., 2013; Lin et al., 2013)
NCKU 21
Conclusion
Using 50 µg/L as the cut-off, we found that a
higher level of arsenic in the drinking water was positive associated with AHR of 1.10 (95% CI:
1.08-1.12, p < 0.001) for the occurrence of CKD / AHR of 1.07 (95% CI: 1.01-1.14, p < 0.05) for the occurrence of ESRD in Taiwan, independent of
most documented risk factors including age, sex, SES, Hypertension, Hyperlipidemia, Stroke, CAD, diabetes mellitus (DM), and Malignancy.
Intervention programs should be implemented in endemic areas of exposure to slow the occurrence of kidney disease.
NCKU 22
Acknowledgements
This work was supported by Grants NSC102-
2314-B-006 -026-MY2 and MOST-104-2314-B- 006 -021 -MY2 from the Ministry of Science and Technology of Taiwan, R.O.C.
The database in our study was established by the National Health Insurance Research Database (NHIRD).
Co-author:
How-Ran Guo (M.D., Sc.D.), Junne-Ming Sung (M.D.), Yu-Tzu Chang (M.D.)
Travel Awards from ISEE 2016
Taiwan Epidemiology Association (TEA) Award
NCKU 23
NCKU 24