國立臺灣大學電資資訊學院光電工程學研究所 碩士論文
Graduate Institute of Photonics and Optoelectronics College of Electrical Engineering and Computer Science
National Taiwan University Master Thesis
具腈基小分子有機太陽能電池之優化與紅螢烯薄膜激 子動態特性之研究
Device optimization for small molecular organic solar cell with cyano groups and exciton dynamics of rubrene
thin film
陳佳勳 Chia-Hsun Chen
指導教授:李君浩 博士 Advisor: Jiun-Haw Lee, Ph.D.
中華民國104年6月
June, 2015
i
ii
iii
致謝
這篇論文今日能夠完整呈現,亦或能順利完成碩士的生涯,最主要要感謝筆 者的指導教授李君浩老師,不只在求學的過程中,提供實驗上的建議與創新的見 解,使得在自我思考與判辨上有一大精進,且不願辛勞的包容過錯與教導,在自 身的待人處事上更有莫大的幫助。
另外,也要感謝實驗室裡支持並給予鼓勵的筆者的每個人,特別感謝邱天隆 及林奇鋒教授,兩位老師在實驗的思考與討論上給了非常大的鼓勵,並且在問題 面對上提供了明確的方向,解決了種種的困難。更要謝謝過去曾經幫助過或給予 鼓勵的學長姐們: 梓堯、Nemo、傳恩、博聖、Joanne、舜博、維甫、嘉呈、伯彥、
義信,特別感謝柏勳學長在兩年來的幫忙,受益匪淺、難以言喻。二者,也要感 謝同甘共苦的同儕們: 詒澤、政頡、力嘉、御翔,從碩士生涯中是最能同甘共苦 的好夥伴,還有學弟們: 政斌、明哲、浩淳、資展、煥捷、建良的陪伴。
此求學生涯之成果,亦感謝在此幫助過筆者的貴人。要特別感謝中研院原分 所王俊凱老師提供的量測環境,讓我能順利完成此篇之第四章,並且適時提供精 闢的質疑與鼓勵,特別感謝佘斌豪博士,在實驗架設與討論上給予了莫大的幫忙,
也要感謝藍鈺邴與鄭天佑學長在 AFM 上的協助。本文的第三章之呈獻,主要感 謝化學所汪根欉老師與丁浩淳學長,能協助提供小分子材料讓我可以無後顧之憂 的進行實驗。也感謝陳錦地教授在會議上提供豐富的見解與幫助,並不辭辛勞的 擔任口試委員。學海無涯,然而不僅是此篇成果的呈現,且有今日之成就,在學 途曾協助筆者並提升自我修生之人難以計數,但又缺一不可。
最後將此篇成果獻給在人生路途上支持我的家人: 父親陳基漳先生;母親黃 麗敏女士;弟弟陳佳緯,兩隻天竺鼠,還有我最愛的小貓咪,有家人的支持與陪 伴如今筆者才得已走到這並有如今的成果,使我無後顧之憂的學習與成長茁壯。
iv
摘要
本論文旨有其二,第一部分將介紹藉由合成四個新的施體材料運用於有機太 陽 能 電 池 元 件 , 其 結 構 施 體 - 施 體 - 受 體 型 小 分 子 。 7-(5-(di-p-tolylamino)thiophen-2-yl)benzo[c][1,2,5]thiadiazole-4-carbonitrile
(DTCTB), 7-(4-(di-p-tolylamino)phenyl)benzo[c][1,2,5]thiadiazole-4-carbonitrile (DTCPB),
7-(5-(di-p-tolylamino)thiophen-2-yl)benzo[c][1,2,5]oxadiazole-4-carbonitrile
(DTCTBO), 及
7-(4-(di-p-tolylamino)phenyl)benzo[c][1,2,5]oxadiazole-4-carbonitrile (DTCPBO).,
在一系列由混和濃度及膜厚變化之塊材異質混和界面架構下,利用與受體材料碳 70 混合,我們可得以四個小分子 DTCPB, DTCTB, DTCPBO 及 DTCTBO 所製 成太陽能電池之最佳化功率轉換效率分別為 6.55%, 4.40%, 5.98% 及 4.65%。
二者, 我們使用暫態螢光之量測,來瞭解 5,6,11,12-tetraphenylnaphthacene (rubrene)之單重態分裂(singlet fission)與三重態激子融合(triplet fusion)動態特性。
在不同溫度及單重態-單重態滅絕可忽略之前提下,單重態分裂之活化動能可被 決定。再者在膜厚較薄之薄膜中,由於空間局限之故,其會表現出較高機率之三 重態激子融合速率。
關鍵字: 有機太陽能電池,塊材異質接面,激發光光譜量測系統,單重態分 裂,三重態融合。
v
Abstract
There are two parts in this dissertation. In the first part, we employed four donor-donor-acceptor (D-A-A) configurations molecules, 7-(5-(di-p-tolylamino)thiophen-2-yl)benzo[c][1,2,5]thiadiazole-4-carbonitrile
(DTCTB), 7-(4-(di-p-tolylamino)phenyl)benzo[c][1,2,5]thiadiazole-4-carbonitrile (DTCPB),
7-(5-(di-p-tolylamino)thiophen-2-yl)benzo[c][1,2,5]oxadiazole-4-carbonitrile
(DTCTBO), and
7-(4-(di-p-tolylamino)phenyl)benzo[c][1,2,5]oxadiazole-4-carbonitrile (DTCPBO) as electron donor materials for organic solar cell applications. By a series of methodical optimization, the highest power conversion efficiencies are 6.55%, 4.40%, 5.98%, 4.65% for DTCPB, DTCTB, DTCPBO and DTCTBO respectively with bulk heterojunction configuration.
In the second part of this dissertation, the exciton dynamic of 5,6,11,12-tetraphenylnaphthacene (rubrene) was investigated by transient photoluminescence (TrPL) measurements. With low excitation energy (to avoid singlet-singlet annihilation) at different temperatures, the activation energy of singlet fission (SF) in rubrene thin film can be obtained. We also found that the thinner rubrene exhibited higher fusion rate, which may result from higher probability for non-germinate recombination.
Keyword: organic solar cells, bulk heterojunction, transient photoluminescence, singlet fission, and triplet fusion.
vi
Content
致謝... ii
摘要... iv
Abstract ... v
Content ... vi
1 Chapter 1 Introduction ... 1
1.1 Overview ... 1
1.2 Small molecule organic solar cells ... 2
1.2.1 Introduction of OSC ... 2
1.2.2 Bulk heterojunction configuration ... 4
1.2.3 D-A-A system organic materials ... 5
1.2.4 Recombination mechanisms of OSC ... 7
1.3 Singlet fission... 9
1.3.1 Introduction ... 9
1.3.2 Exciton dynamics of aromatic based materials ... 11
1.3.3 Caging effect ... 14
1.4 Motivation ... 15
2 Chapter 2 Experiments ... 17
2.1 Introduction ... 17
2.2 Device fabrication and measurement systems for OSC ... 17
2.2.1 Substrate patterning ... 17
2.2.2 Device fabrication ... 18
2.2.3 Device performances measurement ... 19
2.2.4 Measurement of external quantum efficiency (EQE) ... 20
2.2.5 Absorption spectrum measurement ... 21
vii
2.2.6 Measurement of optical constants ... 21
2.2.7 Sun variation system ... 22
2.3 Sample fabrication and measurement systems for exciton dynamics ... 23
2.3.1 Samples fabricated for exciton dynamic investigation ... 23
2.3 2 Steady state and time-resolve photoluminence (TrPL) at different temperatures ... 24
3 Chapter 3 Optimization of bulk heterojunction OSC for D-A-A configuration molecule with single cyano group as the electron donor material ... 27
3.1 Introduction ... 27
3.2 Photophysical properties of the four single cyano group electron donor materials ... 27
3.3 OSC optimization of four electron donor materials with single cyano substituent molecules ... 31
3.3.1 Comparison between PMHJ and BHJ of DTCTB devices ... 32
3.3.1.1 C60 based OSC ... 32
3.3.1.2 C70 based OSC ... 34
3.3.2 Optimization of different mixing ratio and thickness of active layer for DTCTB ... 36
3.3.2.1 C60 based OSC ... 37
3.3.2.2 C70 based OSC ... 39
3.3.2.3 Replacement of different blocking layer for DTCTB: C60 based OSC ... 42
3.3.3 Comparison between PMHJ and BHJ of DTCPB: C60 based OSC .... 46
3.3.4 Optimization of mixing ratio and thickness of active layer for DTCPB ... 48
3.3.4.1 C60 based OSC ... 48
viii
3.3.4.2 C70 based OSC ... 52
3.3.4.3 Insertion of blocking layer for DTCPB: C60 based OSC ... 55
3.3.7 Optimization of mixing ratio and thickness of active layer for DTCTBO... 65
3.3.7.1 C60 based OSC ... 65
3.4 Comparison of optimized device structures among four single cyano groups electron donor materials ... 70
3.5 Sun intensity variation measurements of OSCs with four single cyano groups electron donor materials ... 73
4 Chapter 4 Exciton dynamics in rubrene thin films ... 74
4.1 Introduction ... 74
4.2 Basic characteristics of amorphous rubrene thin films ... 75
4.3 TrPL of rubrene in toluene ... 76
4.4 TrPL of 100-nm rubrene thin film at 78 K with different excitation energy . 78 4.5 TrPL of 100-nm rubrene thin film at room temperature with different excitation energy ... 79
4.6 TrPL of 100-nm rubrene thin film at different temperatures with ultra-low excitation energy ... 80
4.7 TrPL of rubrene thin film with different thickness and different excitation energy at room temperature ... 84
5 Chapter 5 Conclusion ... 89
5.1 Summary ... 89
5.2 Future work ... 89
Appendix ... 91 Appendix. I Morphology for four single cyano groups electron donor materials91 Appendix. II Anisotropic characteristics of four single cyano groups electron
ix
donor materials... 93 References ... 95
x
Figure content
Fig. 1-1 (a) Operation principle and (b) J-V characteristic of an OSC. ... 3
Fig. 1-2 Comparison between planar mixed heterojunction and bulk heterojunction OSCs21 ... 5
Fig. 1-3 Striking a balance between JSC and VOC26 ... 6
Fig. 1-4 Molecular structures of the D-A-A electron donor materials with BO and BT moieties. ... 7
Fig. 1-5 (a) Germinate and non-germinate recombination. (b) Trade-off between ΔELUMO and PCE34. ... 8
Fig. 1-6 Shockley Queisser (SQ) limit for single junction solar cell55. ... 10
Fig. 1-7 Operation principles for singlet fission. ... 11
Fig. 1-8 (a) TrPL at 77 and 298 K68 and (b) energy diagrams of rubrene thin film. ... 12
Fig. 1-9 Magnetic field effect on (a) pentacene based OSC74 and (b) rubrene thin film68 ... 13
Fig. 1-10 Radiative lifetime of tetracene with various concentration of BC85. ... 15
Fig. 2-1 Device configurations. ... 19
Fig. 2-2 Set up of device performances measurement. ... 20
Fig. 2-3 Set up of EQE measurement. ... 21
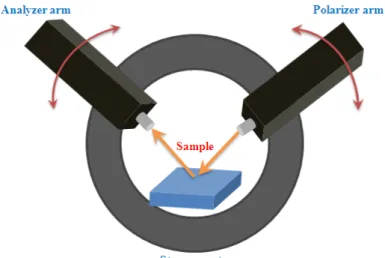
Fig. 2-4 Set up of variable incident angle ellipsometry ... 22
Fig. 2-5 Set up of Sun variation system ... 23
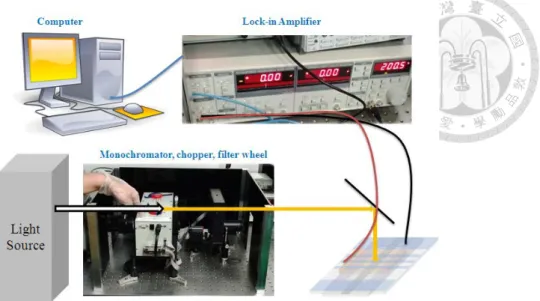
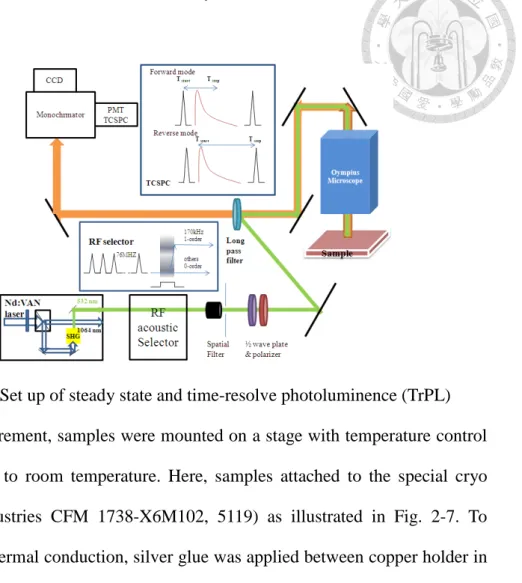
Fig. 2-6 Set up of steady state and time-resolve photoluminence (TrPL) ... 25
Fig. 2-7 Temperature-controlled sample holder. ... 26 Fig. 3-1 Molecular structures of (a) DTCTB, (b) DTCPB, (c) DTCPBO, (d)
xi
DTCTBO and (e) DTDCPB... 28 Fig. 3-2 Absorption spectra of the four molecules (a) in solution, and (b)
thin films. ... 29 Fig. 3-3 HOMO of DTCPB, DTCPBO, DTCTB and DTCTBO thin films
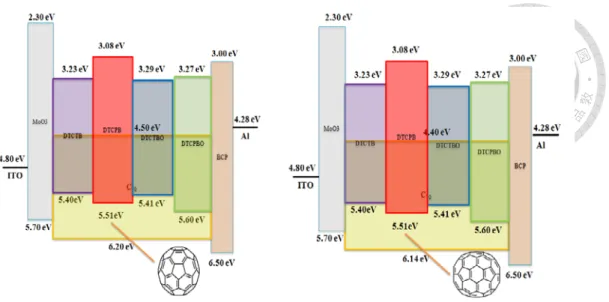
measured by photoelectron spectrometer. ... 30 Fig. 3-4 Energy diagrams of four single cyano groups moieties molecules
with C60 and C70 under simple bulk heterojunction ... 32 Fig. 3-5 J-V performances of devices from A-1 to A-4 under (a) dark
condition and (b) 1-sun solar illuminations. ... 33 Fig. 3-6 (a) EQE, (b) IQE and (c) absorption spectrum of devices from A-1
to A-4. ... 34 Fig. 3-7 J-V performances of devices from A-5 to A-7 under (a) dark
condition and (b) 1-sun solar illuminations. ... 35 Fig. 3-8 (a) EQE, (b) IQE and (c) absorption spectrum of devices from A-5
to A-7. ... 36 Fig. 3-9 J-V performances from of device A-4 to A-12 under (a) dark
condition and (b) 1-sun solar illuminations. ... 37 Fig. 3-10 (a) EQE, (b) IQE and (c) absorption spectrum of devices A-8 and
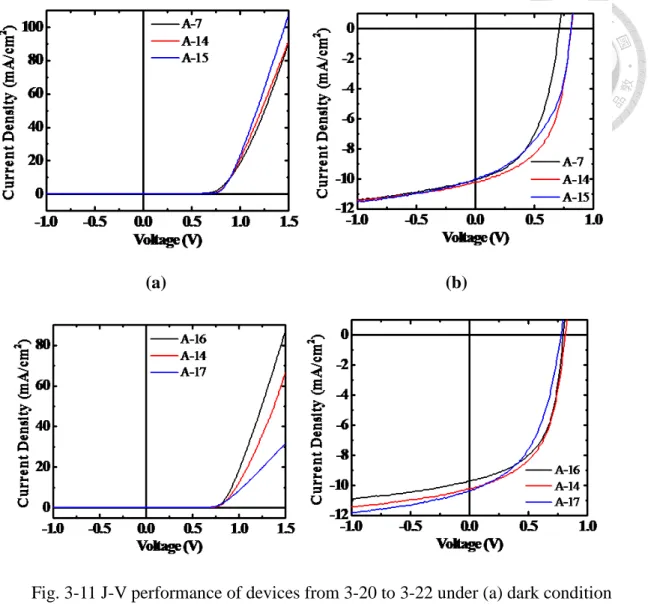
A-13. ... 39 Fig. 3-11 J-V performance of devices from 3-20 to 3-22 under (a) dark
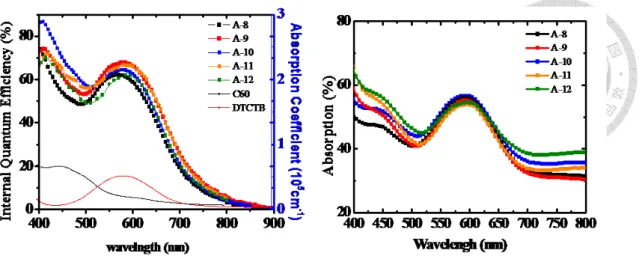
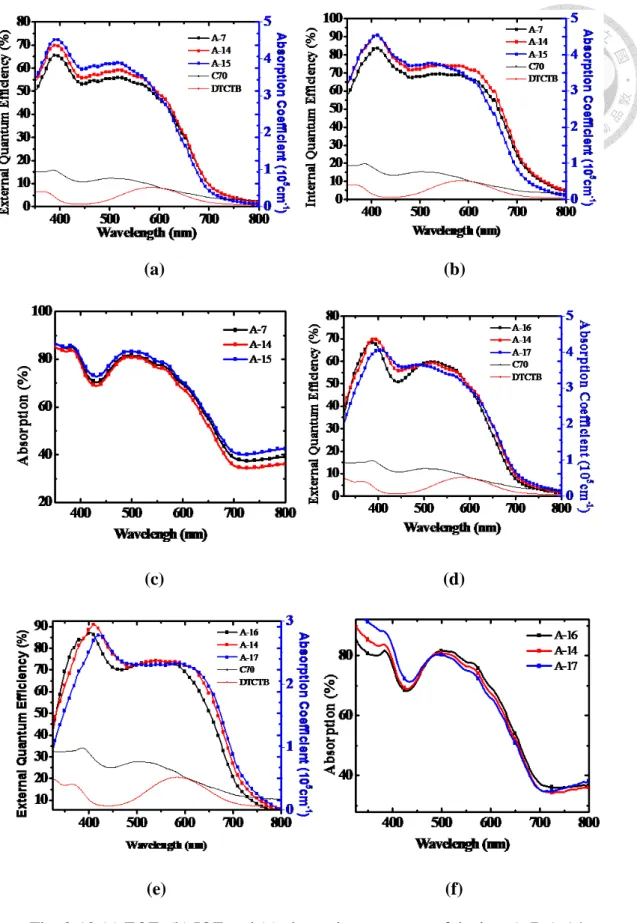
condition and (b) 1-sun solar illuminations. ... 40 Fig. 3-12 (a) EQE, (b) IQE and (c) absorption spectrum of devices A-7,
A-14 to A-15 with different mixing ratio and (d) EQE, (e) IQE and (f) absorption spectrum of devices from A-14, A-16 to A-17 with different thickness of active layer. ... 41 Fig. 3-13 Configurations of devices and energy diagrams for different
xii
blocking layer of DTCTB:C60 based OSC. ... 43 Fig. 3-14 J-V performances from A-18 to A-25 under (a) mCP inserted dark
condition and (b) 1-sun solar illuminations, (c) NPB inserted under dark condition and (d) 1-sun solar illuminations and (e) DTDTB
inserted under dark condition and (f) 1-sun solar illuminations. ... 44 Fig. 3-15(a) EQE, (b) IQE and (c) absorption spectrum mCP inserted OSC
and (d) EQE, (e) IQE and (f) absorption spectrum NPB inserted OSC and (g) EQE, (h) IQE and (i) absorption spectrum mCP inserted OSC and ... 46 Fig. 3-16 J-V performances of devices under (a) dark condition and (b)
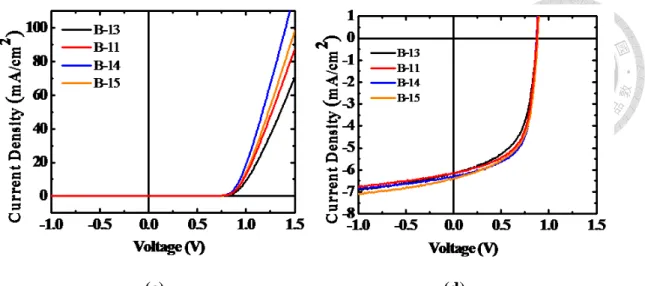
1-sun solar illuminations from B-1 to B-7. ... 47 Fig. 3-17 (a) EQE, (b) IQE and (c) absorption spectrum of devices from B-1 to B-7. ... 48 Fig. 3-18 J-V performances of devices for B-7, B-10 to B-15 with different
thickness under (a) and (c) dark condition and (b) and (d) 1-sun solar illuminations. ... 50 Fig. 3-19 (a) and (d) EQE, (b) and (e) IQE and (c) and (f) absorption
spectrum of devices in this section. ... 51 Fig. 3-20 J-V performances of devices from B-16 to B-20 of different
mixing ratio under (a) dark condition and (b) 1-sun solar illuminations and different thickness of active layer under (c) dark condition and (d) 1-sun solar illuminations. ... 53 Fig. 3-21 (a) EQE, (b) IQE and (c) absorption spectrum of devices with
various mixing ratio of mixing layers and (d) EQE, (e) IQE and (e) absorption spectrum of devices with different thickness of active layers for C70 based OSC. ... 54
xiii
Fig. 3-22 J-V performances of devices from B-5, B-8 to B-9 under (a) dark condition and (b) 1-sun solar illuminations ... 55 Fig. 3-23 (a) EQE, (b) IQE and (c) absorption spectrum of devices from B-5,
B-8 to B-9 with various thickness of blocking layers. ... 56 Fig. 3-24 J-V performances of devices from C-1 to C-2 as (a) linear, (b)
logarithm plots under dark condition and (c) 1-sun solar illuminations.
... 57 Fig. 3-25 (a) EQE, (b) IQE and (c) absorption spectrum of devices from C-1
to C-2 with various relative ratio between mixing and transport layers under 1-sun solar illumination ... 58 Fig. 3-26 J-V performances of devices for (a) different mixing ratio under
dark condition, (b) 1-sun solar illuminations and (c) different thicknesses of active layer under dark condition, (d) 1-sun solar
illuminations. ... 60 Fig. 3-27 (a) EQE, (b) IQE and (c) absorption spectrum of devices with
various mixing ratio of mixing layers and (d) EQE with different thickness of active layers for C60 based OSC. ... 61 Fig. 3-28 J-V performances of devices under various ratio for (a) dark
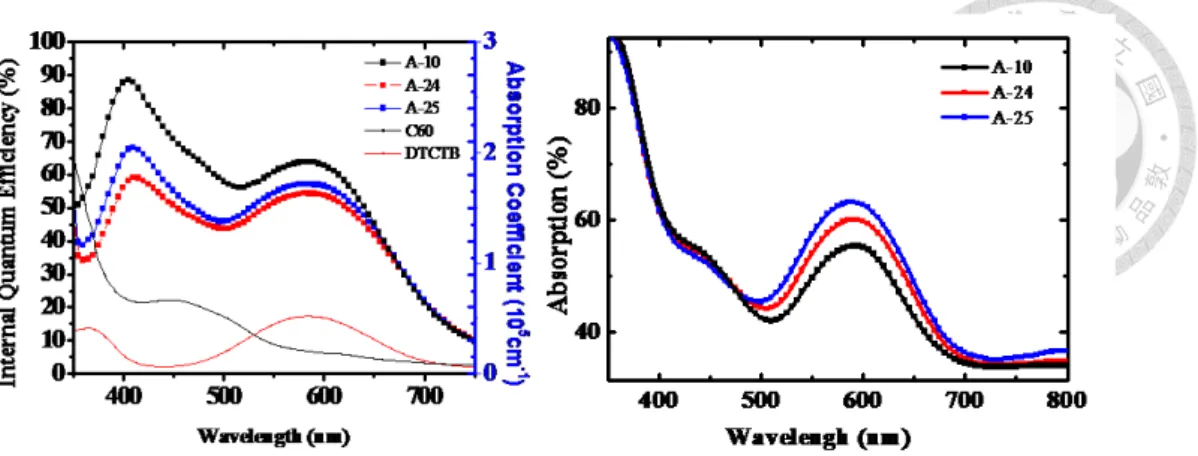
condition and (b) 1-sun solar illuminations (c) dark with logarithms plot and various thickness for (d) dark condition and (e) 1-sun solar illuminations ... 63 Fig. 3-29 (a) EQE, (b) IQE and (c) absorption spectrum of devices with
various mixing ratio of mixing layers and (d) EQE, (e) IQE and (e) absorption spectrum of devices with different thickness of active layers for C70 based OSC. ... 64 Fig. 3-30 J-V performance of devices from D-1 to D-6 under various ratio
xiv
for (a) dark condition and (b) 1-sun solar illumination and under different thickness for (c) dark condition and (d) 1-sun solar
illumination. ... 66 Fig. 3-31 (a) EQE, (b) IQE and (c) absorption spectrum with various mixing
ratio and (d) EQE, (e) IQE and (f) absorption spectrum for different thickness. ... 68 Fig. 3-32 J-V performances of devices to with different mixing ratio under
(a) dark condition and (b) 1-sun solar illuminations, and various
thickness under (c) dark condition and (d) 1-sun solar illuminations .. 69 Fig. 3-33 (a) EQE, (b) IQE and (c) absorption spectrum with various mixing
ratio and (d) EQE, (e) IQE and (f) absorption spectrum for different thickness. ... 70 Fig. 3-34 J-V performances of best devices for four compounds (a) C60
based under dark condition and (b) 1-sun solar illuminations and (c) C70 based under dark condition and (d) 1-sun solar illuminations.... 71 Fig. 3-35 EQE spectrums of best devices for four compounds (a) C60 based
and (b) C70 based ... 72 Fig. 3-36 Four parameters under sun variation for four compounds under
devices ratio 1:2.2, 70 nm thickness C70 based (a) VOC (b) JSC (c) FF (d) PCE. ... 73 Fig. 4-1 Normalized TrPL fluorescence decay response for thin-films 4-1
and 4-2 in (a) 40 ns window, and (b) 4 s window. ... 75 Fig. 4-2 Absorbance (A) versus rubrene thickness (l). ... 76 Fig. 4-3 Normalized TrPL fluorescence decay response for 10-5 M rubrene
in toluene in (a) 10 ns window, and (b) 0.6 s window. ... 77 Fig. 4-4 (a) Temperature independent of radiative decay of rubrene in
xv
polystyrene and (b) normalized absorption spectrum for rubrene in solution and thin film. ... 78 Fig. 4-5 Normalized TrPL fluorescence decay response for rubrene 100 nm
at 78 K in (a) 40 ns window, and (b) 0.5 s window. ... 78 Fig. 4-6 Normalized TrPL fluorescence decay response for rubrene 100 nm
at room temperature in (a) 2 ns window, and (b) 2 μs window. ... 80 Fig. 4-7 Normalized TrPL fluorescence decay for rubrene 100 nm at 0.047
μJ/cm2in (a) 1, (b) 5 ns window, and (c) 2 μs window under different temperatures. ... 82 Fig. 4-8 SF rates versus the reciprocal temperature. ... 83 Fig. 4-9 Normalized TrPL fluorescence decay response for 20, 100, 200 nm
rubrene under (a) 0.00329, (b) 0.049 (c) 136.8 (d) 1256.6 J / cm2 excitation density in 2.0 ns window. ... 85 Fig. 4-10 Normalized TrPL fluorescence decay response for 20, 100, 200
nm rubrene under (a) 0.00329, (b) 0.049 (c) 136.8 (d) 1256.6 J / cm2 excitation density in 2.0 s window. ... 87 Fig. 4-11 (a) τ1 and (b) τ2 values of 20, 100, and 200 nm rubrene thin
films. ... 87 Fig. 4-12 Normalized TrPL fluorescence decay response for different
thickness of rubrene for (a) 2 ns window, (b) 2 μs window, (c) τ2 versus thickness and (d) schema of caging effect. ... 88
xvi
Table content
Table. 3-1 Basic characteristics of DTCPB, DTCPBO, DTCTB and
DTCTBO in solution... 30 Table. 3-2 Basic characteristics of DTCPB, DTCPBO, DTCTB and
DTCTBO for thin film. ... 30 Table. 3-3 Device configurations from A-1 to A-4 of DTCPB:C60 OSC. The
unit is nm... 32 Table. 3-4 Performances of devices from A1 to A-4 under 1-sun solar
illumination. ... 33 Table. 3-5 Device configurations from A-5 to A-7 of DTCPB:C70 OSC. The
unit is nm... 35 Table. 3-6 Performances of devices from A-5 to A-7 under 1-sun solar
illumination. ... 35 Table. 3-7 Devices configuration of devices from A-4, A-8 to A-13. The unit is nm. ... 37 Table. 3-8 Performances of devices from A-4, A-8 to A-13 under 1-sun solar illumination. ... 38 Table. 3-9 Device configurations for different ratio and thickness of active
layer of A-7, A-14 to A-17 of DTCTB:C70 based OSC. The unit is nm.
... 39 Table. 3-10 Devices performance of different mixing ratio and thickness of
active layer for DTCPB/ C70 based OSC. ... 40 Table. 3-11 Device configurations for different blocking layers applied on
champion device for DTCTB:C60 based OSC. The unit is nm. ... 42 Table. 3-12 Devices performances of for different blocking layer of
xvii
DTCTB:C60 based OSC. ... 44 Table. 3-13 Device configurations for different relative ratio between
mixing transporting layer from B-1 to B-7 of DTCPB based OSC. The unit is nm... 46 Table. 3-14 Performances of device from B-1 to B-7 with various thickness
of mixing layer under 1-sun solar illumination. ... 48 Table. 3-15 Device configurations for different thickness and mixing ratio
of active layer for devices B-10 to B-15 of DTCPB: C60 based OSC.
The unit is nm. ... 49 Table. 3-16 Performance of device from B-7 to B-15 with various ratio
between mixing and transporting layers under 1-sun solar illumination ... 50 Table. 3-17 Device configurations of DTCPB: C70 based OSC from B-16 to
B-20. The unit is nm. ... 52 Table. 3-18 Performance of devices from B-16 to B-20 with various mixing
ratio and thickness of active layer under 1-sun solar illumination. ... 53 Table. 3-19 Device configurations of DTCPB based OSC for different
thickness of blocking layer from B-5, B-8 to B-9. The unit is nm. ... 55 Table. 3-20 Performances of device from B-5, B-8 to B-9 with various
thickness of blocking layer under 1-sun solar illumination ... 55 Table. 3-21 Device configurations for different relative ratio between
mixing transporting layer from C-1 to C-2 of DTCPBO based OSC.
The unit is nm. ... 57 Table. 3-22 Performance of device from C-1 to C-2 with various relative
ratio between mixing and transport layers under 1-sun solar
illumination ... 58
xviii
Table. 3-23 Device configurations of DTCPBO, C60 based OSC for different mixing ratio from C-2 to C-8. The unit is nm. ... 59 Table. 3-24 Performances of devices with different mixing ratio and
different thicknesses of active layer. ... 60 Table. 3-25 Device configurations of DTCPBO based OSC with different
mixing ratio and thickness. The unit is nm. ... 61 Table. 3-26 Performance of devices from C-9 to C-14 with various mixing
ratio and thickness under 1-sun solar illumination. ... 63 Table. 3-27 Device configurations of DTCTBO, C60 based OSC for
different mixing ratio and thickness of mixing layer from D-1 to D-6.
The unit served as nm. ... 65 Table. 3-28 Performances of devices with various mixing ratio and
thickness of active layer under 1-sun solar illumination. ... 66 Table. 3-29 Device configurations of DTCTBO, C70 based OSC for
different mixing ratio and thickness from D-7 to D-11. The unit is nm.
... 68 Table. 3-30 Performances of devices from D-7 to D-11 with various mixing
ratio and thickness under 1-sun solar illumination. ... 69 Table. 3-31 Device configurations of dye for C60 and C70 based OSC for
fine-tune mixing ratio and thickness. The unit served as nm... 71 Table. 3-32 Performances of dye for C60 and C70 based OSC for fine-tune
mixing ratio and thickness. The unit is nm. ... 72 Table. 3-33 Slope for VOC versus natural logarithm of the light intensity ... 73 Table. 4-1 Sample structures of thin films 4-1 and 4-2. ... 75 Table. 4-2 τ1 of different excitation densities for 100 nm rubrene at room
temperature. ... 80
xix
Table. 4-3 SF rates for different temperature from 78 K to RT ... 83 Table. 4-4 ∆E for different packing conditions of rubrene6590. ... 84 Table. 4-5 τ1 for different thickness under different excitation density. ... 85 Table. 4-6 τ2 for different thickness under different excitation density in
long time scale. ... 87 Table. 4-7 τ2 for different thickness of rubrene under 43 μJ/cm2 ... 88
1
1 Chapter 1 Introduction
1.1 Overview
In the first part of this thesis, we introduce device performances of solar cell
(OSC) with four electron donor materials,
7-(5-(di-p-tolylamino)thiophen-2-yl)benzo[c][1,2,5]thiadiazole-4-carbonitrile
(DTCTB), 7-(4-(di-p-tolylamino)phenyl)benzo[c][1,2,5]thiadiazole-4-carbonitrile (DTCPB),
7-(5-(di-p-tolylamino)thiophen-2-yl)benzo[c][1,2,5]oxadiazole-4-carbonitrile
(DTCTBO), and
7-(4-(di-p-tolylamino)phenyl)benzo[c][1,2,5]oxadiazole-4-carbonitrile (DTCPBO).
All these four electron donor materials exhibit donor-acceptor-acceptor (D-A-A) configuration. With optimization of device layer structures, OSC with DTCPB as the donor material exhibited the highest power conversion efficiency of 6.55%, with C70 as the electron acceptor material. In such a device, open circuit voltage (VOC), short circuit current density (JSC) and fill factor (FF) are 0.90 V, 11.12 mA/cm2, and 65.63%, respectively.
In the second part of this thesis, exciton dynamics for 5, 6, 11, 12-tetraphenyltetracene (rubrene) in different thickness were studied by transient photoluminescence (TrPL) measurement with varying pumping intensity and sample temperature. Under low temperature (78 K) and pumping intensity (0.049 μJ/cm2), fission and fusion dynamics can be obtained without singlet-singlet annihilation (SSA). With low excitation (no SSA) at different temperature, the activation energy of singlet fission (SF) was measured. We also found that the thinner rubrene (5 nm)
2
exhibited higher fusion rate, which may result from higher probability for non-germinate recombination. Such phenomenon was also observed when increasing the input power to the thicker film (100 nm rubrene at 43.4 μJ/cm2).
In this chapter, we will introduce the operation principle, device structure, D-A-A molecule system, and recombination mechanism of OSC. Then, physical mechanism of singlet fission (SF) will be introduced. Caging effect, which was observed in our experiments, will be illustrated. Then, exciton dynamics of pentacene and tetracene-based molecules were reviewed.
1.2 Small molecule organic solar cells
1.2.1 Introduction of OSC
Solar cell technology provides clean and renewable energy which converts the optical power (mainly from sun) to electric power and has attracted lots of attentions1,2. OSC, including macromolecule (polymer) and small molecule3,4, has advantages of low production cost, light weight and large fabrication area in consumer market comparing to the inorganic solar cells5,6.
A milestone for OSC was proposed in 1985, by C. W. Tang7et al. By using two organic materials, copper phthalocyanine (CuPc) and perylenetetracarboxylic derivative (PV) as donor and acceptor materials, respectively, it was possible to achieve power conversion efficiency up to 1% under AM2.0 illumination8. In 1992, an evidence for photo-induced charge transfer between a conducting polymer and buckminsterfullerene was claimed by F. Wudl9,10,11et al. Such fullerene derivatives, C60 and C70, were efficient electron acceptor materials, while the quantum yields in C70 were higher than C60 under the measurement of transient absorption12. Fig. 1-1 shows the operation principle of an OSC. First, (1) incident photons excite the
3
molecules to generate the singlet excitons, which are mainly the Frenkel excitons in active layer; (2) then, the excitons diffuse randomly inside the cell and reach D/A interface; (3) electron-hole pairs are generated from excitons are dissociation by built-in potential and (4) finally, electron and holes transport via acceptor and donor materials which are be collected by the electrodes13.
Fig. 1-1 (a) Operation principle and (b) J-V characteristic of an OSC.
There are several parameters which can be extracted from a typical J-V characteristic under light illumination, as shown in Fig. 1 (b). Open circuit voltage (VOC) is defined as the voltage at zero current density, related to the energy offset between the highest occupied molecular orbital (HOMO) of donor and the lowest unoccupied molecular orbital (LUMO) of acceptor. The short circuit current (JSC) represents the current under the zero applied bias, which can be improved with the use of small band-gap organic material. Along the J-V characteristics, one can find a point which delivers maximum electrical power, with voltage and current density at Vmp
and Jmp, respectively. Fill factor (FF) corresponds to the area ratio between multiplication of Vmp×Jmp and VOC×JSC. This important parameter is closely related to series resistance (Rs) and shunt resistance (Rsh), which are the mainly determined by carrier mobility and leakage recombination, respectively. The final efficiency (PCE) can be calculated as the multiplication for JSC, VOC and FF.
4
1.2.2 Bulk heterojunction configuration
14Exciton dissociation of OSC was achieved by D-A interface, which provides the potential to overcome the strongly binding energy of the exciton (e.g., ~0.3–0.5 eV)15,18. Mixing of donor and acceptor materials can effectively improve exciton dissociation16. It was first given by M. Hiramoto et al. in 1992. They applied a p-i-n structure which i-layer was constructed by mixing p-type phthalocyanine (PC) and n-type perylene derivative (PTC). This three-layer OSC doubled the photo-generate-current compared to the two layer ones17. In 2000, T. Tsuzuki et al.
doped the titanylphthalocyanine (TiOPc) with a fullerence (C60) and achieved a PCE of 0.63%.18 In 2003, D. Gebeyehu et al. blended zinc-phthalocyanine (ZnPc) as electron donor and C60 as electron acceptor to raise the efficiency to 1.04% with a proper transporting layer19. The mixing ratio of donor and acceptor materials strongly impacted the performance. But this p-i-n architecture limited the thickness of the mix layer in the middle due to the poor carrier collection efficiency within 30 nm. As shown by S. Uchida et al. in 2004,20 with a traditional organic materials copper phthalocyanine (CuPc) blending with C60, the PCE can be as high as 3.6%, 3.5% and 3.3% under 0.3, 1 and 2.4 suns, respectively which showed the recombination limited behaviors.
In 2014, Y. Zou et al. used a simple bulk heterojunction for OSC to boost up the efficiency to 7.9%21. The active region of the OSC consisted of a mixed layer with 2-{[7-(4-N,N-ditolylaminophenylen-1-yl)-2,1,3-benzothiadiazol-4-yl]methylene}mal ononitrile (DTDCPB) as electron donor material and fullerene C70 as the electron acceptor material, respectively. DTDCPB is a donor material with the molecular configuration of donor-acceptor-acceptor (D-A-A). As shown in Fig. 2 (a), the active region was sandwiched by neat donor and acceptor materials, which is called planar
5
mixed heterojunction (PMHJ) structure. The neat donor and acceptor in Fig. 2 (a) can be replaced by a high mobility buffer layer MoOx in Fig. 2 (b) which reduced the resistance of the cell. This architecture can effectively reduce the non-germinate recombination for electrons and holes on the interfaces of the planar layers that usually happened in PMHJ-OSC and led a high fill factor over 0.65.
(a) (b)
Fig. 1-2 Comparison between planar mixed heterojunction and bulk heterojunction OSCs21
1.2.3 D-A-A system organic materials
In this section, we will introduce the donor materials with asymmetric donor-acceptor-acceptor (D-A-A) configurations22. The concept of D-A-A systems originally came from the configuration D-π-A which was used to in the dye-sensitizers solar cell23,24. Maintaining the advantages for strong benzothiadiazole moiety and quinoid character, an inceptive compound2-{[7-(5-N,N-ditolylaminothiophen-2-yl)-
2,1,3-benzothiadiazol-4-yl]methylene}malononitrile (DTDCTB) was synthesized and
PCE up to 5.81% was obtained 25 . Then,
2-{[7-(4-N,N-ditolylaminophenylen-1-yl)-2,1,3-benzothiadiazol-4-yl]methylene}mal ononitrile (DTDCPB), which replaced the thiophene groups by phenylene, showed a higher PCE for 6.8%26. From the electron donor endcap architecture, the electron-rich
6
and fortified quinoidal characters of thiophene functional groups of DTDCTB resulted in the redshift (50-70 nm) in absorption spectra, compared to phenylene attached molecules, DTDCPB. It increased the JSC of DTDCTB-based OSC, compared to DTDCPB-one. This was not only due to the packing of the molecular which laid for a coplanar conformation between the thiophene and BT rings with a small dihedral angle in comparison with phenylene (with ortho−ortho steric interactions by single crystal X-ray crystallography) but also the support electron-rich of thiophene for better π-electron delocalization as shown in Fig. 1-3. However, owing to the electron-rich nature of thiophene of DTDCTB, it showed a smaller oxidation potential than phenylene-containing molecule (DTDCPB) and resulted in a lower VOC, and hence PCE. When replacing the p-tolyl substituent of DTDCPB into hydrogen bond, 2-{[7-(4-N,N-diphenylaminophenylen-1-yl)-2,1,3-benzothiadiazol-4-yl]methylene}m alononitrile (DPDCPB) exhibited a higher oxidation potential which resulted in a better VOC. And it resulted in the blue shift of absorption spectra and hence lower JSC. Compromising the JSC and VOC, DTDCPB exhibited the highest PCE=6.8%27.
Fig. 1-3 Striking a balance between JSC and VOC26
Further, a substitution for benzochalcogenodiazole unit was also possible to adjust the photophysical properties as shown in Fig. 1-4. Here, 2,1,3-benzoxadiazole (BO) was adopted as the central bridging acceptor of DTDCPBO, which resulted in red shift of absorption spectra ~10 nm compared to 2,1,3-benzothiadiazole (BT)
7
bridged molecules, DTDCTBO, due to a larger electronegativity of the oxygen atom and a lower HOMO level, owing to the decrement of the energy for frontier orbital28. However, although OSC devices based on BO materials exhibited longer absorption spectra and higher JSC, the FF was lower due to more serious bimolecular recombination, compared to those based on BT ones.
Fig. 1-4 Molecular structures of the D-A-A electron donor materials with BO and BT moieties.
1.2.4 Recombination mechanisms of OSC
There are mainly two basic recombination routes in OSCs29,30: germinate and nongerminate (bimolecular) pair recombination. For the first-order germinate loss, recombination happens before it splits into charge. It is population independent because it is only driven by coulomb attraction. After the exciton bonding pair is totally dissociated, there is still possible for carriers to encounter (collide) and meet each other before they are collected by electrodes, which is called bimolecular recombination. This loss depends on the populations of carriers. It is noted that bimolecular recombination is likely to happen via reformation of interfacial charge transfer states. Typically, recombination mechanisms were studied by transient photoconductivity31, time-of-flight32. Besides, it can be investigated by light intensity dependent measurement33.
8
Eq. 1 illustrates the relation between VOC and JSC. Here, n and JOL are the ideal factor and the leakage current, respectively. Typically, n equals to 1 for the ideal diode and falls on 1.0-2.0 for OSCs. For an OSC dominated by bimolecular recombination, n is 1.0. On the other hand, trap assisted Shockley-Read-Hall (SRH) recombination resulted in n=2.
(1)
(a) (b)
Fig. 1-5 (a) Germinate and non-germinate recombination. (b) Trade-off between ΔELUMO and PCE34.
The lowest unoccupied molecule orbital (LUMO) energy offset between donor and acceptor, ΔELUMO, also take place in germinate pair dissociation here34. This offset will not only play an important role in charge transfer (CT), but also attribute to free carriers dynamics. Literatures had been report that a higher ΔELUMO (>1 eV) resulted to a better electric properties for a promotion in FF and quantum efficiency35 compared to a modest one (0.2-0.3 eV). Note that this is valid when the donor material is the main absorber. On the other hand, when the acceptor material is the main absorber, ΔEHOMO is the dominating factor. Anyway, this offset will oppositely
JOL ln Jsc q
= nkT Voc
9
expend too much exciton energy during dissociation if the value lying too high, so the trade-off between for its limitation is shown in Fig. 1-5 (b).. This difference can also relative to the charge energetic driving force for separation ΔGCS=Eg - (IPD - EAA), which shows a charge separation dependence (~ΔELUMO)36 by providing a 40%/eV enhancement in charge collection efficiency37. IPD and EAA represented to an ionized potential and electron affinity for donor and acceptor, respectively.
1.3 Singlet fission
1.3.1 Introduction
In a single junction solar cell, only photons with the energy above the band gap can be absorbed and contribute to JSC, which means band gap should be as small as possible for higher JSC. On the other hand, for a photon with higher energy than bandgap, it generate a high energy electron-hole pair, which losses the energy via heat to the bandgap and extract out the solar cell. Hence, the bandgap determines VOC. Larger bandgap is needed for higher VOC and shows a tradeoff with JSC, which is called the Schlocky Queasier (SQ) limit38 as shown in Fig. 1-6. One way to overpass the SQ limit is by using multi-exciton generation (MEG) and multi-carrier generation (MCG). By using a narrow bandgap material (VOC is limited), however, one high energy photon can generate more than one exciton (carrier) and greatly improve the JSC value. Such phenomenon was found in several materials, such as quantum dot39, carbon nanotube40, indirect-band gap semiconductor41,42 and organic materials43,44. In this thesis, we will focus on the MEG in organic material. By splitting one singlet exciton into two triplet exciton, which is called singlet fission (SF), it shows the possibility to obtain a high internal quantum efficiency over 100%45,46,47,48,49
.
10
Fig. 1-6 Shockley Queisser (SQ) limit for single junction solar cell51.
For archetypal polyacene based materials, early in 1965, S. Singh et al. observed the prompt- and delayed-fluorescence under short-pulse laser excitation from anthracene single crystal. Here, the authors claimed that the prompt-fluorescence came from the singlet emission, while the delayed-one may involve triplet states50. In 1968, C. E. Swenberg et al. proposed the possibility of SF to explain the low quantum yield of tetracene (0.002 in room temperature)51. In the same year, N. Geacintov et al.
observed the fluorescence increase of tetracene crystal under a magnetic field, due to lower SF rate52. Besides, they also found that the activation energy of tetracene was around 0.16 eV by temperature-dependent measurement. In 1969, R. P. Groff et al.
obtained the fission and fusion rates of 0.63 ns-1 and 9×10⁻¹⁰ cm3 s-1 in tetracene crystal53.
SF is a physical phenomenon that occurs in certain organic materials, especially in the aromatic hydro base materials54,55,56,57,58
. For SF, energy for one singlet exciton must be as about double as its energy for triplet exciton. The operation principle is shown as in Fig. 1-7 When one chromophore is excited by an incident photon and jumps to an excited state (generating one singlet exciton, spin=0), it is possible to share the energy to its nearby chromophore (if close enough) and split into two independent triplet excitons (spin=1) with the energy around half. In SF process,
11
energy and spin are conserved. If the two triplet excitons can be dissociated completely into free carriers, it hinders that two electron-hole pair can be generated by just a single photon so the internal quantum efficiency will be 200% theoretically.
Such exciton dynamics can be observed by transient photoluminescence (TrPL) measurement. Delayed fluorescence in TrPL comes from the singlet excitons generated by two triplet excitons (which is called the fusion process), due to the long lifetime of the triplet exciton (µs) compared to singlet one (ns).
Fig. 1-7 Operation principles for singlet fission.
1.3.2 Exciton dynamics of aromatic based materials
In this section, we will introduce some important researches on excitonic photochemistry of aromatic hydrocarbon materials (ex: tetracene and anthracene). An ultrafast SF rate for 80 fs in polycrystalline penetacene was demonstrated by M. W.
Wilson et al., which competed with phonon-mediated exciton localization processes59. On the other hand, SF rate was 80 ps in polycrystalline tetracene60. For the sublimed rubrene film, SF process competed with the formation of polaron pair which resulted in a fast decay of 2.5 ps, and delay fluorescence was strongly dependent to laser excitation61. The SF rate of hexacene, a six-ring acene, was 0.19 ps. Singlet exciton can split into three triplets in such a material69. Besides, there are lots of tetracene and
12
pentacene derivatives exhbiting SF characteristics, due to their favorable molecular packing70,62.
Due to strongly π stacking in tetracene, tetracene molecules tends to crystallize under room temperature which forms excimer and compete with SF process. On the other hand, the four phenyl groups of rubrene helps to separate the molecules apart and reduce excimer formation63,64. As shown in Fig. 1-8 (a)., TrPL of rubrene thin film is quite different under 77 K and 298 K in the 20 ns window. At 298 K, intensity decreased fast due to strong SF process. On the other hand, single exponential slow decay was observed under 77 K, which suggested that such SF in rubrene thin film was a thermally activated process, as shown in Fig. 1-8 (a). For SF process, singlet exciton underwent a dark state (2T state, which is optical forbidden) before split into two triplets. And hence, thermal energy was needed to overcome the energy offset between S and 2T. For example, [2E (T1) - E (S1)] values of tetracne, rubrene solution, single-crystal rubrene, DPT (5, 12-diphenyl tetracene), and pentacene are 190 meV65, -12 meV65, 50 meV6689, -87 meV67, and -0.11 eV, respectively.
(a) (b)
Fig. 1-8 (a) TrPL at 77 and 298 K64 and (b) energy diagrams of rubrene thin film.
Magnetic field effect gives more powerful evidence into exciton dynamics under
13
SF process. Nine triplet states under magnetic field will be rearranged, which reduces the SF rate68. Fig. 1-9 (a) shows photocurrent of an OSC with increasing magnetic field69. When the strong magnetic field applied to a pentacene base OSC, the allow state decreases from nine to three to suppress the SF rate and deceases the photocurrent from SF. When increasing the magnetic field, JSC resulting from tetracene reduces due to the suppression of SF under magnetic field while that from C60 keeps the same because it is insensitive to the magnetic field. Fig. 1-9 (b)shows the TrPL of rubrene thin films. One can see that magnetic field reduced the SF process, and hence increased the optical intensity.
Fig. 1-9 Magnetic field effect on (a) pentacene based OSC69 and (b) rubrene thin film64
For single crystal rubrene, L. Ma et al. found the triplet exciton formation on the time scale of 200 fs while intersystem cross channel can be neglected (<0.05%)70 Observed by A. Ryasnyanskiy et al., SF and triplet fusion rates are very high. And the triplet lifetime is about 100 μs71. For X. Wenet al., they investigated the singlet and triplet dynamics under different vibration band, and an ultrafast characteristic for carrier scattering and phonon scattering within 100 fs and 47 ps was observed, respectively72.
14
1.3.3 Caging effect
Caging effect, a diffusion-mediated73 process, was first observed in solution.
Early in 1936, Frank and Rabinowitch tried to explain the reason for different germinate recombination rates in iodine atoms dissociated from excited I2 in solution compared to the gas phase74,75. After, cage effect was defined76: for a molecular under a densely condition, gas or solution77, molecules are hard to interact or diffuse due to the surrounding solvent molecules. Reactance species acted as caged by the solvent molecules and this effect relied on the radical radius and radical mass of the solvent78, which was also known as the Franck–Rabinowitch effect.
There are some techniques to perform a ‘cage’ by a small volume confinement spacing design. One can grow small crystallite inside frozen glasses79, one dimension plasma80 or by an incomplete thermal evaporation on a suitable substrate to form molecular islands. The motivation is to diminish the crystal size in which exciton is free to move. Caging effect is more significant in anisotropic materials such as tetracene and anthracene. Exciton in these kinds of materials will be restricted to a given plane, for example, ab plane for tetracene81. For SF materials, triplet-triplet (T-T) annihilation rate will depend on the concentration of exciton and the volume of the thin film domain.
An experiment was performed by S. Arnold et al. in 197582,83. They mixed the host material tetracene (the source of triplet exciton) into a high concentration of guest exciton reflecting molecules, 2, 3-benzocarbazole (BC). This skill had been performed by Hichestrasser and Whiteman to exhibit a “one dimension” crystal84. If the exciton caging can be formed, the triplet concentration of tetracene should be high enough to produce a non-germinate (bimolecular) recombination than neat films (no caging) even at a low prompt intensity. By varying the containment of BC, a
15
consequent for caging effect can be observed. As shown in Fig. 1-10, the fluorescence lifetime increase from 100 ps to 360 ps by varying the BC concentration from 0% to 50% implied that the caging effect became serious and blocked the SF channel which increased radiative lifetime.
Fig. 1-10 Radiative lifetime of tetracene with various concentration of BC82.
1.4 Motivation
There are two parts in this dissertation. First, four small molecule donor material with D-A-A structure configuration were employed in organic solar cells.
Compared to our previous works, end acceptor of these materials were modified from dicyanoethylene into single cryno group85. The HOMO levels were higher lying for triggering the charge transfer and separation state. Besides, the thermal properties of these materials were being improved. These four materials were provided by Dr.
Hao-Chun Ting and Prof. Keng-Tsung Wong’s group, Department of Chemistry, National Taiwan University. To pursing a high efficiency, a series of optimization in OSCs were taken with bulk heterojunction structure.
Second, exciton dynamics of amorphous rubrene thin film with different thicknesses was studied under different temperature and excitation energy by TrPL, supported by Dr. Juen-Kai Wang, Center for Condensed Matter Sciences, NTU, and Institute of Atomic and Molecular Sciences, Academia Sinica. A rate equation was
16
used to explain the dynamics and the parameters (such singlet fission rate, triplet fusion rate, singlet-singlet annihilation rate…) was quantitatively extracted from our TrPL results.
17
2 Chapter 2 Experiments
2.1 Introduction
In this chapter, all the fabrication and measurement systems in this thesis will be introduced.
Thin-film structures for OSC and SF studies in this thesis we obtained by thermal evaporator under high vacuum. Suitable patterning and treatments were applied before the thin-film process. And the encapsulation process was performed directly after the thin-film evaporation.
For OSC thin-film and devices, J-V characteristics under dark and 1-sun illumination was performed for calculating device performances such as VOC, JSC, Rs, Rsh, FF, and PCE. Recombination mechanism in our OSCs was studied by varying the illumination intensity of solar simulator. External quantum efficiency and absorption spectra were measured and hence internal quantum efficiency can be obtained.
Besides, photoelectron spectroscopy and elliposometry measurements were performed for the energy levels and optical constants of organic thin-films, respectively.
In our SF study, transient trPL was used with various laser pulse energy under different sample temperatures (77K to room temperature).
2.2 Device fabrication and measurement systems for OSC
2.2.1 Substrate patterning
Glass substrates with 150-nm indium tin oxide (ITO) were used (Lumtec Corporation, resistance 15 Ω/square). ITO pattern was obtained through
18
photolithography and etching processes in the clean room.
First we cleaned the substrates by detergent (DI water with detergent 10:1), acetone and isopropyl alcohol (IPA) consecutively each for 10 min and dried it with nitrogen gun. Then spin the positive photoresist (PR, S1813) on the substrates with two different rotation speed and time (550 and 1250 rpm for 5 and 25 sec respectively). followed by 10 min hard-bake to solidify the film. UV exposure (for 13 sec with photo masks followed by developine process (MF 319) for 13 sec was used to obtain the PR pattern. After that, soft bake was applied by remove the redundant vapor. Then, aqua regia (mixed by HCl: HNO3= 3:1) was used to etch the ITO without PR. Finally, acetone was used to remove the PR in the substrate. Then, patterned substrates were cut into 1.78 × 2.78 cm2 for the following processes.
2.2.2 Device fabrication
All the devices were fabricated in the thermal evaporate system under a high vacuum (1×10⁻⁶ torr) which included 7 thermal cells for small molecule organic materials and 3 boat for metal and C60. Evaporation rates for materials were monitored (Mextek 350, 400) by the sense of quartz crystal microbalance (QCM).
With proper shadow masks for both organic materials and metal, active region can be defined for 0.04 cm2 which contained three pixels on a substrate. Samples were then transferred to a 99.999% (5N) N2 glove box with the concentration of O2 and H2O below 0.1 ppm. After spreading the UV glues at the peripherals of the cover glass and attaching it with the thin-film substrates, samples were illuminated by UV lamp for 12 minutes to solidify the UV glues. Such encapsulation provided reliable storage lifetime at least over two weeks.
19
Fig. 2-1 Device configurations.
2.2.3 Device performances measurement
In device performances measurement, OSCs were illuminated by a class-A solar simulator (Newport Model 94022a) under a standard condition (1-sun, 100 mW/cm2, air mass (AM) 1.5G) as shown in Fig. 2-2. The solar simulator was calibrated regularly to prevent from the decay of the lamp (155W) with measuring distance of 2.5 inches. Hence, uniform illumination region with precise illuminance can be achieved. Manual shutter was used when measuring the dark current of the OSCs, which were connected to power meter (Keithley 2400). A computer was used to control the power meter via GIPB interface for obtaining the J-V characteristics and analyzing the device parameters such as VOC, JSC, RS, RSH, FF and PCE. The solar simulator system is supported by Prof. Tien-Lung Chiu in Yuan Ze University, Taoyuan Taiwan.
20
Fig. 2-2 Set up of device performances measurement.
2.2.4 Measurement of external quantum efficiency (EQE)
Setup of EQE measurement was shown in Fig. 2-3. A halogen light source (Newport Model 66901) supported by power supply (Newport Model 69907) gave a continuous white light source which passed the monochromator (Oriel Conerstone130 1/8m) with a precise grating working for 200-1200 nm. Then it passed through a chopper with the rotation speed 350 Hz, controlled by a chopper controller (Stanford Research system SR540) which connected with lock-in amplifier (SR-830) to eliminate the noise from environment. After that a filter wheel (Newport 74040) was constructed to cancel the 2nd diffraction from grating in monochromator. A silicon photodiode was employed to calibrate the input photon density (count the photon number). Then the photocurrent was measured by lock-in amplifier (count the numbers of electron) and sent the information to computer via GPIB interface and the software was procvided by Forter Technology Corporation. EQE spectra can obtained by the ratio between photon and electron numbers.
21
Fig. 2-3 Set up of EQE measurement.
2.2.5 Absorption spectrum measurement
To gain the value for internal quantum efficiency (IQE), we have to measure the absorption spectra for the devices. A commercial spectrometer U4100 by Hitachi was employed and gives a wide range for absorption measurement from 240 nm to 2600 nm. Due to the zero transmission of metal cathode in OSC devices, we can obtain the absorption spectra from reflection spectra. And IQE spectrum can be achieved by using the EQE spectrum dividing the value for absorption spectrum from the equation below. The spectrometer were supported by Man-Kit Leung's Lab in Chemistry Department of National Taiwan University.
EQE (%)
abs (%) = IQE (%)………(2)
2.2.6 Measurement of optical constants
We can realize the optical characteristic and packing situation for molecules under the measurement of ellipsometry. In this research, a variable incident angle ellipsometry SOPRA GESP5 (Gonio-Ellipso-Spectro-Photometer) which was support by Radiation Technology was employed, shown in Fig. 2-4. For ellipsometry system,
22
we detected the elliptically polarized reflect light from the dielectric organic thin film by input a plane polarized beam. With extracting the information for amplitude and phase of the polarization from neat film which were deposited on the n-type silicon substrate with reflection mode, we can simulate and scan by these data then get the values for anisotropic refractive index and extinction coefficient accurately in scanning mode, without destroyed the thin film morphology. This variable angle goniometer constructed by an analyzer and polarizer (Xe lamp include) arm, which can be mounted by stepper meter and high-resolution monochromator, photon counting detector is contained. During the scan, the detected signal were collected into a optical fiber which connected to a monochromator.
Fig. 2-4 Set up of variable incident angle ellipsometry
2.2.7 Sun variation system
A sun variation experiment is powerful to give the standpoint for exciton and carrier behavior because a power dependent can separate the recombination between exciton and charges. The system is built as shown in Fig. 2-5. A Wacom light source for radiative parallel luminous of high luminous (Wacom HX-504) with a tunable input current supported (Wacom XDS-501SG) had ability for varied the incident
23
power from 0.001 to over 1sun.
The value of sun can be accurately measured and calibrated by a silicon diode (Model 99150 V). By tuning the wanted sun value detected by reference cell, our solar cells were replaced on the holder. All the measurements were taken under the dark room to preventing the noise from the environment, especially under low intensity measurement. And to avoid the thermal formation during the measurement, each test will place over 1 min to cool down when the measurement is too frequently.
The system is also supported by Prof. Tian Lung Chiu in Yuan Ze University, Taoyuan Taiwan
Fig. 2-5 Set up of Sun variation system
2.3 Sample fabrication and measurement systems for exciton
dynamics
2.3.1 Samples fabricated for exciton dynamic investigation
All the samples were fabricated under the same evaporation system as mentioned in section 2.2.2. Rubrene and LiF thin film were deposited on the quartz and glass substrates under high vacuum, which the quartz purity over 99.99% and the
24
transmission also greater than 95% in visible region. The samples then transfer to the nitrogen glove box to seal it with UV glues.
2.3 2 Steady state and time-resolve photoluminence (TrPL) at different temperatures
In this research, exciton dynamic was studied by the measurement of steady state photoluminence and TrPL. The system is established and supported by Dr. Pin-Hao Sher from Prof. Juen-Kai Wang's group in Institute of Atomic and Molecular Sciences, Academia Sinica, Taiwan and the detail construction was shown in Fig. 2- 6.
A Nd:VAN (High Q IC-1064-15000) laser source with 1064 nm emission wavelength was employed in this research. Laser pulsewidth was 6.5 ps in full width at half maximum (FWHM) with its origin repetition rate 76 MHz. The pulse passed through a second harmonic generation (SHG) crystal which generated 532 nm pulses.
Then the radio frequency (RF) acoustic pulse selector changed the repetition rate by by producing a periodic wave grating to reflect the unwanted pulses. The repletion rate we chose was 170 kHz. A first 4X lens and aperture served the function of space filter to eliminate the frequency noise from the light source. A combination for half wave plate and broad band polarizer (SM1PM10) was used to vary the input intensity.
By using the power meter diode (818-UV) and optical power meter (1916C, Newport) before the microscope, an accurate intensity density (in terms of W) can be measured. It can monitor and focus the sample by microscope (Olympus BX61W1) in front of sample. After passing the long pass filter, the reflecting fluorescence signal coming from samples went through the same path and back to the detector. To detect the signal, one can obtain the steady state behavior by detecting the signals with Charge-coupled Device (CCD) (Andor DU920P BR-DD) or transient characteristic by Time-Correlated Single Photon Counting (TCSPC) system with reverse mode to delay
25
the time, all the fluorescence was collected by monochromator (Horiba Jobin Yvon MicroHR).
Fig. 2-6 Set up of steady state and time-resolve photoluminence (TrPL) In our measurement, samples were mounted on a stage with temperature control system from 77K to room temperature. Here, samples attached to the special cryo carrier (Cryo industries CFM 1738-X6M102, 5119) as illustrated in Fig. 2-7. To provide a better thermal conduction, silver glue was applied between copper holder in cryo carrier and samples. The base pressure of the measurement chamber is 1×10⁻⁵ by turbo pump (Varian vacuum tec TPS-compact). Liquid nitrogen was used to cool down the system to 77 K. Under the temperature controller (Lakeshore 331), the heater can control the temperature in carrier.
26
Fig. 2-7 Temperature-controlled sample holder.
27
3 Chapter 3 Optimization of bulk heterojunction OSC for
D-A-A configuration molecule with single cyano group as
the electron donor material
3.1 Introduction
In this chapter, four novel p-type electron donor materials, DTCPB, DTCTB, DTCPBO and DTCTBO were investigated and fabricated into OSC. These compounds were synthesized and supported by Prof. Keng-Tsung Wong’s group, Department of Chemistry, National Taiwan University. Compared with the previous work86, dicyanovinylene (DCV) groups were replaced by single cyano in our study to provide larger ΔELUMO between electron donor and acceptor materials, which improves exciton dissociation at donor/acceptor interface and reduce recombination.
With systematically engineering the OSC device structures based on these four electron donor materials and C60 and C70 as the electron acceptor materials, we found that the optimized ones were bulk heterojunction due to their superior FF values. In our optimized device structures, power conversion efficiencies of DTCPB, DTCTB, DTCPBO and DTCTBO based OSCs were 6.55%, 4.40%, 5.98%, 4.65%, respectively.
Incident illumination power was varied for studying the recombination characteristics of OSCs with different electron donor materials.
3.2 Photophysical properties of the four single cyano group electron
28
donor materials
Fig. 3-1 Molecular structures of (a) DTCTB, (b) DTCPB, (c) DTCPBO, (d) DTCTBO and (e) DTDCPB.
Fig. 3-1 shows the molecular structures of DTCPB, DTCTB, DTCPBO and DTCTBO, respectively, which were originally modified from the compound 2-{[7-(4-N, N-ditolylaminophenylen-1-yl)-2,1,3-benzothiadiazol-4-yl]methylene}
malononitrile (DTDCPB), as shown in Fig. 3-1 (e). All these organic materials were synthesized by Prof. Keng-Tsung Wong’s group. With connecting a single cyano moiety attached as the electro-withdrawing end-group, LUMO value can be easily raised up (1 eV higher than acceptor) while maintaining a HOMO value which provides a suitable D-A electro-withdrawing ability compared to an over-strong one
29
in DTDCPB to prevent the formation of dipoles. The entire chemical configuration for four compounds with single cyano groups were shown in Fig. 3-1 However, there is one disadvantage for these four materials that the wide bandgap characteristics (higher LUMO with the same HOMO, compared to DTDCPB) results in blue-shift in absorption spectra combined with the lower absorption ability.
The differences between these four compounds are illustrated below: from the electron donor endcap, the electron-rich and fortified quinoidal characters of thiophene functional groups of DTCTB and DTCTBO result in the redshift (50-70 nm) in absorption spectra, compared to phenelyne attached molecules, DTCPB and DTCPBO. Then, considering the central bridging electron-withdrawing unit, benzoxadiazole (BO) and benzothiadiazole (BT), absorption spectra of BO-based molecules (DTCPBO and DTCTBO) are redshifted compared to those of BT-based ones (for DTCPB and DTCTB).and the HOMO levels were also deep-lying. Fig. 3-2 shows the absorption spectra of these four molecules in solution (CH3Cl) and thin films (by thermal evaporation).
Fig. 3-2 Absorption spectra of the four molecules (a) in solution, and (b) thin films.
The absorption peak for DTCPB, DTCPBO, DTCTB and DTCTBO are 491, 518, 563 and 583 nm for solution and 511, 537, 583, 600 nm for thin film, respectively.
30
HOMO values of these thin film measured by photoelectron spectrometer are shown in Fig. 3-3. The phenylene-containing groups help to lower the HOMO value respect to thiophene by ~0.1 eV, this shows a similar result in BO and BT moiety. All the parameters and thermal properties for intrinsic parameters were reorganized in the Table. 3-1 and Table. 3-2.
Fig. 3-3 HOMO of DTCPB, DTCPBO, DTCTB and DTCTBO thin films measured by photoelectron spectrometer.
Table. 3-1 Basic characteristics of DTCPB, DTCPBO, DTCTB and DTCTBO in solution.
Dye λabs
(nm)
ε (M-1cm-1)
HOMO (eV)
LUMO (eV)
Eg (onset)
(eV)
Tg (T)
Td (T)
DTCPB 491 18186 -5.26 -3.22 2.04 - 287
DTCTB 563 23155 -5.16 -3.30 1.86 120 292
DTCPBO 518 23444 -5.30 -3.38 1.92 145 287
DTCTBO 583 33135 -5.24 -3.41 1.83 118 276
Table. 3-2 Basic characteristics of DTCPB, DTCPBO, DTCTB and DTCTBO
31
for thin film.
Dye λabs
(nm)
HOMO (eV)
LUMO (eV)
DTCPB 511 -5.51 -3.08
DTCTB 583 -5.40 -3.23
DTCPBO 537 -5.60 -3.27
DTCTBO 600 -5.41 -3.29
3.3 OSC optimization of four electron donor materials with single
cyano substituent molecules
In this section, we illustrate the optimization procedures of OSCs by using these four electron donor materials with C60 and C70 electron acceptors. We optimized DTCTB first, followed by DTCPB, DTCPBO, and finally DTCTBO in sequence. In our previous research, we found that the optimized OSC structure consisted of an active layer and an electron transport layer (planar-mixed heterojunction structure, PMHJ)85. Besides, donor buffer layer between anode and active layer can effectively prevent exciton quenching and increase JSC and PCE in OSCs. Hence, we started our device architecture from PMHJ. However, interestingly, in OSCs based on these four electron donor materials, device performances were even better when using simple bulk-heterojunction (BHJ) structure. Besides, insertion of donor buffer layer showed worse efficiency in these OSCs. Hence, the device structure was very simple with two variables, mixing ratio and active layer thicknesses.
In our devices, we used MoOx and bathocuproine (BCP) as the hole extraction layer and exciton blocking layer, respectively. The workfunctions of electrodes and energy levels of materials were shown in Fig. 3-4.