國立臺灣大學管理學院企業管理碩士專班
碩士論文
Global MBA
College of Management National Taiwan University
Master Thesis
應用層級分析法評估自中國轉移消費型電子製造業供應鏈
Evaluation of shifting China’s supply chain in the consumer electronics manufacturing industry by the analytical hierarchy process
陳仕穎
Shih-Ying Chen
指導教授:孔令傑 博士
Advisor: Ling-Chieh Kung, Ph.D.
中華民國 109 年 6 月
June, 2020
Acknowledgements
I would like to express my gratitude to Prof. Ling-Chieh Kung for the invaluable guidance to all his teachings and continual supports throughout the whole study. Prof. Kung is not only knowledgeable in the fields to advise valuable comments but also patient to provide practical direction when confronting obstacles throughout the research. I am very fortunate to have him as my thesis advisor.
In addition, I also sincerely acknowledge the support provided by my colleagues and friends, they generously shared insights of the supply chain changes and helped answer the two to three times in-depth surveys. Last but not least, I would like to express my appreciation to my family for the support they have provided my along the way. This study would not have been completed successfully without their support.
Abstract
Facing the US-China trade war starting from 2018 and a recent pandemic in early 2020, lots of discussions within the consumer electronics manufacturing industry have been brought out on whether the supply chain should be moved out of China. To address such a shifting supply chain decision, the author, who is currently a supply chain specialist in a world leading consumer electronic company, builds a hierarchical model for listing and ranking key attributes for firms to evaluate. The analytical hierarchy process (AHP) framework is adopted to decompose key factors, extract associated attributes to prioritize the multiple criteria, and structure a hierarchical model to evaluate the process. In the final evaluation stage, we reach the conclusion that China remains the best alternative when considering shifting supply chain.
Keywords: shifting supply chain, analytical hierarchy process, consumer electronics manufacturing.
Table of Contents
Abstract ... i
Table of Contents ... iii
List of Tables ... v
List of Figures ... vi
Chapter 1 Introduction ... 1
1.1 Background and motivation... 1
1.2 Research objective ... 4
1.3 Summary of major findings ... 5
Chapter 2 Literature Review ... 6
2.1 Shifting supply chain ... 6
2.2 Analytical hierarchy process ... 7
Chapter 3 Research Methodology ... 10
3.1 Research method... 10
3.2 Decomposition ... 12
3.3 Comparative judgement ... 15
3.4 Final evaluation ... 16
Chapter 4 Analysis and Results ... 17
4.1 Synthesis of priorities ... 17
4.1.1 Overall summary ... 17
4.1.2 Synthesis of priorities (by work experience) ... 22
4.1.3 Synthesis of priorities (by work location) ... 24
4.2 Synthesis of alternatives ... 27
Chapter 5 Conclusion and Future Works ... 30
5.1 Conclusion ... 30
5.2 Future works ... 32
Bibliography ... 33
Appendix... 36
Appendix A: Pilot Questionnaire ... 36
Appendix B: AHP Questionnaire ... 39
Appendix C: Alternatives Questionnaire ... 50
List of Tables
Table 3.1: Definition of the attributes ... 13
Table 3.2: The fundamental scale of absolute numbers (modified from Satty, 1986) ... 15
Table 4.1: Demographics of the respondents ... 18
Table 4.2: The pairwise comparison result of the first-level attributes ... 18
Table 4.3: The pairwise comparison results of “Government regulations” ... 19
Table 4.4: The pairwise comparison results of “Society” ... 19
Table 4.5: The pairwise comparison results of “Industry” ... 20
Table 4.6: The pairwise comparison results of “Political stability” ... 20
Table 4.7: The pairwise comparison results of “Nature” ... 20
Table 4.8: Synthesis of the pairwise comparison results (composite) ... 21
Table 4.9: Synthesis of pairwise comparison within ten years’ work experience ... 22
Table 4.10: Synthesis of pairwise comparison with more than ten years’ work experience ... 23
Table 4.11: Synthesis of pairwise comparison for those who work in Taiwan ... 24
Table 4.12: Synthesis of pairwise comparison for those who work in China ... 25
Table 4.13: The pairwise comparison results of alternative ... 28
Table 4.14: Synthesis of alternatives ... 29
List of Figures
Figure 1.1: China Average Annual Wage in Manufacturing (Trading Economics, 2020a)
... 2
Figure 1.2: China year-to-year GDP growth rate (Trading Economics, 2020b) ... 3
Figure 3.1: Steps of analysis hierarchy process (modified from Lai et al., 1999) ... 11
Figure 3.2: Shifting supply chain model ... 13
Figure 4.1: Shifting supply chain model with alternatives ... 27
Chapter 1 Introduction
1.1 Background and motivation
Over the last two decades, China is viewed as a dominant supply chain player that manufactures the majority of components and assembles from raw materials to final products. According to the office of the United States Trade Representative, total trade between the US and China grew from $5 billion in 1980 to $660 billion in 2018. China is currently the largest goods trading partner and the third-largest export market with United States. Among all the trading goods in China, the category of high-tech products are accounted for 44% of total exports in 2018 from the source of World Integrated Trade Solution. The reasons why China is being a such leader include the comprehensive integrated supply chain cluster from upstream to downstream, plenty of labor resource and well-established logistics environment over the past two to three decades. These have founded China as a crucial supply chain position and impact to all worldwide business.
However, China has gradually limited the manufacturing supply chain growth by its inflexible government regulation, the continuous rising labor wage, and strict environmental regulations. For example, according to National Bureau of Statisics of
China (2019), the average annual wage in manufacturing per Chinese workers has increased 155% to 78,147 yuan (US $ 11,004) in 2019 from 30,700 yuan (US$ 4,323) in 2010 (cf. Figure 1.1). In the meantime, as the Chinese government announced the industrial strategy by moving upward in the global value chain from the traditional original equipment manufacturer/original design manufacturer (OEM/ODM) models to the high-end technology by focusing on research and development (R&D), many foreign companies find China is no longer the cheapest or most cost-effective place to manufacture.
Figure 1.1: China Average Annual Wage in Manufacturing (Trading Economics, 2020a)
In addition, facing the US-China trade war from 2018, companies are forced to consider moving the supply chain out of China more seriously. The trade war had cost the extremely high taxes burden to most of the China-imported products. Governments around the world are now increasingly scrutinizing the import of Chinese-origin components and putting more limitations on firms who rely heavily on the China supply chain. These actions have increased the production cost and impacted the profitability directly. It is thus unsurprising that Apple CEO Tim Cooks, as a well-known example, said that “It’s clear that the economy began to slow there in the second half and I believe
the trade tensions between the United States and China put additional pressure on their economy” (Wang, 2019).
The coronavirus outbreak in 2020 has also severely impacted the manufacturing industry in China. Reported impacts include the shortage of parts from low-tier suppliers, labors who have been restricted to commute out of the shutdown infected regions, and the slow recovery of transportation network capacity due to road closures. All these negative impacts made China’s economic year-to-year GDP growth rate shrinks into negative 6.8% for first time in decades. (cf. Figure 1.2). “The GDP contraction in January- March will translate into permanent income losses, reflected in bankruptcies across small companies and job losses” said Yue Su at the Economist Intelligence Unit (BBC, 2020).
The virus has put many businesses on notice that they need to diversify their supply chain.
Figure 1.2: China year-to-year GDP growth rate (Trading Economics, 2020b)
In summary, it is now undoubted that all companies need to consider whether to move their manufacturing supply chains out of China.1 We therefore devote this study to this topic. To the best of our knowledge, this study, which is completed right after the US-China trade war and coronavirus outbreak, is the most up-to-date research addressing this critical issue.
1.2 Research objective
The issues mentioned above have brought out many discussions among the industry on whether the supply chain should move out of China, which is denoted as shifting supply chain in this study. To determine whether to shift supply chain, many key factors should
be considered. However, there is a lack of evaluation model for listing and ranking key factors. It is thus valuable to develop a systematic way for a foreign brand to evaluate whether to shift supply chain.
In this study, we apply the analytical hierarchy process (AHP) framework, which has been recognized as a powerful decision support tool to choose among multiple alternatives in a multi-criterion environment (Satty, 1980). We use AHP to decompose the key factors, extract the associated attributes to prioritize the multiple criteria, and structure an organizing model to evaluate the process when considering the shifting supply chain out of China. It is well-known that the construction of AHP model requires domain knowledge and experience from both the researcher and survey respondents.
1 There is one additional factor that may affect especially foreign companies operating in China: The Chinese rival rising with the domestic brands. For example, in the consumer electronic industry, Chinese brands like Huawei, Xiaomi, VIVO, and Oppo, shrink the market for foreign brands. As the manufacturing business becomes brutally competitive, it is natural for foreign companies to start considering whether China should still be their main manufacturing base.
Since the author is currently a supply chain specialist working in a world-leading company in the consumer electronic industry, the dimensions, attributes, and the hierarchical structure can be appropriately constructed with domain knowledge. In order to prioritize the factors with composite weights, we collect opinions from domain experts from Apple, Dell, and Hewlett-Packard.
1.3 Summary of major findings
The major contributions of this study can be summarized as follows. First, we structure the hierarchy of attributes by conducting seven in-depth interviews with industry experts and managers. Second, we survey twenty domain experts to conduct the pairwise comparison to obtain the composite weights. This allows any decision makers in a related industry to use our established model to evaluate her or his shifting supply chain decision.
In the final evaluation stage, we conduct another survey and present our proposed alternatives to three decision makers. We would like to evaluate whether China remains the best place or other alternatives like Taiwan and Vietnam now becomes the better options for operating the supply chain. Our result shows that, at least for now from the viewpoint of the interviewed experts, China is still the most promising place for a foreign company to operate a consumer electronic manufacturing supply chain.
Chapter 2
Literature Review
2.1 Shifting supply chain
Supply chain is the sequence of processes involved in a system of organizations, people, activities, information, and resources to create a product or service from suppliers and deliver to customers. Lehmann (2012) summarizes the shifts beginning with the industrial revolution in Britain, after which the center of global production and trade shifted to Western Europe (especially Germany), then to the U.S., and two decades after World War II to Japan, Asia's Four Tigers (especially South Korea and Taiwan), and then to China.
This observation suggests that shifting supply chain is always considered at any time.
While China has become the world's largest global supply chain leader during the past two to three decades, the US-China trade war in 2008 was severely impacted in some key industries, supply chains are faced to consider moving manufacturing from higher cost to lower cost countries since the companies may foresee more cost-benefit of manufacturing outside of the existing production sites, so-called as shifting supply chain.
Cyrill (2019) mentions the benefits of shifting manufacturing out of China or diversifying production channels may be greater in the longer term given China’s steadily rising labor costs, mounting compliances, social insurance commitments, stringent environmental checks, and other pressures. For example, cable and connector maker Luxshare is setting
up in Vietnam and exploring facilities in India. Wistron, the Taiwanese original design manufacturer, has been calculating the costs of a shift out of China as it factors the US tariff threat to its business. Foxconn, the biggest manufacturer of Apple, announced that it had laid off 50,000 seasonal workers in China since October 2009 due to slowing iPhone sales and is seriously exploring the possibility of manufacturing smartphones to the US and Mexico.
2.2 Analytical hierarchy process
The analytical hierarchy process (AHP) was introduced by Saaty (1986) as a tool to determine the priority of multiple attributes, decomposition quantifiable, and intangible criteria, and evaluate through the pairwise comparison to scale down the selection process.
The applications of AHP ranges from organization planning, performance management to environmental and supplier selection which has been widely used in decision-making aspects.
Saaty (1982) demonstrates a decision-making process for leaders with applying the analytical hierarchy process among 12 pairwise comparison matrices including flexibility, opportunity, security, reputation, salary et cetera. He also constructs a step flow followed in the analytic network decision process to determine the best steps of action in such decision-making process.
Schniederjans and Wilson (1991) present an improved Information System (IS) project selection methodology that combines the analytic hierarchy process (AHP) with a goal programming (GP) model framework. The AHP is first used to prioritize the set of IS projects under consideration on the basis of the pertinent criteria of the organization.
Lai, Trueblood and Wong (1999) discuss how AHP can be applied to the selection of multimedia authoring systems (MAS) in a group decision environment. Six experienced software engineers participated in the study. The results indicate that AHP offers chances for every participant to fully understand, discuss, and objectively evaluate all MAS products before identifying and selecting the most efficient MAS.
Wei, C. C., Chien C.F., & Wang, M.J. (2005) propose a framework to conduct an Enterprise Resource Planning (ERP) system selection based on AHP approach. The framework can systematically construct the objectives of ERP selection to support the business goals and strategies of an enterprise, identify the appropriate attributes, and set up a consistent evaluation standard for facilitating a group decision process.
Chen (2015) evaluates the process of supplier selection in notebook electronic components with a fuzzy AHP method. Based on supplier selection literature, the study analyzes the evaluation dimensions and criteria, invites domain experts and professors to fill in assessment table used the fuzzy Delphi method (FDM) to filter. It then uses the fuzzy analytic hierarchy process (FAHP) to construct the selection model of notebook electronic component supplier. The results show that when managers select suppliers, product quality factor is the most important dimension, and next are cost/production control, innovation, development capabilities and vendor management.
Chen (2019) uses AHP framework to build a performance evaluation process in a memory testing manufacturing industry. It applies an objective hierarchy structure to create the performance indices. Following the AHP to design the investigation and obtain the responses from manufacturing indirect labors to get the weighting between indices.
Furthermore, it uses an empirical case from the memory testing house to verify the validity.
Following the above successful applications of AHP, in this study we also aim to adopt AHP to assess our research objective, shifting supply chain.
Chapter 3
Research Methodology
3.1 Research method
In this study, in order to make a decision in an organized way and to generate priorities, we use the analytical framework of analytical hierarchical process (AHP) to decompose the tangible and intangible key factors and extract the associated attributes to evaluate the multi-criteria of shifting China’s supply chain.
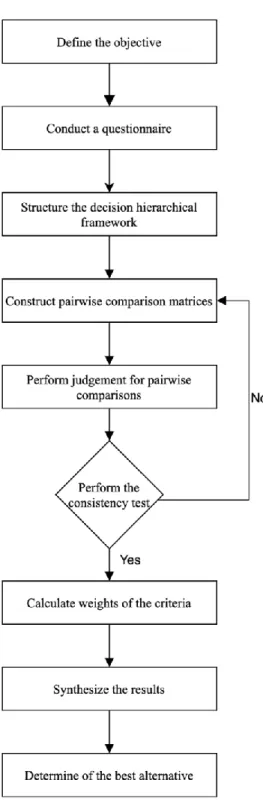
Satty (1986) constructs the AHP model which involves three stages of problem solving: decomposition, comparative judgments, and synthesis of priorities. First, the decomposition principle calls for the construction of a hierarchical network to represent a decision problem, with the top representing overall objectives and the lower levels representing criteria and alternatives.
Next, with the comparative judgments, users are required to set up a comparison matrix at each hierarchy by comparing pairs of criteria. A scale of values ranging from 1 (equal importance) to 9 (extreme importance) are used for expressing user preference.
Last, synthesis of priorities is conducted to calculate a composite weight for each alternative based on preferences derived from the comparison matrix. Once completed
these three stages, it would allow decision makers to obtain a relative standing, on a ratio scale, of the alternatives to be evaluated. The process is illustrated in Figure 3.1.
Figure 3.1: Steps of analysis hierarchy process (modified from Lai et al., 1999)
3.2 Decomposition
In order to structure the critical attributes that involves the shifting supply chain analysis, we conduct seven in-depth interviews with experience consumer electronic manufacturing industry experts and managers in April 2020.
Among the seven industry experts and managers, six have more than ten years work experience in the consumer and business electronic manufacturing industry. All of them have worked on the management of the supply chain in China, as well as managed Taiwan, Vietnam, Thailand, Philippines, South Korea, Japan, US and, Mexico factories in certain timeframe.
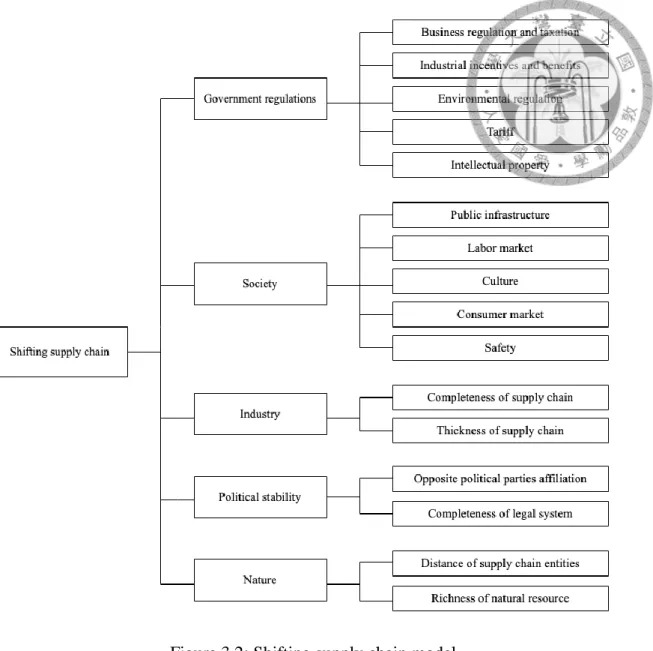
Before the official interview, we conduct a pilot survey to test the correctness of the instructions to be measured by whether all the respondents in the pilot sample are able to follow the directions as indicated. From the interviews, we extract each expert’s first- hand knowledge and gather detailed industry knowledge on the determinants of sixteen key attributes. Next, the research team categorize the sixteen attributes into five dimensions including government regulations, society, industry, political stability, nature and present the hierarchy in Figure 3.2. Detailed definitions of all attributes are provided in Table 3.1.
Figure 3.2: Shifting supply chain model Table 3.1: Definition of the attributes Dimensions Attributes Definition
Government Regulations
Business regulation and taxation
The imposition of compulsory levies to the business entities by governments
Industrial incentives and benefits
To what degree does the government provide qualified businesses different kinds of access to some of the available industrial incentive programs
Environmental regulation
To what degree does the government impose environmental regulation that attempts to protect public health and the environment from pollution by industry and development
Tariff The amount of tax or duty to be paid on a
particular class of imports or exports Intellectual
property
To what degree does the government protect intellectual property, which is a category of property that includes intangible creations of the human intellect including copyrights, patents, trademarks, and trade secrets
Society Public
infrastructure
The completeness of infrastructure owned or available for use by the public, including aviation, rail and road transport, energy, water, and telecommunication infrastructure
Labor market The size of labor market, level of average wage, education level, relative industrial skills, and language proficiency
Culture To what degree does the culture (including lifestyle, religion, etc.) impacts employees’ work diligence
Consumer market The maturity of a consumer electronics market Safety How safe it is to run a factory in the given area,
evaluated by the crime rate, absence of violence and terrorism, numbers of refugees, and heavy weapons accessness
Industry Completeness of supply chain
Geographic concentration of a complete supply chain facilitating upstream and downstream flows of products, services, finances and/or information from a source to a customer Thickness of
supply chain
Easiness to find second/third sources in the same tier (measured by the number of suppliers in that tier), providing manufacturers more benefits regarding cost reduction, quality comparison, and risk reduction
Political Stability
Opposite political parties affiliation
The frequency of opposite political decisions made within a country that might result in an unanticipated loss to investors and foreign business
Completeness of legal system
The condition of having all the necessary and appropriate legal system structure (including civil law, common law, and religious law) within a country
Nature Distance of supply chain entities
The overall distance caused by the geographic locations of the entities in the supply chain,
which impacts the material and product delivery logistics lead time
Richness of natural resource
The richness of rare resources like metals, minerals, or others that can be acquired from the ground for electronic components manufacturing
3.3 Comparative judgement
In the following stage, we construct a set of pairwise comparison matrices and conduct twenty surveys from the domain experts to get the result of weighing the priorities within the attributes in each level in May 2020.
To make comparisons, we need a scale of numbers that indicates how many times more important or dominant one element is over another element with respect to the criterion or property for which they are compared. Table 3.2 exhibits the scale.
Table 3.2: The fundamental scale of absolute numbers (modified from Satty, 1986) Intensity of
Importance Definition Explanation
1 Equal Importance Two activities contribute equally to the objective
3 Moderate importance of one over another
Experience and judgement slightly favor one activity over another 5 Essential or strong importance Experience and judgement strongly
favor one activity over another 7 Demonstrated importance An activity is favored very strongly
over another; its dominance demonstrated in practice
9 Extreme importance The evidence favoring one activity over another is of the highest possible order of affirmation
2, 4, 6, 8 Intermediate values between the two adjacent judgements
When compromise is needed
After we get the reported relative importance of each pairwise attributes, we calculate the relative weights by using the eigenvalue method and obtain the consistency index (CI) and consistency ratio (CR) for each paired comparison matrix. The consistency ratio should be less than the threshold value 0.1 to ensure that the decision maker is consistent in assigning paired comparisons. For those CR which are out of the baseline, we follow Satty (1990) to attempt to fix the matrix and recalculate CI and CR. For those CR that still cannot be fixed, we remove those records and use the average of the remaining to generate the relative weights of each attribute.
To obtain the relative weights and overall ranking among all second-level attributes, we multiply the second-level relative weights with its parent first-level weight according to the hierarchy to obtain the composite weights. These composite weights represent the decision makers’ opinion of the relative importance of each decision alternative. The overall ranking may then be derived by comparing the composite weights, where an attribute with a larger composite weight is ranked higher.
3.4 Final evaluation
In the final evaluation stage, we do another survey and present our proposed alternatives to another group of decision makers in June 2020. For each attribute, we ask them to provide their relative weights for each alternative. For each decision maker, we then conduct the same method of the consistency check, remove those whose CR are higher than the threshold value 0.1, and calculate her/his score for each alternative through weighted average. These scores are then averaged among all decision makers to result in the final scores for each alternative.
Chapter 4
Analysis and Results
4.1 Synthesis of priorities
In this chapter, we follow the research method of analytical hierarchy process (AHP) to construct a set of pairwise comparison matrices and conduct twenty surveys from the dominant experts to get the result of weighing the priorities within the attributes in each level. The survey is divided into three parts: basic information, first level of attributes, and second level of attributes.
4.1.1 Overall summary
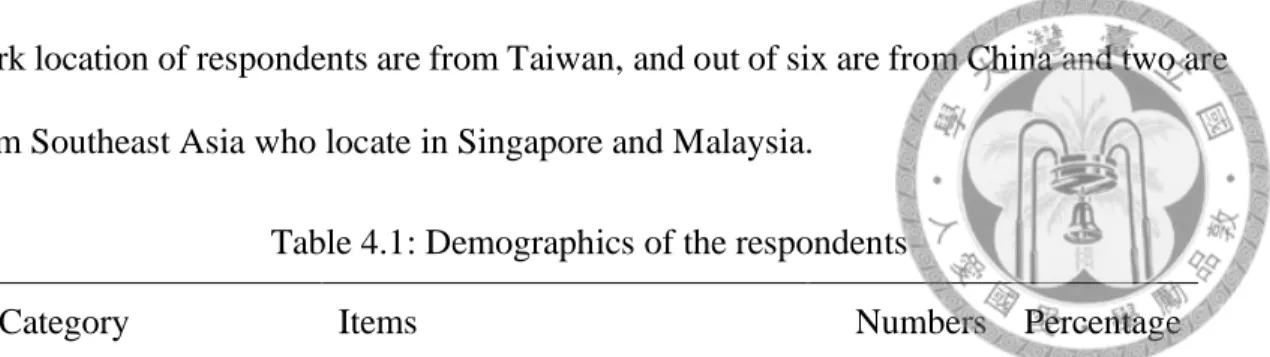
presents on the demographics of the respondents. We conduct the survey to the industrial experts who have work experience in China and cross-countries management with at least three-year work experience. Among the total twenty responses, out of nineteen are from the consumer electronics manufacturing industry, and one is from the government department in Taiwan. Out of nine respondents have less than ten years work experience and up to eleven have more than ten years work experience. In addition, majority of the
work location of respondents are from Taiwan, and out of six are from China and two are from Southeast Asia who locate in Singapore and Malaysia.
Table 4.1: Demographics of the respondents
Category Items Numbers Percentage
Gender Male 11 55%
Female 9 45%
Age 25-29 6 30%
30-39 8 40%
40-49 6 30%
Education Undergraduate 8 40%
Postgraduate 12 60%
Work experience (years)
3-5 5 25%
6-10 4 20%
11-20 10 50%
>20 1 5%
Position Program management 15 75%
Supply chain management 3 15%
Others 2 10%
Work Location Taiwan 12 60%
China 6 30%
Southeast Asia 2 10%
In the second stage, we analyze the pairwise priority comparison of the first-level attributes which include the “Government regulations”, “Society”, “Industry”, “Political stability”, and “Nature”. By calculating the normalized eigenvector and conducting the consistency check, the summary of relative weights for each attribute is shown in Table 4.2. The majority of the respondents consider “Government regulations” (37.6%) is the most important dimension for foreign company to evaluate whether a given area is suitable to run the supply chain or not.
Table 4.2: The pairwise comparison result of the first-level attributes
Attributes Weights Ranking
Government 0.376 1
Industry 0.221 2
Political Stability 0.199 3
Society 0.127 4
Nature 0.076 5
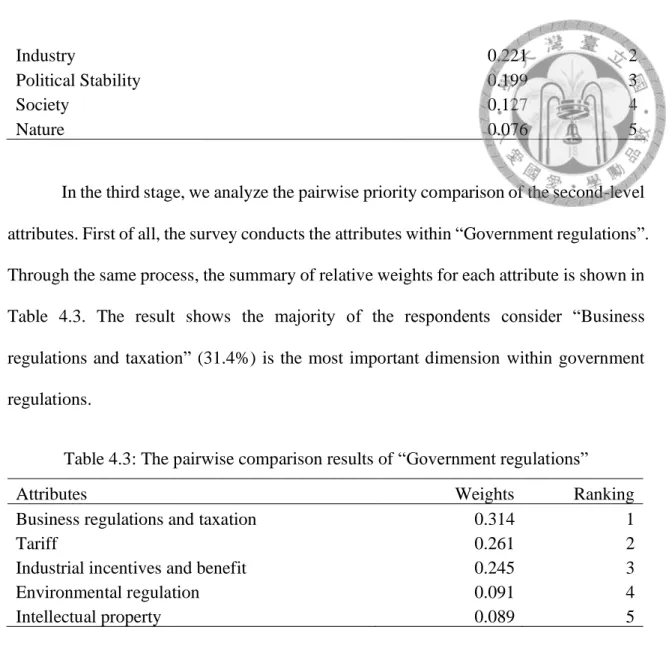
In the third stage, we analyze the pairwise priority comparison of the second-level attributes. First of all, the survey conducts the attributes within “Government regulations”.
Through the same process, the summary of relative weights for each attribute is shown in Table 4.3. The result shows the majority of the respondents consider “Business regulations and taxation” (31.4%) is the most important dimension within government regulations.
Table 4.3: The pairwise comparison results of “Government regulations”
Attributes Weights Ranking
Business regulations and taxation 0.314 1
Tariff 0.261 2
Industrial incentives and benefit 0.245 3
Environmental regulation 0.091 4
Intellectual property 0.089 5
Secondly, the survey conducts the attributes within “Society”. The summary of relative weights for each attribute is shown in Table 4.4. Among all the factors, the majority of the respondents consider “Labor market” (33.8%) is the most important dimension within society. Labor market not only refers to the size of labor market, but also contains the level of average wage, education, relative industrial skills, and language proficiency.
Table 4.4: The pairwise comparison results of “Society”
Attributes Weights Ranking
Labor market 0.338 1
Public infrastructure 0.203 2
Safety 0.201 3
Consumer market 0.168 4
Culture 0.090 5
Thirdly, the survey conducts the attributes within “Industry”. The summary of relative weights for each attribute is shown in Table 4.5. Between the two factors of completeness and thickness of supply chain, the large portions of the respondents consider
“Completeness of supply chain” (72.1%) is a strongly important dimension within industry from the integration of upstream and downstream.
Table 4.5: The pairwise comparison results of “Industry”
Attributes Weights Ranking
Completeness of supply chain 0.721 1
Thickness of supply chain 0.279 2
Next, the survey conducts the attributes within “Political stability”. The summary of relative weights for each attribute is shown in Table 4.6. Between the two factors, the large portions of the respondents consider “Completeness of legal system” (60.3%) is strongly important than the opposite political parties affiliation.
Table 4.6: The pairwise comparison results of “Political stability”
Attributes Weights Ranking
Completeness of legal system 0.603 1
Opposite political parties affiliation 0.397 2
Lastly, the survey conducts the attributes within “Nature”. The summary of relative weights for each attribute is shown in Table 4.7. Between the two factors, the large portions of the respondents consider “Distance of supply chain entities” (71.3%) is strongly important than the richness of natural resource.
Table 4.7: The pairwise comparison results of “Nature”
Attributes Weights Ranking
Distance of supply chain entities 0.713 1
Richness of natural resource 0.287 2
The overall priorities of the first level and second level attributes are shown in Table 4.8. “Completeness of supply chain” (16%) which hits the largest portion of total priority, is considered as the most important dimension among the sixteen factors, following by the “completeness of legal system” (12%) and “Business regulations and taxation” (11.8%).
Table 4.8: Synthesis of the pairwise comparison results (composite) Dimensions Weights
(Rank) Attributes Weights
(Rank)
Composite weights 2
(Rank)
Government 0.376 (1)
Business regulations and
taxation 0.314 (1) 0.118 (3)
Tariff 0.261 (2) 0.098 (4)
Industrial incentives and benefit 0.245 (3) 0.092 (5) Environmental regulation 0.091 (4) 0.034 (10) Intellectual property 0.089 (5) 0.033 (11)
Society 0.127 (4)
Labor market 0.338 (1) 0.043 (9)
Public infrastructure 0.203 (2) 0.026 (12)
Safety 0.201 (3) 0.025 (13)
Consumer market 0.168 (4) 0.021 (15)
Culture 0.09 (5) 0.011 (16)
Industry 0.221 (2)
Completeness of supply chain 0.721 (1) 0.16 (1) Thickness of supply chain 0.279 (2) 0.062 (7) Political
Stability 0.200 (3)
Completeness of legal system 0.603 (1) 0.12 (2) Opposite political parties
affiliation 0.397 (2) 0.079 (6)
Nature 0.076 (5)
Distance of supply chain entities 0.713 (1) 0.054 (8) Richness of natural resource 0.287 (2) 0.022 (14)
Composite weights: Results of multiplying each priority of its attributes and sub-attributes.
4.1.2 Synthesis of priorities (by work experience)
In this study, in order to analyze the difference results among various work experience, we divide the feedback into two major groups. Out of the twenty respondents, the nine having less than ten years of work experience are gathered into the junior group. On the contrary, the other eleven ones are put into the senior group. ranked as the second in the junior and senior groups, respectively.
Table 4.9 and Table 4.10 list the syntheses for these two groups. From these two tables, we may observe that “Completeness of supply chain” hits the largest portion of total priority in both two groups, followed by “Business regulations and taxation” and
“Completeness of legal system” ranked as the second in the junior and senior groups, respectively.
Table 4.9: Synthesis of pairwise comparison within ten years’ work experience
Dimensions Weights
(Rank) Attributes Weights
(Rank)
Composite weights (Rank)
Government 0.426 (1)
Business regulations and taxation 0.33 (6) 0.14 (2)
Tariff 0.253 (8) 0.108 (4)
Industrial incentives and benefit 0.231 (10) 0.098 (5) Environmental regulation 0.105 (14) 0.045 (9) Intellectual property 0.081 (16) 0.034 (10)
Society 0.097 (4)
Labor market 0.342 (5) 0.033 (11)
Public infrastructure 0.235 (9) 0.023 (12)
Consumer market 0.213 (11) 0.021 (13)
Culture 0.107 (13) 0.01 (15)
Safety 0.103 (15) 0.01 (15)
Industry 0.231 (2) Completeness of supply chain 0.716 (2) 0.165 (1) Thickness of supply chain 0.284 (7) 0.066 (7)
Political
Stability 0.188 (3)
Completeness of legal system 0.58 (3) 0.109 (3) Opposite political parties
affiliation 0.42 (4) 0.079 (6)
Nature 0.059 (5) Distance of supply chain entities 0.792 (1) 0.047 (8) Richness of natural resource 0.208 (12) 0.012 (14) Table 4.10: Synthesis of pairwise comparison with more than ten years’ work
experience
Dimensions Weights
(Rank) Attributes Weights
(Rank)
Composite weights (Rank)
Government 0.341 (1)
Business regulations and taxation 0.304 (7) 0.104 (3)
Tariff 0.267 (9) 0.091 (4)
Industrial incentives and benefit 0.254 (11) 0.086 (5) Intellectual property 0.094 (14) 0.032 (11) Environmental regulation 0.082 (15) 0.028 (13)
Society 0.148 (4)
Labor market 0.336 (6) 0.05 (9)
Safety 0.266 (10) 0.039 (10)
Public infrastructure 0.181 (12) 0.027 (14)
Consumer market 0.139 (13) 0.021 (15)
Culture 0.078 (16) 0.012 (16)
Industry 0.215 (2) Completeness of supply chain 0.726 (1) 0.156 (1) Thickness of supply chain 0.274 (8) 0.059 (7) Political
Stability 0.208 (3)
Completeness of legal system 0.623 (3) 0.129 (2) Opposite political parties
affiliation 0.377 (4) 0.078 (6)
Nature 0.089 (5) Distance of supply chain entities 0.648 (2) 0.057 (8) Richness of natural resource 0.352 (5) 0.031 (12) The group with more than ten years of work experience considers the completeness of legal system as more important than the business regulation. The reason behind this may be explained in the following way. A legal system is a very comprehensive process that involves various complicated stages which may be executed and enforced only in a very long period. For those respondents who are from the senior group, they may have chance to participate in the changes of a legal system that impacts
a supply chain while the junior group may not be able to engage. Conversely, the junior group may have more chance to get involved and experience the changes of business regulation and taxation in their existing career.
4.1.3 Synthesis of priorities (by work location)
This survey has been distributed to different domain experts in various work locations.
Twenty respondents are from Taiwan, six from China, and two from Southeast Asia. In order to analyze the different perspectives held by people from two opposite government systems, we separate the results of pairwise priority from Taiwan and China into two group and conduct a comparison.
Table 4.11 demonstrates the ranking from the respondents who work in Taiwan. It indicates that “Completeness of supply chain” (18.8%) hits the largest portion of total priority, “Business regulations and taxation” (13.9%) ranks as the second, and “Tariff”
(8.8%) the third.ranked as the second in the junior and senior groups, respectively.
Table 4.9 Table 4.12 illustrates the ranking from those who work in China.
Interestingly, what these two groups of respondents consider as the most important are different. For those in China, “Completeness of legal system” (20.9%) is ranked as the first, which is different from the top for those in Taiwan. The attribute that is ranked as the first by the Taiwan group, “completeness of supply chain”, is ranked as the second by the China group (12.2%). The third highest in the China group is “Industrial incentives and benefit” (7.4%), which is only ranked as the fifth in the Taiwan group.
Table 4.11: Synthesis of pairwise comparison for those who work in Taiwan
Dimensions Weights
(Rank) Attributes Weights
(Rank)
Composite weights (Rank)
Government 0.368 (1)
Business regulations and taxation 0.378 (6) 0.139 (2)
Tariff 0.239 (9) 0.088 (3)
Industrial incentives and benefit 0.201 (11) 0.074 (5) Environmental regulation 0.091 (15) 0.033 (10) Intellectual property 0.091 (14) 0.033 (10)
Society 0.124 (4)
Labor market 0.406 (5) 0.05 (9)
Public infrastructure 0.224 (10) 0.028 (12)
Consumer market 0.16 (12) 0.02 (14)
Safety 0.127 (13) 0.016 (15)
Culture 0.083 (16) 0.01 (16)
Industry 0.272 (2) Completeness of supply chain 0.692 (2) 0.188 (1) Thickness of supply chain 0.308 (7) 0.084 (4) Political
Stability 0.145 (3)
Completeness of legal system 0.503 (3) 0.073 (6) Opposite political parties
affiliation 0.497 (4) 0.072 (7)
Nature 0.091 (5) Distance of supply chain entities 0.721 (1) 0.066 (8) Richness of natural resource 0.279 (8) 0.025 (13)
Table 4.12: Synthesis of pairwise comparison for those who work in China
Dimensions Weights
(Rank) Attributes Weights
(Rank)
Composite weights (Rank)
Government 0.363 (1)
Industrial incentives and benefit 0.304 (4) 0.111 (3)
Tariff 0.268 (8) 0.097 (4)
Business regulations and taxation 0.221 (10) 0.08 (5) Environmental regulation 0.11 (15) 0.04 (8) Intellectual property 0.096 (16) 0.035 (9)
Society 0.128 (4)
Labor market 0.27 (7) 0.035 (9)
Safety 0.253 (9) 0.032 (11)
Public infrastructure 0.186 (12) 0.024 (13)
Consumer market 0.181 (13) 0.023 (14)
Culture 0.11 (14) 0.014 (16)
Industry 0.154 (3) Completeness of supply chain 0.79 (1) 0.122 (2) Thickness of supply chain 0.21 (11) 0.032 (11)
Political
Stability 0.288 (2)
Completeness of legal system 0.725 (2) 0.209 (1) Opposite political parties
affiliation 0.275 (6) 0.079 (6)
Nature 0.067 (5) Distance of supply chain entities 0.708 (3) 0.047 (7) Richness of natural resource 0.292 (5) 0.02 (15)
The result of attribute ranking from China varies a lot compared to that from Taiwan. Owing to the strong legal system enforcement in China, most of the Chinese respondents consider it as one of the key factors which makes China a leading supply chain environment. Hence, they believe that the completeness of a legal system is much more important to the enterprises who need to consider moving supply chain into the area.
“Industrial incentives and benefits” is ranked as the third highest within the China group. To explain this, note that the China government has continuously outspread the industrial incentives by all kinds of public medias. The respondents who work in China therefore usually get the information directly and timely. For example, the China government regularly releases the investment incentives to labor-intensive enterprises or enterprises with extensive facilities for them to relocate their factories from coastal areas to the inland area. These incentives typically include taxes, lands, and funding. It has gradually increased the respondents’ awareness of the government industrial policy to the enterprises.
The third highest ranked attribute within the Taiwan group is “Tariff”. We can tell from the macroeconomy that Taiwan has a relatively stable economic growth and is a well-developed capitalist environment. Its legal structure and business incentives are pretty mature without frequent changes. As it is rare for the Taiwan government to offer huge industrial incentives, for enterprise focusing on cost reduction, tariff is one of the
most critical factors that affects the business finance. This explains why tariff is ranked high.
4.2 Synthesis of alternatives
From the previous in-depth interviews with experience consumer electronic manufacturing industry experts and managers, a few countries have been suggested to replace the supply chain in China. In order to evaluate whether any of these suggested alternatives is indeed better than China, which means shifting supply chain should be executed, we conduct a new survey. We ask three decision makers from Singapore, Taiwan and China (in which are abbreviated as DM1, DM2, and DM3, respectively) to provide their opinions for three alternatives, Taiwan, China, and Vietnam. These alternatives are shown in Figure 4.1. The scores from the three decision makers are listed is Table 4.13. The structural model we obtained in Table 4.8 and scores in Table 4.13 are then combined to finalize the alternative selection process. The final results are provided in Table 4.14.
Figure 4.1: Shifting supply chain model with alternatives
Table 4.13: The pairwise comparison results of alternative Attributes
Taiwan China Vietnam
DM1 DM2 DM3 DM1 DM2 DM3 DM1 DM2 DM3
Business regulation and taxation
0.620 0.639 0.286 0.224 0.274 0.143 0.156 0.087 0.571 Industrial
incentives and benefits
0.167 0.726 0.200 0.667 0.205 0.400 0.167 0.069 0.400 Environmental
regulation 0.333 0.767 0.194 0.333 0.175 0.700 0.333 0.058 0.107
Tariff 0.690 0.750 0.201 0.065 0.125 0.118 0.245 0.125 0.681
Intellectual
property 0.782 0.714 0.286 0.056 0.143 0.571 0.163 0.143 0.143
Public
infrastructure 0.252 0.221 0.124 0.704 0.712 0.800 0.044 0.068 0.075 Labor market 0.105 0.071 0.089 0.798 0.217 0.587 0.097 0.712 0.324
Culture 0.455 0.738 0.400 0.455 0.198 0.400 0.091 0.064 0.200
Consumer
market 0.200 0.266 0.286 0.745 0.632 0.571 0.055 0.102 0.143
Safety 0.556 0.701 0.194 0.354 0.213 0.700 0.090 0.085 0.107
Completeness
of supply chain 0.190 0.205 0.297 0.750 0.741 0.539 0.060 0.055 0.164 Thickness of
supply chain 0.190 0.254 0.194 0.750 0.662 0.700 0.060 0.084 0.107 Opposite
political parties affiliation
0.412 0.600 0.286 0.261 0.200 0.571 0.328 0.200 0.143 Completeness
of legal system 0.620 0.714 0.148 0.224 0.143 0.767 0.156 0.143 0.085 Distance of
supply chain entities
0.134 0.038 0.194 0.746 0.619 0.700 0.120 0.343 0.107 Richness of
natural resource 0.111 0.080 0.118 0.778 0.265 0.613 0.111 0.656 0.269
From Table 4.13, we observe that China is ranked as the top alternative in five attributes, including “Public infrastructure”, “Consumer market”, “Completeness of supply chain”, “Thickness of supply chain”, and “Distance of supply chain entities”, by all three decision makers. On the contrary, Vietnam is consistently listed as the last alternative in eight attributes, including “Environmental regulations”, “Public infrastructure”, “Culture”, “Consumer market”, “Safety”, “Completeness of supply chain”, “Thickness of supply chain”, and “Completeness of legal system” by all three decision makers. For Taiwan, there is no attribute for which the three decision makers all rank it as the top or last alternative.
Table 4.14: Synthesis of alternatives
Alternatives DM1 DM2 DM3 Geometric mean
Taiwan 0.387 0.493 0.224 0.349
China 0.461 0.355 0.507 0.436
Vietnam 0.151 0.153 0.269 0.184
As shown in Table 4.14, decision makers 1 and 3 prefer the supply chain to remain in China while decision maker 2 prefers the supply chain to be shifted to Taiwan.
However, decision maker 2’s preference difference between Taiwan and China is not significant enough to outweigh the other two decision makers’ preference over China. By calculating the geometric mean, we achieve a sufficient agreement that China remains the best alternative, at least for this moment, for a foreign company to operate a consumer electronic manufacturing supply chain. China, with the existing advantages of integrating supply chain clusters and well-established public infrastructure, remains the best alternative when considering shifting supply chain.
Chapter 5
Conclusion and Future Works
5.1 Conclusion
Facing the US-China trade war starting from 2018 and a recent pandemic in early 2020, lots of discussions within the consumer electronics manufacturing industry have been brought out on whether the supply chain should be moved out of China. To address such a shifting supply chain decision, in this study we build a hierarchical model for listing and ranking key attributes for firms to evaluate.
We apply the analytical hierarchy process (AHP) framework to decompose key factors, extract associated attributes to prioritize the multiple criteria, and structure a hierarchical model to evaluate the process. In order to structure the critical hierarchy of attributes, we conduct seven in-depth interviews with industry experts and managers. We then invite twenty domain experts to conduct the pairwise comparison among attributes.
Their ratings allow us to calculate the relative weights with the use of the eigenvalue method to do the consistency check of each paired comparison matrix. In the final
evaluation stage, we conduct another survey and present our proposed alternatives to three decision makers. By following the same analysis process, we reach the conclusion that China remains the best alternative, at least for this moment, for a foreign company to operate a consumer electronic manufacturing supply chain. Among all attributes, China is consistently considered as the top alternative in “Public infrastructure”, “Consumer market”, “Completeness of supply chain”, “Thickness of supply chain”, and “Distance of supply chain entities”. In short, China has the existing advantages of integrating supply chain clusters and thus remains the best alternatives when considering shifting supply chain.
It is worthwhile to mention that the current winning position held by China may still be changed in the future. For those foreign firms who rely heavily on China, they should pay more attention to the increasing downsides, such as the continuously rising labor wage, non-flexible government regulations, increasing requirement environmental protection, etc. The intense relationship between the US and China is also putting the supply chain in China in a vulnerable position. Firms are strongly suggested to restructure the distribution of supply chain to avoid the reliance on one country. Given that shifting supply chain requires long-term planning, it is essential for foreign firms to start the planning and take actions to diversify the supply chain to reduce the risk. This can begin with a move to widen the component sourcing or nearby geo-economy manufacturing assembly location options.
5.2 Future works
There are certainly limitations for this study. Firstly, we have a relatively small number of respondents because we set a strict criterion on interviewees in order to get in-depth feedback for analysis. To obtain a more solid research finding, we may look for more qualified respondents in the future.
In addition, in the final stage of the alternative selection, India is not listed as one of the alternatives. This is because most of the respondents we may reach do not have supply chain involvement in India. Given India is one of the widely discussed countries regarding shifting supply chain, future researchers are suggested to include India in their analysis by finding respondents with India experience.
Bibliography
BBC News (2020, April 17). China's virus-hit economy shrinks for first time in decades.
BBC News. Retrieved from https://www.bbc.com/news/ on June 22, 2020.
Chen, P.S. (2015). Using Fuzzy Analytic Hierarchy Process in Notebook Electronic Component Suppliers Evaluation (Unpublished master’s dissertation). National Taiwan Ocean University, Keelung, Taiwan.
Chen, S.C. (2019) An Empirical Study of Applying the UNISON Decision Analysis Framework and AHP to Construct the Performance Evaluation Indicators of Nurses
(Unpublished master’s dissertation). National Tsing Hua University, Hsinchu, Taiwan.
Cyrill M. (2019, January 24). Shifts in China’s Industrial Supply Chain and the US-China Trade War. China Briefing
Draper, P. (2012). The Shifting Geography of Global Value Chains: Implications for Developing Countries and Trade Policy. World Economic Forum.
Jiang X. & Green G. (2017) The Impact on Global Greenhouse Gas Emissions of Geographic Shifts in Global Supply Chains. Ecological Economics, 139, 102-114.
Lai, V.S., Trueblood R.P., & Wong B.K. (1999). Software selection: a case study of the application of the analytical hierarchical process to the selection of a multimedia authoring system. Information & Management, 36(4), 221–232.
Saaty T.L. (1980). The Analytic Hierarchy Process. New York: McGraw-Hill.
Saaty, T.L. (1982). Decision Making for Leaders: The Analytical Hierarchy Process for Decisions in a Complex World. Pennsylvania: RWS Publications.
Saaty, T.L. (1990). How to make a decision: the analytic hierarchy process. European Journal of Operational Research, 48(1), 9-26.
Schniederjans, M.J., & Wilson, R.L. (1991). Using the analytic hierarchy process and goal programming for information system project selection. Information &
Management, 20(5), 333–342.
Trading Economics (2020a). China Average Yearly Wages in Manufacturing. Trading Economics. Retrieved from hhttps://tradingeconomics.com/china/gdp-growth- annual on June 22, 2020.
Trading Economics (2020b). China GDP Annual Growth Rate. Trading Economics.
Retrieved from hhttps://tradingeconomics.com/china/gdp-growth-annual on June 22, 2020.
Wang, C. (2019, January 2). Tim Cook’s letter to Apple investors is corporate America’s latest warning about US-China trade war. CNBC. Retrieved from https://www.cnbc.com/ on June 22, 2020.
Wei, C. C., Chien C.F., & Wang, M.J. (2005). An AHP-based approach to ERP system selection. International Journal Production Economics, 96 (1), 47–62.
Appendix
Appendix A: Pilot Questionnaire
Shifting China’s supply chain in the manufacturing industry
Part 1 Basic Information Age
口 <25 口 25-30 口 31-39 口 40-49 口 50-59 口 >60 Education
口 High school 口 Undergraduate 口 Postgraduate Position
口 Program Management 口 Supply Chain Management 口 Engineer 口 Others Work experience (years)
口 Less than 1 口 1-2 口 3-5 口 5-10 口 >10 口 >20 Work location
口 Taiwan 口 China 口 Southeast Asia 口 South Asia 口 US 口 Others Managed factory locations
口 China 口 US 口 Japan 口 South Korea 口 India 口 Southeast Asia (Vietnam, Thiailand, Malaysia…)
Part 2 Key Attributes of shifting China’s supply chain
Supply chain activities involve the transformation of natural resources, raw materials, and components or semi-finished goods into a finished product that is delivered to the end customer.
China, the cost of manufacturing, labor, and production are rising steadily over the past decade. As China moves up the value chain, many industries find it may no longer be the cheapest or most cost-effective place to manufacture. The same product may now be produced at a lower cost in places like Vietnam and Indonesia. And Cambodia and Laos are on the horizon as alternative locations with even lower costs.
Considering the US-China trade war from 2018 and Wuhan coronavirus outbreak in 2020, companies are forcing to move supply chains out of China, which is also called the shifting supply chain.
In Jan 2019, Foxconn announced that it had laid off 50,000 seasonal workers in China since October due to slowing iPhone sales and is seriously exploring the possibility of manufacturing smartphones in Southeast Asia (Vietnam, Malay, Indonesia….)
According to the above statement:
口 Please list at most 5 reasons, as many as possible, to move the supply chain out of China
ex. Rising labor cost
口 Please list at most 5 reasons, as many as possible, NOT to move supply chain out of China
ex. Integrated supply chain cluster
口 Please list out 5 key factors of evaluating the shifting China’s supply chain ex.Country
regulations
口 Please rank the priority of the above 5 key factors
Rank 1 Rank 2 Rank 3 Rank 4 Rank 5
ex.Country regulation
口 Please breakdown detail into 3 attributes of the above 5 key factors ex. Country
regulation 1.Import and export tariff
2. Labor hours and salary 3. factory environment regulation
口 According to the above key factors, do you suggest any country to replace China’s supply chain? Why?
Country Reason
--End of the questionnaire, Thank you--
Appendix B: AHP Questionnaire
Evaluation of shifting China’s supply chain in the consumer electronics manufacturing industry by the analytical hierarchy process
Overview
In this study, in order to evaluate the priority of multi-criteria when considering shifting supply chain in the consumer electronics manufacturing industry, we apply the analytical hierarchy process (AHP) to generate priorities. The hierarchy below demonstrates the set of valuable inputs and their relationships from previous in-depth interviews.
The questionnaire is divided into three parts:
Part 1: Basic information
Part 2: The pairwise priority comparison of first-level attributes, including “Government regulations”, “Society”, “Industry”, “Political stability”, and “Nature”
Part 3: The pairwise comparison of detail evaluation items within each first-level attributes Part 3-1: The comparison within “Government regulations”
Part 3-2: The comparison within “Society”
Part 3-3: The comparison within “Industry”
Part 3-4: The comparison within “Political stability”
Part 3-5: The comparison within “Nature”
Example of pairwise priority comparison
1. In your opinion, for a foreign consumer electronics company (e.g., Foxconn, LG, etc.) to evaluate whether a given area is appropriate to run its manufacturing supply chain, if
“Government regulations” is extremely more important than “Society”, please check the box at 9:1
2. In your opinion, for the same objective, if “Industry” is moderately more important than
“Government regulations”, please check the box at 1:3
3. In your opinion, for the same objective, if “Government regulations” is equally important as “Political stability”, please check the box at 1:1
Factor A
Please check the relative importance of factor A (left column) to factor B (right column) by using the scale from 1 to 9 (9 = Extreme, 7 = Very strong, 5 = Strong, 3 = Moderate, and 1= Equal)
Factor B 9:
1 8:
1 7:
1 6:
1 5:
1 4:
1 3:
1 2:
1 1:
1 1:
2 1:
3 1:
4 1:
5 1:
6 1:
7 1:
8 1:
9
Government regulations
Society Industry Political stability
<Beginning of the questionnaire>
Part 1 Basic information
Age < 25 25-30 30-39 40-49 50-59 > 60
Education High
school Undergraduate Postgraduate
Position Program Management
Supply Chain Management
Engineer Others
Work experience (years)
< 3 3-5 5-10 11-20 > 20
Work location Taiwan China US Japan South
Korea
Southeast Asia & India
Part 2 First level of attributes
Evaluation items Definition Government
regulations
Government regulations are the rules that define the bounds of legal behavior, including business regulations and taxation, industrial incentives and benefits, environmental regulations, tariff, and intellectual property
Society A society is defined as a group of individuals involved in persistent social interaction or a large group sharing the same social territory. In this study, we list public infrastructure, labor market, culture,
consumer market, and safety as factors in this segment
Industry An industry is a sector that produces goods or services within an economy. In this study, we specifically refer to the consumer electronics manufacturing industry and would evaluate the completeness and thickness of supply chain
Political stability Political stability is defined as the measure regarding the government stability by the frequent opposite political parties affiliation and completeness of legal system
Nature For the sector Nature, factors include the richness of natural resource and geographic distance with respect to supply chain entities
For each pair of factors below, please rate the relative importance for a foreign consumer electronics company (e.g., Foxconn, LG, etc.) to evaluate whether a given area is appropriate to run its manufacturing supply chain.
Factor A
Please check the relative importance of factor A (left column) to factor B (right column) by using the scale from 1 to 9 (9 = Extreme, 7 = Very strong, 5 = Strong, 3 = Moderate, and 1= Equal)
Factor B 9:
1 8:
1 7:
1 6:
1 5:
1 4:
1 3:
1 2:
1 1:
1 1:
2 1:
3 1:
4 1:
5 1:
6 1:
7 1:
8 1:
9
Government regulations
Society
Industry
Political stability
Nature
Society Industry
Political stability
Nature
Industry
Political stability
Nature
Political
stability Nature
Part 3 Second level of attributes Part 3-1 Government regulations
Evaluation items Definition Business regulation and
taxation
The imposition of compulsory levies to the business entities by the government
Industrial incentives and benefits
To what degree does the government provide qualified businesses different kinds of access to some of the available industrial incentive programs
Environmental regulation To what degree does the government impose environmental regulation that attempts to protect public health and the environment from pollution by industry and development Tariff The amount of tax or duty to be paid on a particular class of
imports or exports
Intellectual property To what degree does the government protect intellectual
property, which is a category of property that includes intangible creations of the human intellect including copyrights, patents, trademarks, and trade secrets
For each pair of factors below, please rate the relative importance for a foreign consumer electronics company (e.g., Foxconn, LG, etc.) to evaluate whether a given area is appropriate to run its manufacturing supply chain.
Factor A
Please check the relative importance of factor A (left column) to factor B (right column) by using the scale from 1 to 9 (9 = Extreme, 7 = Very strong, 5 = Strong, 3 = Moderate, and 1= Equal)
Factor B 9:
1 8:
1 7:
1 6:
1 5:
1 4:
1 3:
1 2:
1 1:
1 1:
2 1:
3 1:
4 1:
5 1:
6 1:
7 1:
8 1:9
Business regulations and taxation
Industrial incentives and benefit
Environme ntal regulation
Tariff
Intellectual property
Industrial incentives and benefit
Environme ntal regulation
Tariff
Intellectual property
Environmen tal regulation
Tariff
Intellectual property
Tariff Intellectual
property