國立臺灣大學工學院材料科學與工程研究所 碩士論文
Graduate Institute of Materials Science and Engineering College of Engineering
National Taiwan University Master Thesis
氧化釓添加氧化鈰纖維與錳酸鍶鑭粉體之製備與分析 Synthesis and Characterization of Gd2O3 doped CeO2 Fibers and
(La, Sr)MnO3 Powders
游哲彥 Je-Yan, Yu
指導教授﹕韋文誠 博士 Advisor: Wei Wen-Cheng, Ph.D.
中華民國97年7月 July, 2008
誌謝
94 年夏天,剛從台大化學系畢業的我,來到材料所這個全新的世界,開始我
的碩士生涯。進入Wei Group 這個大家庭,是我踏入這個新領域的第一步。在韋文
誠老師的帶領下,接觸到了我過去從沒真正了解過的陶瓷材料,也看見了韋老師 在研究上的執著與熱誠。在這豐富的研究生活中,老師不厭其煩的指導與叮嚀,
甚至在論文完成的最後關鍵時刻,犧牲了自己寶貴的假日來幫助我完成論文,這 些舉動無不讓我感動萬分。對於老師,我除了感激之外還是感激!另外,也要感 謝林唯芳教授、郭俞麟教授及洪逸明教授於百忙之中抽空參加我的口試,給予指 導。您們的建議與指教,都讓我獲益匪淺。
實驗室裡的夥伴對我的幫忙與支持,都讓我在遇到困難時,能找到解決的方 法。彥友學長,你一針見血的建議總讓我看清問題的癥結,也使我更懂得如何解
決困難。邦英學姊,你的熱心與精湛的TEM 技術,在我心中僅有佩服二字而已,
在這裡也要祝福學姐永遠幸福。頌恩學長,身為實驗室的創意王與體育老師,你 真是做的太稱職了,任何看似不可能的樣品製備或實驗,在你眼中似乎都能輕易 找到成功的路徑。浚傑學長,你圓融的處事態度及應對,總是我最欣賞也最希望 學習的,希望你未來的博士生涯能順利而圓滿。一中學長,雖然因為工作關係無 法常在實驗室,但你卻永遠關心我們的近況,也在任何困難的時刻提供協助,真 是謝謝你!右儒學長,你明快的決策與積極的實驗態度實在讓我佩服,一直以來 也是你提供了我各種實驗上的寶貴建議。而佳明與銘璁學長,當你們面對畢業的 壓力時,仍舊能一直給予當時還是碩一的我鼓勵。函育及家嘉,兩位我碩士班的 同窗,能與你們一同努力實在是我最大的榮幸,去年一起到大陸報告、出遊時共 同分享的緊張與快樂時光,都是我最珍貴的回憶。嬿雯及怡如兩位學妹,總是帶 給實驗室歡笑,讓實驗室的生活不至枯燥乏味,希望妳們未來都能鴻圖大展。做 為實驗室裡少數擁有豐富社會經驗的夥伴,居諭你所給予的眾多建議實在是惠我 良多,也讓我對即將來臨的新生活有了更充分的準備。永遠都在用功的勤文、隨
時都認真工作的士岳、總是努力又看不準猜不透的敬閎,以及新進的研究生智淵 還有專題生東祐,實驗室的未來還要靠你們努力,希望你們一切順利。另外,在 我碩士生涯之初,給予我許多幫助的馨怡學姐及仁彰學長,也祝福你們未來一帆 風順,在電腦模擬的領域發光發熱。
材料系辦的李玉玲小姐、林由莉小姐、呂碧玲小姐、周麗美小姐及張瑛梅小 姐,謝謝妳們在行政事務上一直給予的眾多幫忙。材料系的李苑慈學姊、陳學人 學長及高崇源學長,謝謝你們在儀器上的各項幫忙及協助,讓我能順利的取得實 驗數據。鶯歌陶瓷中心的沈俊良先生及陳彥涵小姐,你們實在提供了太多我實驗 中所需的分析儀器及分析技巧,謝謝你們過去這段時間的協助。鴻昇爐業的李老 闆,一直以來你都是我爐子使用上發生問題時最可靠的求救對象。永成白鐵行的 陳老闆,你的熱心我將永遠記在心裡,希望你兒子在未來大學四年的學生生涯能 一切順利。
最後,當然要感謝我的家人。你們的支持一直是我能專心於學業的最大支柱,
讓我沒有後顧之憂,能全力在這裡衝刺,謝謝你們。
I
摘要
在本研究中,選擇了兩種固態氧化物燃料電池的內部元件及一種單電池進行 其製備及分析。
首先,利用化學共沉法合成氧化釓添加氧化鈰(GDC)之纖維。由於其較高的導 電性,異價離子添加的氧化鈰是取代目前常見的釔安定氧化鋯(YSZ)電解質的適當
材料。合成的GDC 纖維透過 SEM、TEM、DTA/TG、XRD 及 ICP-AES 等技術進
行其化學,結晶動力學及微結構等性質的分析。結果顯示纖維之合成過程屬於零 級反應。且所合成之析出物的微結構會因檸檬酸及氫氧化鈉濃度之添加量不同而 有所影響。除了纖維之外,膠粒、柱狀及片狀之析出物亦可透過不同比例之檸檬 酸及氫氧化鈉濃度產生。
其次,當做固態氧化物燃料電池的陰極材料錳酸鍶鑭(LSM),透過兩種溶膠凝
膠法合成而得。其一為 Pechini 法,其二則是以聚丙烯酸(PAA)做為高分子添加劑
的溶膠凝膠法。除了上述的分析技術,所合成之粉末也以SEM-EDS 之技術進行全
定量分析以得知其化學成分之分布。同時,LSM 粉體終於熱處理過程中所殘餘之
碳含量則以碳硫分析儀進行分析,並以三點直流方式測定 LSM 與 YSZ 間之介面
電阻。
最後,電解質支撐之固態氧化物燃料電池也於此研究中製備。透過網印技術,
LSM 陰極薄膜及氧化鎳/氧化鋯(NiO/YSZ)陽極薄膜成功的披覆於氧化鋯的電解質 支撐上。此氧化鋯電解質之電性利用交流阻抗分析儀進行分析。最後也報導所製 備的三層燃料電池之單電池微結構。
關鍵字:固態氧化物燃料電池、電解質、氧化釓添加氧化鈰、纖維、化學共沉法、
反應動力學、陰極、錳酸鍶鑭、Pechini 法、溶膠凝膠法
II
Abstract
This study, two components in solid oxide fuel cell (SOFC) and one cell were
fabricated and analyzed. First, fibrous Gd2O3 doped ceria (GDC), which is the
alternative material for electrolyte, was synthesized by chemical co-precipitate method.
The chemical, growth and microstructural properties of the GDC fibers were
characterized by scanning and transmission electron microscopies (SEM and TEM),
differential thermogravimetry (DTA/TG), X-ray diffraction (XRD), and inductive
coupling plasma-atomic emission spectroscopy (ICP-AES) technologies. The results of
fiber synthesis reaction showed zero-order kinetics. The morphologies were closely
affected by the concentrations of additives, citric acid and sodium hydroxide. Three
types of morphologies, including spherical colloids, fibers, stick-in-bundles, and flakes
could be synthesized by control the ratio of citric acid and sodium hydroxide.
Second, LSM powders were synthesized by Pechini method and a sol-gel process
with PAA as chelating agent. Besides the analysis technologies mentioned above, the
powders were also characterized by quantitative energy dispersive spectroscopy (EDS)
to identify their compositional homogeneity. In addition, the residual carbon content in
the LSM powders and their electrical resistance of the LSM/YSZ interface were also
analyzed by carbon/sulfur analyzer and 3-terminal measurement, respectively.
III
Finally, an electrolyte supported SOFC was fabricated by screen printing. The
electrical conductivity of 8Y-YSZ electrolyte analyzed by AC impedance and the
microstructure of the tri-layer single cell were prepared and characterized.
Keywords: SOFC, electrolyte, GDC, fiber, co-precipitation, reaction kinetics, cathode, LSM, sol-gel method, Pechini method
IV
Content
List of Figures ... VI List of Tables ... X
Chapter 1 Introduction ... 1
Chapter 2 Literature Review ... 4
2.1 Electric Conductive Cerium Oxide ... 4
2.2 Synthesis of Oxide Fibers ... 11
2.2.1 AAO Template ... 11
2.2.2 Hydrothermal Precipitation ... 12
2.2.3 Electrospinning ... 13
2.2.4 Precipitation Method ... 16
2.3 Electrical Properties of Cerium Oxide ... 20
2.3.1 Theory of Oxygen Transport ... 20
2.3.2 Dopant Effect ... 22
2.3.3 Grain Boundary/Impurity Effects ... 27
2.3.4 Reduction Behavior of Ceria ... 28
2.4 Cathode Materials for SOFC ... 39
2.4.1 LaMnO3 Materials ... 40
2.4.2 Synthesis of LSM Powders ... 42
Chapter 3 Experimental ... 46
3.1 Materials ... 46
3.2 Synthesis of Doped/Undoped Ceria Fibers ... 47
3.3 Fabrication of Cathode Powders ... 48
3.3.1 Sol-Gel Synthesis ... 48
3.3.2 Pechini Method ... 49
3.4 Single Cell Fabrication ... 49
3.4.1 Fabrication of Dense YSZ Thin Plate ... 49
3.4.2 Anode and Cathode Thin Film Fabrication ... 50
3.5 Characterization ... 50
3.5.1 ICP-AES Analysis ... 50
3.5.2 Density Measurement ... 51
3.5.3 Thermal Analysis ... 52
3.5.4 BET Measurement ... 53
3.5.5 Residual Carbon Analysis ... 53
3.5.6 Microstructural Analysis and Phase Identification ... 54
(1) SEM Observation. ... 54
V
(2) TEM Observation ... 55
3.5.7 XRD Analysis ... 56
3.5.8 Electrical Properties Measurement ... 56
(1) DC Electrical Measurement ... 56
(2) Electrochemical Impedance Spectroscopy Measurement ... 58
Chapter 4 Results and Discussions ... 68
4.1 Synthesis of CeO2 (GDC and SDC) Fibers ... 68
4.1.1 Effects of Sodium Hydroxide/Citric Acid ... 68
4.1.2 Kinetic Analysis of Fiber Synthesis ... 70
4.1.3 Morphology Evolution by Thermal Treatment ... 74
4.2 Properties of LSM Powders ... 96
4.2.1 Phase Formation of LSM ... 96
4.2.2 Quantitative Analysis of Composition ... 98
4.2.3 Reduction of Surface Area ... 100
4.2.4 Electrical Properties of LSM Powders ... 101
4.3 Fabrication and Properties of Electrolyte Supported SOFC Single Cell121 4.3.1 Sintering Behavior and Electric Properties of 8YSZ Plate ... 121
4.3.2 Fabrication of Anode and Cathode Layers ... 123
Chapter 5 Conclusions ... 131
References ... 134
VI
List of Figures
Fig. 2.1 (a) Fluorite structure, CeO2 structure of showing (b) oxygen ion and (c) cerium ion is selected as the original point, respectively. ... 8 Fig. 2.2 Temperature depend electrical conductivities of 8YSZ, 8YSZ in dry O2, 20GDC, LSGM and Bi3NbO7-Bi3YO6, the dotted curve presents the electrical conductivity equal to 0.01 S/cm. Guo measured the 8YSZ sample in dry oxygen atmosphere, instead of air atmosphere. ... 9 Fig. 2.3 Fluorite structure with one host cation replaced by a lower-valent cation, and created an oxygen vacancy. ... 10 Fig. 2.4 Scheme of electrospinning of ceramic fibers. ... 19 Fig. 2.5 Vacancy concentration dependence of the ionic conductivity from Eq. (8) ... 33 Fig. 2.6 Ionic conductivity of aliovalent doped ceria at 800oC against the radius of
dopant cation. ... 34 Fig. 2.7 (a) Calculated binding energy of trivalent substitutional ions to an oxygen
vacancy, (b) configuration of first, second and third neighbor oxygen vacancies with respect to the substitutional trivalent ion in a unit cell. ... 35 Fig. 2.8 Electrical conductivity of (a) pure ceria and (b) 20GDC system against
oxygen partial pressure at different temperature ... 36 Fig. 2.9 Dopant radius dependence *
O2
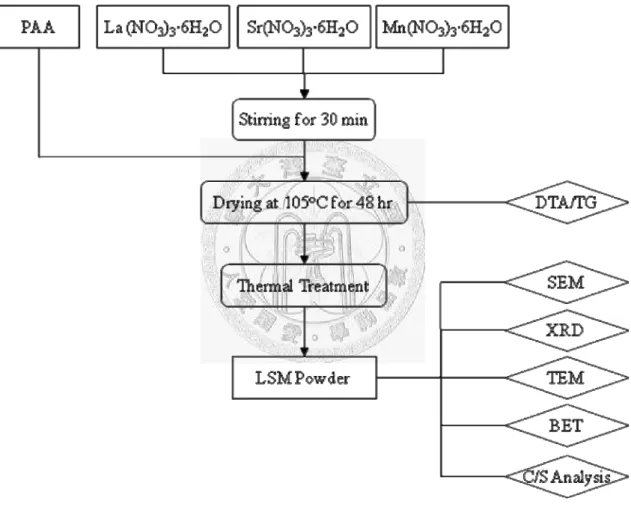
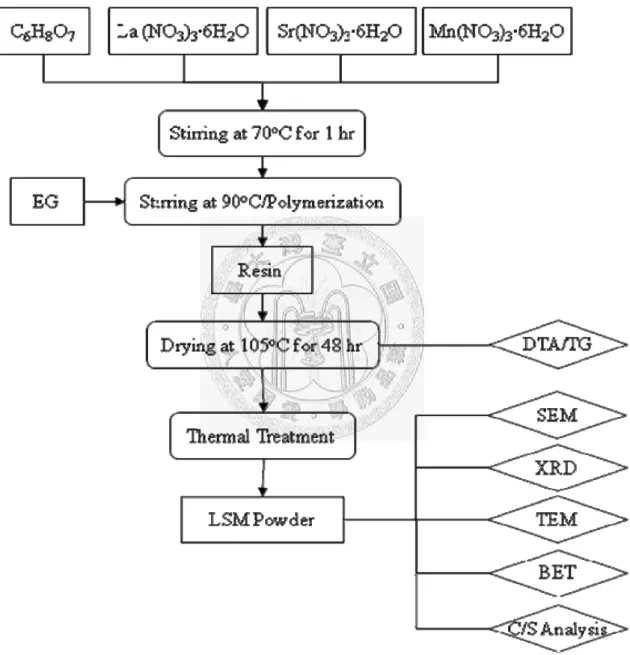
P (ti = 0.5) of doped ceria with rare-earth dopant. ... 38 Fig. 3.1 Experimental flowchart of GDC fiber synthesis. ... 59 Fig. 3.2 Experimental flowchart of LSM powder synthesized by sol-gel process with
PAA as gelling agent. ... 63 Fig. 3.3 Experimental flowchart of LSM powder synthesized by Pechini method. .... 64 Fig. 3.4 (a) Top view of the electrodes, and (b) side view of the configuration scheme of 3-terminal electrical measurement. ... 65 Fig. 3.5 Thermal treatment procedures of LSM powders. All the treatment was
conducted in atmosphere. The procedure of P-LSM and A-LSM was 2oC/min to 400oC, than holding for 1 hr. The ramp rate of P-LSM-S and A-LSM-S was 1oC/min, and the isothermal treatment was 1 hr at 300oC for P-LSM-S and 3 hr at 200oC for A-LSM-S. ... 66 Fig. 3.6 Block diagram (original code) of 3-terminal electrical measurement
monitoring software.
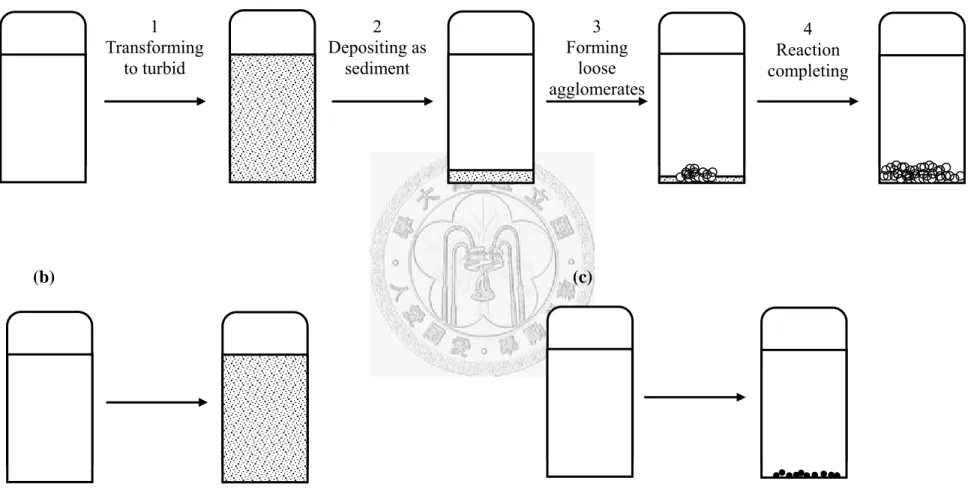
... 67 Fig. 4.1 Schematic diagram showing the change of reacting solution growing (a)
VII
fibrous, (b) flake-shape, and (c) stick-in-bundle precipitates. ... 78 Fig. 4.2 As-prepared cerium hydrocarbonate precipitates with the [NaOH]/[C6H8O7] ratio equal to (a) 0.8, in a flake shape, (b) 0.2, in a shape of stick-in-bundle.
The solutions were aged at 90oC for 24 hr. ... 79 Fig. 4.3 Concentration of [NaOH] and [C6H8O7] illustrating the resulted morphologies of cerium hydrocarbonate precipitates aged at 90oC for 24 hr. The starting concentration of cerium ion was (a) 0.025 m and (b) 0.1 m. In (a), the solid and dash lines represent the ratio of 0.5 and 0.8, respectively. The symbols with “*” were previous results reported by Sung. ... 80 Fig. 4.4 As-prepared cerium hydrocarbonate fibrous precipitates with a
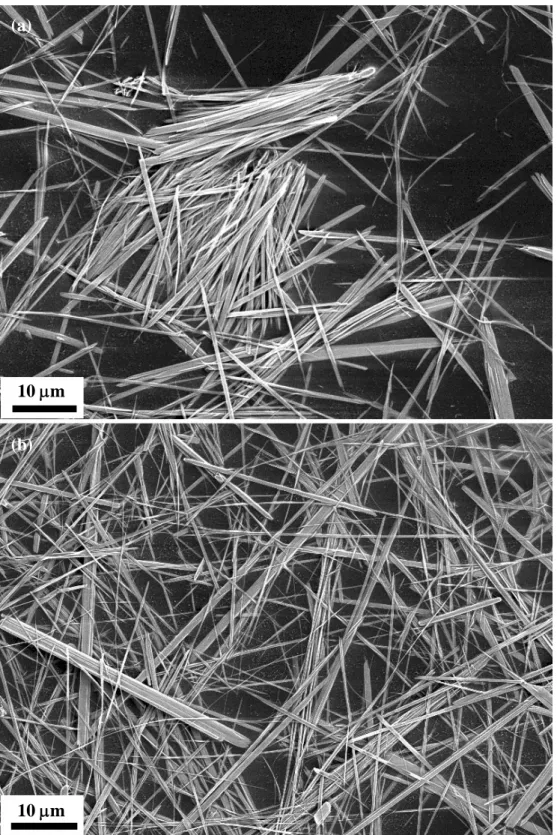
[NaOH]/[C6H8O7] ratio of 0.6 (sample 1) aging for (a) 12 hr and (b) 60 hr, respectively, and ratio of 0.8 (sample 15) aging for (c) 24 hr and (d) 62 hr, respectively. ... 81 Fig. 4.5 SEM micrographs showing the fibrous microstructures of 20 mol% (a) Gd3+
doped and (b) Sm3+ doped cerium hydrocarbonate fibers. ... 82 Fig. 4.6 Residual concentrations of Ce3+ and Gd3+ ions during aging period by ICP. . 84 Fig. 4.7 Residual concentrations of Ce3+ ions of fibrous, flake, and stick-in-bundle
precipitates synthesis during aging period by ICP. The labeled numbers represent the sample numbers in Fig. 4.3. ... 85 Fig. 4.8 SEM micrographs of Gd doped cerium hydrocrabonate precipitate with (a) 2
hr, (b) 5 hr, (c) 7 hr 20 min, (d) 10 hr, (e) 12 hr, and (f) 24 hr aging period... 86 Fig. 4.9 Aspect ratio variation of Gd doped cerium hydrocarbonate precipitation
(sample 1 in Table 3.2) against aging time. ... 87 Fig. 4.10 SEM microstructure of Gd doped cerium hydrocrabonate precipitate with 1 hr aging period, in which the specimen was sampled in D.I. water. ... 88 Fig. 4.11 XRD patterns of as-prepared (a) pure cerium, (b) gadolinium doped, and (c)
samarium doped hydrocarbonate fibers. ... 89 Fig. 4.12 DTA/TG analysis results of GDC fibers with a ramp rate of 10oC/min. ... 90 Fig. 4.13 DTA/TG analysis results of GDC fibers with a ramp rate of 3oC/min to (a)
220oC and (b) 200oC, then holding for 1 hr. ... 91 Fig. 4.14 XRD patterns of GDC fibers thermal treated at (a) 200oC, (b) 300oC, (c)
400oC, and (d) 600oC for 1 hr. ... 92 Fig. 4.15 (a) BF image and (b) negative CDF image of GDC fibers thermal treated at
600oC for 1 hr. ... 93 Fig. 4.16 SEM images of 1200oC thermally treated GDC (a) single fiber and (b) TEM bright field image revealing polycrystalline character, (c) SEM image of
VIII
as-prepared GDC hydrocarbonate fibers with some agglomeration, and (d) fibrous morphologies in bundle. ... 94 Fig. 4.17 Average grain size of GDC fiber plotted against thermal treatment
temperature. ... 95 Fig. 4.18 DTA/TG results of P-LSM powders. The temperature ramp rate was 10oC/min.
... 105 Fig.4.19 XRD patterns of P-LSM powders (a) as-prepared, and by different thermal
treatment at the temperature of (b) 300oC, (c) 400oC, (d) 500oC, (e) 600oC, (f) 700oC, (g) 800oC, and (h) 900oC. ... 106 Fig. 4.20 DTA/TG results of A-LSM powder. The temperature ramp rate was 10oC/min.
... 107 Fig.4.21 XRD patterns of A-LSM powders (a) as-prepared, and by different thermal
treatment at temperature of, (b) 300oC, (c) 400oC, (d) 500oC, (e) 600oC, (f) 700oC, (g) 800oC, and (h) 900oC. ... 108 Fig. 4.22 TEM micrographs showing (a) BF and (b) negative CDF of 800oC thermal
treated P-LSM powders, and (c) BF and (d) negative CDF of A-LSM 800oC thermal treated powders... 109 Fig. 4.23 Plot of specific surface area against thermal treated temperature of P-LSM
and A-LSM. ... 112 Fig. 4.24 SEM microstructures showing fracture surfaces of sintered (a) P-LSM-S, (b)
A-LSM-S, and (c) H-LSM layers on YSZ substrates thermal treated at 1200oC for 1 hr. ... 113 Fig. 4.25 SEM micrograph showing fracture surface of porous P-LSM layer on YSZ
electrolyte thermally treated at 1200oC for 1 hr. ... 114 Fig. 4.26 (a) Voltage curve profile with 7.5 mA current input and (b) linear I-V curve of
1200oC thermally treated A-LSM-S/YSZ half cell at 500oC. ... 117 Fig. 4.27 Arrhenius plot of log(T/ASR) of various LSM layers prepared by spray
coating, then thermal treating at 1200oC for 1 hr. ... 119 Fig. 4.28 SEM micrographs showing fracture surfaces of sintered P-LSM-S layers and
YSZ thermally treated at (a) 1100oC and (b) 1200oC for 1 hr. ... 120 Fig. 4.29 Relative density and average grain size plotted against sintering temperature
of YSZ tape. ... 125 Fig. 4.30 SEM micrographs showing the top microstructures of 8Y-YSZ tape sintered at (a) 1200oC, (b) 1300oC, (c) 1400oC, (d) 1500oC, and (e) 1600oC for 1 hr in air.
... 126 Fig. 4.31 AC impedance results of 1500oC sintered 8Y-YSZ plate in static flowing air at
IX
(a) 700oC, (b) 600oC, (c) 500oC, (d) 400oC, and (e) 300oC. ... 127 Fig. 4.32 Plot of electrical conductivity against reciprocal absolute temperature. ... 128 Fig. 4.33 SEM microstructures of fractures of LSM/YSZ interface co-sintered at (a)
1000oC, (b) 1100oC, (c) 1200oC, and (d) 1300oC for 1 hr. ... 129 Fig. 4.34 SEM microstructures of (a) the fracture surface of LSM/YSZ/NiO-YSZ single cell final-treated at 1200oC for 1 hr, the top views of (b) LSM and (c) NiO-YSZ layers, and (d) closer-view of the fracture surface of YSZ electrolyte ... 130
X
List of Tables
Table 2.1 Compariion of three fiber fabrication procedures ... 18 Table 2.2 Ionic conductivities and ionic transference number (ti) of rare earth doped
ceria at 800oC... 37 Table 2.3 Comparison of LSM fabrication procedures ... 45 Table 3.1 Formulations of the synthesis of cerium hydrocarbonate fiber, [Ce3+]= 0.025 mc ... 60 Table 3.1 Continued ... 61 Table 3.2 Formulations for the synthesis of cerium hydrocarbonate synthesis,
[Ce3+]=0.1 mc ... 62 Table 4.1 ICP quantitative results of Gd and Sm doped cerium hydrocarbonate fibers
and correspondent formulation of GDC and SDC ... 83 Table 4.2 Quantitative analysis of P-LSM and A-LSM ... 110 Table 4.3 BET specific surface area of P-LSM and A-LSM thermal treated at various
temperatures ... 111 Table 4.4 Characteristic length of TBP of YSZ and all the LSM thin layers calculated
according to Saltykov equation ... 115 Table 4.5 Carbon content of LSM powders by the treatment in specified conditions 116 Table 4.6 ASR results of all the LSM layers on YSZ electrolyte thermal treated at
1200oC ... 118
1
Chapter 1 Introduction
Solid oxide fuel cell (SOFC) is an electrical energy generator. Comparing with
traditional power plant, SOFC transforms chemical energy into electrical energy directly
without associated mechanical energy loss, which makes SOFC a high efficiency (to
85% theoretical maximum) and noiseless power generator. Several advantages of SOFC
have been known in literature[U.S. Department of Energy, 2004]. The cell adapts variety kinds of
fuels without poisoning the electrodes. If hydrogen is fed as fuel, the by-products will
be nothing but water vapor and heat exhaust. Besides, the additional by-product is
carbon dioxide if hydrocarbon fuels are used.
8 mol% yttria-stabilized zirconia (8YSZ) is the most common electrolyte material
for SOFC due to its high stabilization in reduced atmosphere at high operation
temperature (>800oC). The ionic conductivity of YSZ is almost independent of oxygen
partial pressure when the oxygen partial pressure is higher than 10-24 atm[Minh, 1993]. But
high operation temperature (~800oC) is one of shortages as for SOFC applications. In
contrast, ceria (CeO2) possibly works as an electrolyte at intermediate temperature (of
650oC~500oC). This advantage makes ceria-cell able to shorten the start-up period of
SOFC, and to reduce the material degradation rate. Therefore, the life time of SOFC
may be extended dramatically.
2
In a SOFC, the cathode material must exhibits good electronic and ionic
conductivities. On the other hand, its structure should be porous for gas diffusion.
Porous structure of cathode is also helpful to suppress thermal shock during cycling
operation. Essentially, match of coefficient of thermal expansion (CTE) of electrode and
electrolyte is another important issue as engineering the materials. As a consequence,
porous cathode consisted of perovskite type strontium-doped lanthanum manganite
((La,Sr)MnO3, LSM) in good conductivity (better than 100 S/cm at 1000oC[Kuo et al., 1990])
and matched CTE to electrolyte (8YSZ and Sm-doped CeO2) is the primary interesting
target of this study.
Objectives
In this study, gadolinia and samaria doped ceria (GDC, SDC) fibers were
synthesized by chemical co-precipitate method, as our previous patent application[Sung et
al., 2007]. The doped ceria fiber is a potential material to modify the surface of ceria- or
zirconia-based electrolyte, by increase of the surface area of electrolyte. With the
coating of doped ceria fibers, the area of triple-phase-boundary (TPB, the three phase
boundary of ionic conductor, electrical conductor, and gas phase) tends to be increased.
Previous study[Sung, 2007] on morphology observation (aspect ratio) of synthesized
3
fibers, the concentrations of starting agents, such as citric acid and sodium hydroxide,
are important issues. Other than fibers, the stick-in-bundle and flake-shape colloidal
particles could be synthesized with different concentrations of starting agents. The
chemical composition and kinetic reaction of fibers are interesting and essential for the
development of fiber technology.
LSM powder for cathode was prepared by two sol-gel routes in this study,
including Pechini method[Pechini 1967] and the sol-gel process with polyacrylic acid (PAA)
as gelling agent[Hsu, 2003]. Binder-burn-out of organic additive is one of the important
steps for the synthesis of high quality LSM powder. The chemical composition, the
homogeneity and carbon residue of synthesized LSM powders is important for electric
conductivity. Quantitative analysis with EDS is necessary to verify the relationship. The
effect of the residual carbon on interface area specific resistance (ASR) between LSM
and YSZ will be discussed with respect to various thermal treatments of the powders.
4
Chapter 2 Literature Review
2.1 Electric Conductive Cerium Oxide
Cerium oxide (CeO2), also called ceria, shows light yellow color. The crystal
structure of ceria at room temperature is a fluorite (CaF2) structure, as shown in Fig.
2.1[Chiang, 1997]. Ceria with tri-valent dopant (e.g. Sm3+) is a potential alternative
electrolyte of SOFCs due to its several advantages over zirconia-based oxide. Fig. 2.2
compares the conductivities of some potential materials, including yttria stabilized
zirconia (YSZ)[Yang et al., 2003][Guo et al., 2005], gadolinia doped ceria (GDC)[Sin et al., 2004],
La1-xSrxGa1-yMgyO3-δ (LSGM)[Ohnuki et al., 2006], and Bi3NbO7-Bi3YO6[Abrahams et al., 2006]
systems. All the samples in Fig. 2.2 were bulky specimens. The conductivity of 20GDC
(20 mol% Gd) is about one order better than that of 8YSZ, especially in the temperature
lower than 600oC.
The other materials, such as LSGM and bismuth-based systems show a higher
conductivity (Fig. 2.2), but some known disadvantages, such as difficult to synthesize a
pure pervoskite LSGM phase, or reduction of Bi-based system, limit LSGM and
Bi-based electrolytes for practical application in SOFCs.
For a SOFC, the conductivity should exceed 0.01 S/cm (Fig. 2.2). It is noted that
the working temperature for YSZ system normally higher than 700oC, and higher than
5
550oC for LSGM and GDC systems. The working temperature, however, could be
reduced by decreasing the thickness of electrolyte. Therefore, the necessary temperature
for operating could be further reduced by decreasing its electrolyte thickness of anode
or cathode supported SOFC.
Similar with zirconia-based electrolyte, the ionic conductivity of ceria material is
controlled by the concentration of oxygen vacancies. The major oxygen vacancies are
coming from the extrinsic addition of aliovalent oxides, such as Gd2O3 and Sm2O3. The
defect reaction of the dissolution of Gd2O3 into CeO2 lattice could be written in
Kroger-Vink notation as follow.
•
•
× + +
⎯
⎯ →
⎯CeO GdCe OO VO O
Gd2 3 2 2 ' 3 (2-1)
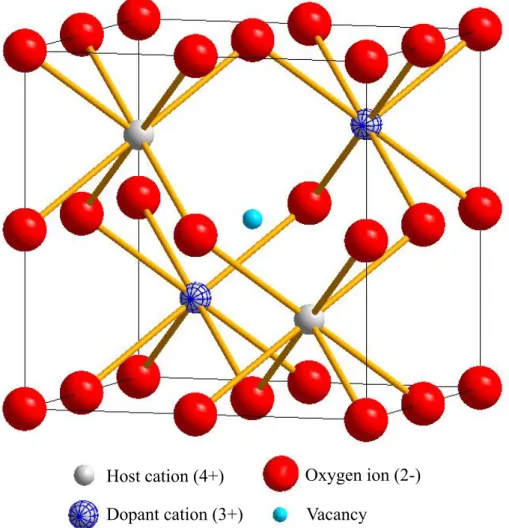
Two Ce4+ ions are substituted by two Gd3+ ions, and result in an oxygen vacancy. Fig.
2.3 shows a unit cell of doped fluorite structure with vacancy defect. In GDC case, the
host cation is Ce4+ and the dopant is Gd3+. As showing in Eq. (2-1), to maintain the
electrical neutrality, the following concentration relationship should exist.
] [ ] [
2GdCe' = VO•• (2-2)
and the ionic conductivity (σi) could be expressed as follow.
σi = qnμ (2-3)
where q is the charge, n and μ are the number of mobile oxygen vacancies and mobility
6
of oxygen ions, respectively. According to Eq. (2-2), the concentration of oxygen
vacancies will linearly increase with the increasing of dopant concentration. The
number of mobile oxygen vacancies (n), however, will not linearly increase with the
dopant due to the formation of defect association between GdCe' and VO•• at lower
temperature. The defect association will consume the number of mobile oxygen
vacancies. Therefore, the concentration and ionic conductivity of mobile oxygen
decrease as the doping amount reaches its plateau even though the total number of
oxygen vacancies increases linearly[Singhal et al., 2003]. Similar phenomenon has also been
reported for other cases with aliovalence dopant, such as Sm3+. In Yahiro’s study[Yahiro et
al., 1988], the conductivity of SDC increased with the increasing of Sm content, then
decreased when the content of Sm was higher than 20 at%. Other results were also
reported by Huang’s[Huang et al., 1997] and Zha’s[Zha et al., 2003] works. The optimal content of
Gd or Sm ion was around 15 at%~17 at%. In addition, Yahiro et al. reported that the
conductivity of 20SDC at 500oC is close to the conductivity of calcia stabilized zirconia
(CSZ) at 900oC. This high conductivity of doped ceria apparently offered the possibility
for a SOFC to work at intermediate temperature (500oC~700oC).
Although doped ceria shows better electrical conductivity than that of stabilized
zirconia, the reduction behavior of doped ceria, as shown in the following equation,
7
made the electrolyte semi-conductive.
' )
2( 2
2
1O V e
OO× = g + O••+ (2-4)
The reduction of Ce4+ to Ce3+ or to metallic Ce induces high electronic conductivity,
showing n-type conductive behavior. The electric current flowing through the CeO2
electrolyte, instead of open circuit, lowers the terminal voltage from theoretical value,
and further reduces the output power efficiency of SOFC. As the increase of electronic
conductivity resulting from the reduction of cerium ions, the ionic transference number
(ti) decreases.
Tuller and Nowick[Tuller et al., 1975] found the linear relationship between oxygen
partial pressure and reciprocal temperature at different ti values of yttria doped ceria
(YDC). Their study reported that the oxygen partial pressure difference between ti =
0.99 and ti = 0.9 is about four orders. The ti value of the YDC could reach up to 0.99
only when the oxygen partial pressure higher than 10-6 atm at 800oC, but this pressure
could drop to about 10-21 atm at 450oC.
8
Fig. 2.1 (a) Fluorite structure[Chiang et al., 1997], CeO2 structure of showing (b) oxygen ion and (c) cerium ion is selected as the original point, respectively.
O Zr
Cerium ion Oxygen ion (a)
(b) (c)
9
Fig. 2.2 Temperature depend electrical conductivities of 8YSZ[Yang et al., 2003], 8YSZ in dry O2[Guo et al., 2005], 20GDC[Sin et al., 2004], LSGM[Ohnuki et al., 2006] and Bi3NbO7-Bi3YO6[Abrahams et al., 2006], the dotted curve presents the electrical conductivity equal to 0.01 S/cm. Guo[Guo et
al., 2005] measured the 8YSZ sample in dry oxygen atmosphere, instead of air atmosphere.
0.6 0.8 1 1.2 1.4 1.6 1.8 2 2.2 1000/T (1/K)
-5 -4 -3 -2 -1 0 1 2 3
log( σ T) (S K/ cm )
8YSZ
8YSZ in dry O
220GDC
LSGM
Bi3NbO7-Bi3YO6 σ =0.01(S/cm)
1000800 600 500 400 300 200
T (oC)
10
Fig. 2.3 Fluorite structure with one host cation replaced by a lower-valent cation, and created an oxygen vacancy.
Dopant cation (3+)
Host cation (4+) Oxygen ion (2-) Vacancy
11
2.2 Synthesis of Oxide Fibers
There are four different methods that were used to synthesize ceria or zirconia
nanowires, nanorods, or fibers. Those included anodic alumina oxide (AAO) template,
hydrothermal precipitate, electrospun (also called electrospinning), and base-acid
precipitation methods. Table 2.1 summarized the results from these procedures.
2.2.1 AAO Template
With an Al sheet as a template with uniform pore distribution and capillary size, a
sol-gel procedure of oxide fiber was applied to fabricate nanowires in the capillaries. In
Xu’s research[Xu et al., 2003], an Al sheet was first corroded by phosphoric acid and
obtained a sheet with vertical capillaries that were uniformly distributed on the sheet.
The average diameter of the capillary was about 200 nm and the depth was about 50 μm.
The capillary density is 108~1011 #/cm2. Zirconyl chloride (ZrOCl·8H2O) dissolving in
alcohol solution was the precursor and the pH value was controlled to 2.0 with HCl.
After immersing the Al-Al2O3 (AAO) template into precursor for different periods, the
sheet was dried at room temperature for 1 hr and then thermal treated at 600oC for 6 hr.
The zirconia nanowires were removed by dissolving AAO template in NaOH, and then
rinsing the NaOH.
12
The dimensions of nanowires were the same as the capillary on the AAO sheet.
The ring diffraction pattern from TEM indicated that the nanowires were polycrystalline
with cubic phase. Different kinds of shape of zirconia could be synthesized with
different immersion period. With a longer immersion period, nanowires could be
synthesized. However, zirconia nanotubes would form with shorter immersion period.
2.2.2 Hydrothermal Precipitation
Hydrotheraml treatment is a potential procedure to fabricate ceramic powder
without calcination. The obtained particle size could be retained to nano-scale because
that the calcination step can be skipped. Besides, there are the other advantages of this
procedure, including homogeneous nucleation, relative lower synthesis temperature and
weak agglomeration.
In Zhou’s study[Zhou et al., 2005], a directly addition of NaOH into cerium nitration
solution was applied. The formed yellow slurry underwent a hydrothermal treatment at
100oC for 10 h with an autogenous pressure and following thermal treatment at 350oC
for 4 hr. Ceria nanorods with 100~300 nm in length and 13~20 nm in diameter were
obtained. To compare with ceria nanorods, ceria powders synthesized with the same
procedure without hydrothermal treatment were also fabricated. The ceria powders
13
exhibited irregular shape with an average particle size about 8 nm, and weak
agglomeration was observed by TEM. Both powders showed pure cubic fluorite
structure by XRD analysis.
CO catalytic oxidation was applied in both ceria nanorods (with hydrothermal
treatment) and nanoparticles (without hydrothermal treatment). The results revealed that
ceria nanorods showed better CO conversion than that of the ceria nanoparticles even
though the nanoparticles have greater specific surface area than the nanorods by BET
measurement. The adsorptive ability of CO to different plane of ceria results in this
unusual phenomenon. According to their HRTEM results, ceria nanorods grew along
[110] direction and enclosed by {110} and {001} planes, which could adsorb CO more
easily. In contrast, the domain planes in nanoparticles were identified to be {111} which
were less reactive with CO molecule. Due to the reactivity planes, the ceria nanorods
were better as a catalyst for CO oxidation than nanoparticles.
2.2.3 Electrospinning
This method is also called electrospun. Fig. 2.4 shows the scheme of this method.
A solution (or suspension) with certain viscosity was carried by a syringe pump with
capillary. When applying a voltage onto the orifice of capillary, the pendant
14
hemispherical drop at the orifice would carry the charge and form a conical shape
(Taylor cone). When a critical voltage is reached a critical value, the electronic force
from the charge on the drop would overcome the surface tension of the solution (The
Rayleigh instability), and a jet of solution could be ejected from one electrode (orifice)
to the other[Subbiah et al., 2005]. The solvent was evaporated during the spur, and the
polymer-ceramic green fibers could be formed. This process is a good method to
fabricate extreme long fibers and easy for manufacturing.
In Azad’s study[Azad et al., 2005], a syringe pump was filled with solution consist of
Y3+/Zr4+ or Gd3+/Ce4+ ions and PVP for electrospinning. High voltage ranging between
12 and 15 kV were applied onto the capillary of syringe pump to provide the electric
field on the solution, and the flow rate was controlled to be from 0.03 to 0.12 ml/h. The
fabricated fibers were then calcined at 1500oC (for YSZ fibers) and 1000oC (for GDC
fibers). The YSZ and GDC fibers remained their morphologies without any breaking
during the thermal treatment. The diameter of the 10GDC fiber was about 350 nm
showing polycrystalline by 1000oC and 1200oC treatments. Raman spectrum analysis
showed that there were no PVP polymers left in the fibers. Pure cubic fluorite structure
of zirconia and ceria was observed. The viscosity of precursor for Yang’s
electrospinning was also provided by PVA. In their study[Yang et al., 2005], the applied
15
voltage was reduced to 7 kV, and the final diameter of ceria fibers was between 50 and
100 nm. The XRD analysis revealed that pure ceria was obtained after calcination at
500oC.
Besides electrospinning with solution, zirconia suspension could also be the
precursor for the electrospinning used in Zhang’s research[Zhang et al., 2006], of which the
applied voltage would affect the morphology of the fiber product. With a voltage higher
than 11.6 kV, necking of as-prepared fiber was observed. This phenomenon got more
apparent with the increasing of applied voltage. In contrast, when the voltage was less
than 11.6 kV, the fiber could not be formed due to the unstability of conical drop (shown
in Fig. 2.4). The diameter of as-prepared fibers was linear proportion to the zirconia
powder content in solution. The fibers could not be prepared when the solid content was
lower than 1 wt%. On the other hand, due to the shrinkage of fiber during thermal
treatment, the fiber could not be fabricated when the solid content was higher than 10
wt%, either. After sintering at 1200oC, the grain size of zirconia grew from 5~10 nm to
about 150 nm. This final grain size limited the smallest diameter of the fibers to about
200 nm.
16
2.2.4 Precipitation Method
One of the requirements for an electrolyte used for SOFC includes high sintered
density to maintain high ionic conductivity, and to avoid the cross-diffusion of oxygen
and fuel. In order to reduce the sintering temperature of the ceramic electrolyte, the
particle size of starting powders should be as small as possible. Besides, the spherical-
like morphology of the starting powder could also favor particle flowing in mold and
shape forming. In order to fabricate ultra fine powders with spherical shape,
co-precipitate synthesis has been widely used due to its homogeneous and nano-scale
particle synthesis. In addition, by using different synthesis conditions, different particle
morphologies of the precipitates can be made.
Wang et al.[Wang et al., 2003] fabricated spherical particles of SDC with a precipitant of
ammonium hydrogen carbonate (AHC, NH4HCO3). These SDC powders could be
sintered up to >99% theoretical density (T.D.) at 1200oC. In Peng’s research[Peng et al., 2002],
glycine (NH2CH2COOH) was used as a precipitant, a relative density higher than 95%
of SDC pellet was obtained if sintering at 1500oC.
Therefore, almost no researchers focus on the fabrication of fibrous ceria-based
particles from solution. However, in Hsu’s study[Hsu et al., 1988], a solution with Ce(SO4)2
and H2SO4 aging at 90oC for 12 hr could appear Ce-contained rods, spheres, and the
17
mixture of rods and spheres in different material concentration ranges. The average size
of spherical particles is in the range of 30 to 240 nm. Higher concentrations of cerium
ions and H2SO4 increased the particle size. The effect of the addition of Na2SO4 was
investigated, which also influenced the average particle size. Besides, in a certain
concentration window of each starting species, Ce-contained rods with the dimension of
2 μm in length and submicron in width could be obtained in the same aging period of
the spherical synthesis.
18
Table 2.1 Compariion of three fiber fabrication procedures Methods AAO template Hydrothermal
precipitate Electrospinning Precipitation
Precursor ZrOCl·8H2O alcohol solution with HCl
NaOH added cerium slurry
Water based solution with PVP/zirconia powder suspension
Ce(SO4)2, H2SO4 and Na2SO4
Aspect ratio up to 250 20~30 N/A N/A
Crystalline Polycrystalline Single crystalline Polycrystalline N/A
Characters Nanowires or nanotube fabricated
Higher CO oxidation activity than CeO2
nanoparticles
Possibility for long fibers and easy
manufacture
Rods, spherical particles, or the mixture could be
fabricated
Reference [Xu et al., 2003] [Zhou et al., 2005]
[Zhang et al., 2006]
[Azad et al., 2005]
[Yang et al., 2005]
[Peng et al., 2002]
19
Fig. 2.4 Scheme of electrospinning of ceramic fibers.
High Voltage Supply Capillary
Solution or Suspension
Conical Drop
+
-
Collector Electrified Jet
20
2.3 Electrical Properties of Cerium Oxide
2.3.1 Theory of Oxygen Transport[Singhal et al., 2003][Kilner, 2000][Inaba et al., 1996]
The electrical conductivity (σ) of an ionic conductor could be expressed by
Arrhenius equation as following,
) exp( kT A E
T − a
σ = (2-5)
where A is a pre-exponential factor, k is Boltzmann constant and Ea is the activation
energy of electrical conduction. This equation is derived from Eq. (2-3). The mobility μ
is related to the self-diffusion coefficient,
kT D
= q
μ (2-6)
where q is charge, and D is the self-diffusion coefficient, which could be further
expressed by random walk theory in 3-dimension as shown below.
) exp(
) 1
6 ( 0
2
0 kT
a G c z f
D Δ m
−
−
= ν (2-7)
where z is the coordination number of the diffusive ion, 1/6 is the geometry constant of
a simple cubic structure, f is correlation factor which presents the deviation from
randomness of the ionic jumping, a0 is the jumping distance, ν0 is the jumping
frequency, ΔGm is the free energy of migration. The equivalent sites for oxygen ions to
transport, in fact, are partially occupied by oxygen ions. The fraction of the occupied
sites is the term c, and (1-c) is the fraction of the unoccupied sites. According to thermal
21
dynamic theory, ΔGm = ΔHm -TΔSm. Eq. (2-7) could be expanded as following,
) exp(
) exp(
) 1
6 ( 0
2
0 kT
H k
a S c z f
D m Δ m
Δ −
−
= ν (2-8)
Defining γ as
) 6 exp( k
f S
z Δ m
−
γ = (2-9)
and substitute Eq. (2-8) and Eq. (2-9) into Eq. (2-6), the mobility could be expressed as
) exp(
) 1
( 02 0
kT a H
kT c
q Δ m
−
−
= γ ν
μ (2-10)
In a crystal with vacancy sites for vacancies to transport, there are N sites per unit cell.
In Eq. (2-3), n is the number of mobile oxygen vacancies, and this number is the
product of N and c. Thus
) exp(
) 1
( 02 0
2
kT a H
c kT c
N q Δ m
−
−
= γ ν
σ (2-11)
Now replace the term (1-c) with [VO••], the concentration of oxygen vacancies, then the
alternative expression of Eq. (2-11),
) exp(
]) [ 1 ](
[ 02 0
2
kT a H
V kT V
N q O O Δ m
−
−
= γ •• •• ν
σ (2-12)
It is noted that the term ([VO••](1−[VO••]) will increase linearly with [VO••] at
extremely low [VO••] and reach a maximum at [VO••]≅1−[VO••]. Therefore, an ideal
expression of the trend of ionic conductivity depending on [VO••] is shown in Fig. 2.5.
22
2.3.2 Dopant Effect
In an ionic conductive material, such as ceria, the charge carrier is oxygen ion
vacancy (or oxygen), which dominates the ionic conductivity of ceria according to Eq.
(2-12). For a pure ceria, the oxygen vacancy is coming from the intrinsic defects
(Frenkel or Schottky), of which the concentration is remarkable at high temperature
only. For this reason, the conductivity of pure ceria is poor.
Fig. 2.5 is the plot of the ionic conductivity of ionic conductor against the vacancy
concentration[Kilner, 2000]. It is noted that the ionic conductivity shows linear behavior
with the [VO••] at extremely low [VO••] region. According to Eq. (2-2), the
conductivity is also proportional to the concentration of dopant and mobility of the ions.
Fig. 2.5 depicts that the ionic concentration will reach a maximum value when [VO••] is
around 0.5. But the experimental results showed that the maximum ionic conductivity
occurring at the dopant concentration apparently lower than the predicted value. In
Yahiro’s work[Yahiro et al., 1988], 20SDC (Sm0.2Ce0.8O1.9, 10 mol% Sm2O3 doping) exhibits
the highest ionic conductivity in SDC system. In this case, the concentration of oxygen
vacancies is only 5%. Similar doping amount of Gd2O3 in ceria was reported by several
researchers[Zha et al.,2003][Zhang et al.,2006], who reported that the optimal content of Gd2O3 was
lied between 7 and 10 mol%. This phenomenon is explained by the formation of defect
23
associations (or clusters), e.g., {SmCe' VO••}• and {GdCe' VO••}• . These associates
consume the vacancies and the linear relationship is no longer effective. Because of the
existence of the defect association, the mobility of associated defects is greatly reduced.
Therefore, the temperature dependence of the electrical conductivity of doped ceria
could be divided into at least two regions. In high temperature region, the energy in
lattice could overcome the binding energy of defect association and the oxygen
vacancies are free to diffuse. The activation energy (Ea) for ionic conduction is only the
migration energy (Em). In low temperature region, the activation energy is including the
binding energy of defect association (Eas) and the migration energies[Singhal et al., 2003]. A
slope transition could be found in a diagram of ln(σT) against 1/T at a critical
temperature (Tcrit). Jung[Jung et al., 2002] reported that the critical temperature was also
affected by the amount of dopant. 20SDC system could reduce its critical temperature
down to 591oC from 673oC of 5SDC system. The trend of Ea varied with doping
contents was similar with the trend of critical temperature and showed the lowest Ea
value in 20SDC system.
Originally, the substitutional defect with negative charge and oxygen vacancy with
positive charge are attracted to each other and form the defect association due to the
Coulombic force below the critical temperature. In this case, for the same charge of
24
substitutional defect (ex: monovalent GdCe' or divalent Ca ), the binding energy of Ce''
defect association and the ionic conductivity should be at a similar level no matter what
the doped ion is[Skinner et al., 2003]. However, the experimental results showed a lot
differences in conductivity for different kinds of additive treated at 800oC. The results in
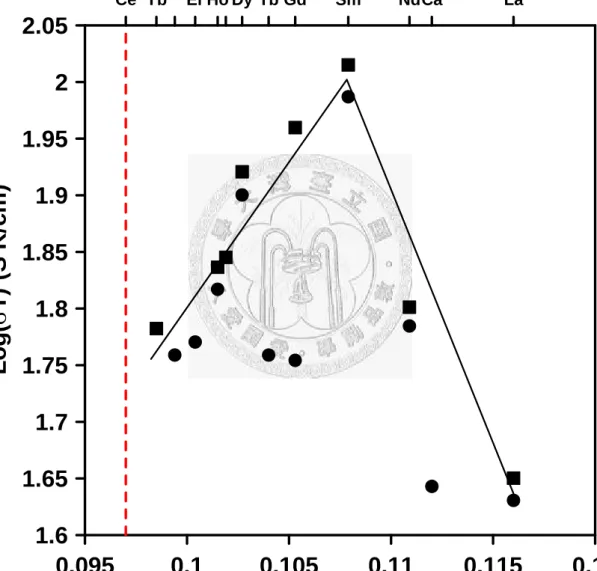
Fig. 2.6 revealed that the ionic radii of dopant ions would apparently affect the ionic
conductivity of doped ceria[Yahiro et al., 1988][Mogensen et al., 2000]. The information of ionic radii
were reported by Shannon[Shannon, 1976]. From Fig. 2.6, the ionic conductivity first
increases with the increasing of ionic radius (from 0.0985 nm of Yb3+ to 0.1079 nm of
Sm3+) until the radius reach 0.109 nm, and then decreases. In the other Yahiro’s[ Yahiro et al., 1988] work, alkaline earth ion doped ceria was investigated. The same trend was found
that calcia doped ceria showed the highest conductivity where the radius of calcium ion
is 0.112 nm. It could be concluded that for rare earth or alkaline earth oxides doped
ceria, the critical doping ionic radius which gives the highest conductivity of doped
ceria is around 0.11 nm[Inaba etal., 1996]. The reason of this phenomenon was explained by
the effect of the elastic strain energy around the substitutional defect. After aliovalent
ions doping, there is elastic strain remained in the lattice. The remained strain is resulted
from the radius mismatch of the host cation and the doping one.
In general, the highest ionic conductivity would be exhibited when the radius of
25
dopant ion is closest to the host ion, which results in the least elastic strain and the
minimal association energy between dopant ion and oxygen vacancy[Inaba etal., 1996]. Fig.
2.6, however, reveals that Sm3+ (0.1079 nm in radius) exhibits the highest electrical
conductivity. The ions such as Yb3+ (0.0985 nm), Er3+ (0.1004 nm) or Y3+ (0.1019)
which have the ionic radii closer to Ce4+ (0.097) show a lower electrical conductivity
comparing with Sm3+. The reason was provided by L. Minervini[Minervini et al., 1999].
In Minervini’s work, the binding energy of defect association was recalculated. The
association pair model was the substitutional defect to the first, second and third
neighbor oxygen vacancy. The plot of binding energy of these three association pairs
against ionic radii is shown in Fig. 2.7(a). Fig. 2.7(b) shows the schematic positions of
these oxygen vacancies in a unit cell of ceria.
In Fig. 2.7(a), the first and second neighbor lines of binding energy are associated
with different effects. Coulombic interaction between substitutional defect and vacancy
always favors the first neighbor position. Smaller ions show higher binding energy with
vacancy due to its higher charge density. On the other hand, the relaxation of lattice
(crystallographic effect) always favors the second neighbor position. The relaxation of
lattice is coming from the Ce4+ ion adjacent to the second neighbor vacancy and it’s also
related to the dopant ionic radius. The ion in this configuration could relax the attractive
26
force between positive charge vacancy and negative charge substitutional defect. These
two effects cancel each other and form an equivalent binding energy for first and second
neighbor vacancies when the dopant ionic radius is about 0.105 nm. In Fig. 2.7 (a), the
equivalent binding energy which is also the minimum value is shown in the crossover
point of the lines of first and second neighbor oxygen vacancy. Gd3+ ion has the closest
ionic radius with the position of the crossover point. The cations smaller than Gd3+
prefer to bind with the first neighbor vacancy. In contrast, the cations larger than Gd3+
have higher binding energy with the second neighbor vacancy. According to Minervini’s
work, the optimal radius of dopant ion is around 0.105 nm (close to the radii of Gd3+
and Sm3+) should have lowest binding energy of defect associate and result in the
highest ionic conductivity, which agree with the experimental results.
As mentioned above, for both rare earth and alkaline earth ions, the critical ionic
radius is around 0.11 nm that would give the highest conductivity. Therefore, Sm- and
Gd-doped ceria should have the highest ionic conductivity which was confirmed by
Balazs[Balazs et al., 1995]. However, Gd-doped ceria showed surprising low ionic
conductivity in Yahiro’s work[Yahiro et al., 1988], which was against the general trend. There
is one possible explanation for this disagreement, which will be described in next
section.
27
2.3.3 Grain Boundary/Impurity Effects
In order to reduce the grain interior resistance, Ralph et al.[Ralph et al., 1997] tried to
reduce the strains in ceria lattice by a double-doping method. The results, however,
indicated that the local lattice strain around the substitutional defect was an important
issue that affected the bulk conductivity. Therefore, GDC system still showed a higher
grain interior conductivity comparing with the Ce-Sm-Y and Ce-La-Yb systems. On the
other hand, the double-doped system performed higher grain boundary conductivity
than that of GDC system. HRTEM analysis indicated that the high resistance of grain
boundary on GDC system is resulted from the segregation of Gd and Si, which is a very
common impurity in ceramics.
The segregation of Si would lead to the formation of an insulting, glassy film at the
grain boundary, which reduce the total ionic conductivity of doped ceria. The influence
of Si to grain boundary conductivity was investigated by Zhang[Zhang et al., 2006]. The grain
boundary conductivity apparently decreased as the impurity content of Si increased
from 30 ppm to 200 ppm. Besides, the amount of Si also affects the concentration of
doped Gd2O3 that gives the highest ionic conductivity.
Moreover, Gd-rich boundary resulted in a space-charge layer at the grain boundary.
Inside the space-charger layer, the concentration of oxygen vacancies was depleted, and
28
the negative charge Gd substitutional defects would restrict the crossover of oxygen
vacancies and lead to high grain boundary resistance. The same phenomena in yttria
doped zirconia and ceria systems were reported by Guo[Guo, 1995][Guo et al., 2003].
Ralph’s work gave an explanation for the huge difference of the electrical
conductivity of GDC system mentioned in Section 2.3.2. Gd-doped ceria apparently
exhibited higher grain boundary resistance than the other systems, such as double-doped
ceria due to the segregation of Gd and impurity. For this reason, the sample preparation
procedure would be a very important issue for grain boundary conductivity.
2.3.4 Reduction Behavior of Ceria
It is well known that the main disadvantage of ceria is its reduction behavior at
high temperature and reduced atmosphere. The reduction will induce the electronic
conductivity and ceria will show an n-type conductive behavior as the reaction shown in
Eq. (2-2). The raising of electronic conductivity leads to the reduction of oxygen
transference number (ti). The value ti could be expressed as follow,
e i
i
ti
σ σ
σ
= + (2-13)
where σi is the ionic conductivity and σe is the electronic conductivity. An equation
similar with σi (Eq. (2-3)) could be used to describe σe,
29
σe = eneμe (2-14)
where e is the charge of electron, ne is the concentration of electron and μe is the
mobility of electron. The temperature dependence reductive reaction coefficient K is,
) exp(
]
[ 2 12/2 0
kT K H
P n V
K O e O −Δ
=
= •• (2-15)
where ΔH is the enthalpy difference of the reduction reaction. Therefore, the
concentration of electron is,
2 ) exp(
]) /[
( ])
/[
( 1/2 21/4 0 1/2 21/4
kT P H
V K P
V K
ne O O O O −Δ
=
= •• − •• − (2-16)
Recalling Eq. (2-2), if dopant is added into ceria, [VO••] is independent of oxygen
partial pressure because that it’s dominated by extrinsic defect. Thus, ne and σe are oxygen partial pressure dependence and proportional to 1/4
2
−
PO . Moreover, the mobility of electron is given by,
) exp( kT
E T
b e
e
= −
μ (2-17)
where b is a pre-exponential factor and Ee is activation energy of the migration of
electron. Substituting Eq. (2-16) and (2-17) into Eq. (2-14), following equation could be
obtained,
2 ) exp( 2 ]
[
4 / 1 2 / 1
2 / 1 0
kT E P H
V T
ebK e
O O
e
− Δ
= •• − −
σ (2-18)
and rewriting Eq. (2-13) with Eq. (2-18) and (2-5). A relationship between
O2
P and 1/T
could be obtained,
![Fig. 2.1 (a) Fluorite structure [Chiang et al., 1997] , CeO 2 structure of showing (b) oxygen ion and (c) cerium ion is selected as the original point, respectively](https://thumb-ap.123doks.com/thumbv2/9libinfo/9607595.633295/21.892.135.763.197.950/fluorite-structure-chiang-structure-showing-selected-original-respectively.webp)
![Fig. 2.2 Temperature depend electrical conductivities of 8YSZ [Yang et al., 2003] , 8YSZ in dry O 2 [Guo et al., 2005] , 20GDC [Sin et al., 2004] , LSGM [Ohnuki et al., 2006] and Bi 3 NbO 7 -Bi 3 YO 6 [Abrahams et al., 2006] , the dotted curve presents](https://thumb-ap.123doks.com/thumbv2/9libinfo/9607595.633295/22.892.142.753.259.857/temperature-depend-electrical-conductivities-ohnuki-abrahams-dotted-presents.webp)
![Fig. 2.7 (a) Calculated binding energy of trivalent substitutional ions to an oxygen vacancy [Minervini et al., 1999] , (b) configuration of first, second and third neighbor oxygen vacancies with respect to the substitutional trivalent ion in a unit c](https://thumb-ap.123doks.com/thumbv2/9libinfo/9607595.633295/48.892.195.692.127.1041/calculated-trivalent-substitutional-minervini-configuration-vacancies-substitutional-trivalent.webp)
![Fig. 4.4 As-prepared cerium hydrocarbonate fibrous precipitates with a [NaOH]/[C 6 H 8 O 7 ] ratio of 0.6 (sample 1) aging for (a) 12 hr and (b) 60 hr, respectively, and ratio of 0.8 (sample 15) aging for (c) 24 hr and (d) 62 hr, respectively](https://thumb-ap.123doks.com/thumbv2/9libinfo/9607595.633295/94.892.132.769.430.904/prepared-cerium-hydrocarbonate-fibrous-precipitates-sample-respectively-respectively.webp)
![HPSH [ 氧化數平衡反應式係數 ]](data:image/gif;base64,R0lGODlhAQABAIAAAP///wAAACH5BAEAAAAALAAAAAABAAEAAAICRAEAOw==)