Willingness to pay and Consumers’ behavior for certified label of organic fresh milk in Taiwan
Chin-Huang Huang
*Abstract
Food quality labels have increased food safety. The certified agricultural standards (CAS) of organic food labels recover the confidence and consumption in Taiwan. Organic label represents food quality without using synthetic chemicals that would be healthy to consumers. As a consequence, production costs haves increased, and thereby consumer prices as well. The purpose of this study aims to analyze consumers’ perception of the organic CAS purchasing behavior and willingness to pay under the condition of Fresh Milk Logo transforms into organic CAS certified label. The factor analysis is adopted to extract the perception and preference factor dimensions among respondents.
Meanwhile, the double-bounded dichotomous choice contingent valuation method (CVM) and survival analysis are used to measure the willingness to pay of consumers purchasing behavior for organic fresh milk.
Keywords: Food quality, organic food, double-bounded dichotomous choice, CVM, survival function.
JEL Classification: Q10, Q13, Q18
1. Introduction
Recently the organic food is popular throughout the world with respect to human health as well as environment preservation. The organic products consider environmentally friendly for free from pesticides and chemical residues (Childs, 1997; Zotos, Ziamou, and Tsakiridou, 1999; Fotopoulos and Krystallis, 2003). The rapid growth of organic industry has result the problems of regulation for consumer judgment including identified rules for organic production, processing, certification and labeling, which will influence the purchasing motivation and behavior. Consumers have become increasingly concern the safety of fresh good and are demanding products with particular qualities. The primary motives for consumer to purchase organic and natural products are relative to health concern (Huang, 1996).
The food safety is recognized as an important aspect for public health and
*
Assistant Professor in Department of Sport Management, National Taiwan College of Physical Education. E-
affected consumer perceptions for the demand of food products. A personal intention combines subjective norm and attitude toward performing behavior, which includes behavioral beliefs (Aakkula et al., 2005). Demand of organic foods may also emeging consumer’s attitude, motives and willingness to pay (WTP) (Thompson, 1998). Considered further of reasoned action, behavior is a function of individual’s intention, which comprises personal attitudes for performing the behavior. Furthermore, people’s attitudes are influenced by their beliefs (Ajzen, 1998), and they often prefer to buy more expensive products, for which quality is certified, rather than non-certified products (Rozan, Stenger and Willinger, 2004).
Tsakiridou, Zotos and Mattas (2006) employed dichotomous choice model to estimate WTP for organically produced products and found that consumers’
WTP were affected by the attributes of quality and food safety, and also willing to pay more for organically produced products. Consumers’ WTP are heterogeneous for different food safety and attitudes toward risk preference (Antle, 2001). Aakkula et al. (2005) illustrated the empirical results of their study that the WTP for safety food will be affected from contingent behavior (CB) based on consumer’s attitudes and beliefs. Consumers are also willing to pay premium price for organic foods, which varied significantly between consumer groups. Health is one of important attributes for consumer to select organic food (Batte et al., 2007). According to the perception of the health risk, consumers always bid for higher WTP (Rozan et al., 2004). Wan and Sun (2003) found that Vertmon consumers were willing to pay more for organic apples and milk produced locally and certified by Northeast organic Farming Association (NOFA). The purchase behavior can affect the quality of environment (Laroche, Bergeron, and Barbaro-Forleo, 2001). Consumers value organic products not only for the reason of healthy, but also for environmental friendly (Williams and Hammit, 2000, 2001). Therefore, consumers willing to pay an extra price for buying organic products are associated with the increased consciousness trend on environmental and health issue ((Laroche et al., 2001).
Fluid milk products including fresh milk, flavoured milk, and fermented milk. Fresh milk is the most important diary product in Taiwan. The value of domestic raw milk production gradually increased from US$125 million in 1991 to US$220 million in 2007. Consumers are often emphasized the preference attributes of purity and quality for purchasing fresh milk. Meanwhile, consumers also pay attention to the certified labels of products (Hsu and Lin, 2006). In 1988, province government registered Fresh Milk Logo (Figure 1) to certify fresh milk products and guarantee the ingredients of products were not altered.
In fact, the Fresh Milk Logo products only a moral regulation, haven’t any
method to inspect them whether they are really fresh milk or reconstituted milk.
In order to recover the confidence and consumption in Taiwan, the certified agricultural standards (CAS) (Figure 2) of organic food labels will be implemented to certify fresh milk quality, food safety, and preserve consumer healthy and environmental quality in 2009. The consumer preference for quality characters and food safety attributes of the organic products are consequence of certification system for production and processing. The consumers can make a judge for buying fresh milk based on the organic CAS label clearly.
The aim of this study was precisely to analyze consumers’ behavior characters for purchasing the organic fresh milk and willingness to pay under the condition of Fresh Milk Logo transforms into organic CAS label. The remainder of the study is organized as follows. In the next section conducts the contingent behavior model to show willingness to pay for changing certified label. Section 3 demonstrates empirical results. In the concluding section, the main results and implications for management are discussed to improve food quality and policy strategies.
Figure 1 Figure 2
2. The models
This study attempts to estimate the consumers’ WTP for buying CAS
organic fresh milk, and will be directly asked about their WTP in hypothetical
scenarios that under the condition of Fresh Milk Logo transforms into organic
CAS label and depict the consumer behaviors to make segmentation in Taiwan.
Because contingent behavior cannot be estimated the WTP directly by market price, that non-market method must be adopted. CVM is the stated preference approach to evaluating the organic CAS organic fresh milk. The basis of the economic valuation of CVM is changing the welfare measurement of individual decisions in terms of their WTP for buying different label of fresh milk.
Generally, CVM is conducted by asking respondents regarding their WTP for a specific good (Randall, 2002). Consequently, this study employs CVM to estimate the WTP on the certified label of fresh milk, which improving milk quality, food safety, and preserve consumer healthy.
The CVM method used involves questions with two distinct formats: open- ended and close-ended. The two formats are distinguished by whether WTP is obtained directly, or whether a discrete indicator is used, respectively. The directly obtained method measures maximal WTP for individuals, while the discrete indicator method states the range of individual WTP and deals with single or iterated questions. Bishop and Heberlein (1979) were the first to apply a close-ended questionnaire. Mitchell and Carson (1989) found that WTP is expressed as willingness or unwillingness, which can meet the purchase habit in the survey questionnaire. Cameron and James (1987) used a close-ended survey, and found fewer errors than when an open ended survey was used. Hanemann, Loomis and Kanninen (1991) further adopted a double-bounded close-ended elicitation method and found the result of parameter estimation to be superior to that of the single-bounded close-ended method. Furthermore, Carson, Wilks and Imber (1994) also found that the use of double-bounded dichotomous choice questions can yield more information than simple-bounded ones; the survival analysis function of the Weibull distribution is employed to estimate the WTP of Australian residents on the Kakadu Protection Zone. León (1996) also applied the survival analysis functions of different distributions to estimate the protection value of a natural park landscape. Kerr (2000) employed different survival functions to determine the goodness-of-fit distribution function for estimating parameters and enhancing data fitness. Moreover, Koss and Khawaja (2001) employed a double-bounded dichotomous choice model to estimate consumer WTP for improved water supply in California, and found that the monthly WTP of each resident for water shortage alleviation was US$16.92.
Willis, Powe and Garrod (2005) used a double-bounded dichotomous choice model to estimate the effectiveness of improving street illumination, with resident experience and behavior variables included in the valuation model.
Additionally, in the studies of Scarpa and Bateman (2000), and Bateman,
Langford, Andrew and Kerr (2001), the inquiry frequency was increased to three
times. Although the triple-bounded dichotomous method increased the statistical
efficiency, the improvement efficiency was less than 50% of that achieved by substituting the double-bounded method for the single-bounded one. Meanwhile, according to above discussion, this study adopts closed-ended double-bounded dichotomous choice CVM.
This study classifies improvement in food quality label under WTP.
Suppose all consumers possess a utility function, u ( x , q , g ) , where x denotes number of fresh milk consumption, q represents different label of fresh milk quality, and g represents all other goods. The expenditure function, e ( p , q , u ) is derived by minimizing expenditures subject to income constraints, such as,
g px
m , where m denotes the income, and p represents product price. WTP for organic fresh milk associated with the CAS certified label is illustrated below:
WTP e ( p , q
*, u ) e ( p , q , u ) (1)
where q
*represents the quality of fresh milk following the organic CAS certified label, and q denotes the quality of fresh milk for Fresh Milk Logo.
The double-bounded model generates interval-censored data on visitor WTP, which can be analyzed via survival analysis (Nelson, 1982; Imber, Stevenson and Wilks, 1991). The survival function is more flexible and permits various assumptions regarding parametric distributions without incurring additional costs (León, 1996). This study follows the analytical approach of Carson, Wilks and Imber (1994), and León (1996). Let M represents the maximum WTP of the individual M , where α denotes a location parameter, σ represents a scale parameter, and ε represents a random disturbance. Assuming E denotes the maximum WTP value of the individual, the probability of rejecting the offer is defined as follows:
P ( M E ) P ( E ) F ( E ) (2)
where F ( ) is the cumulative probability function of ε. The survival function is presented as follows:
( ) 1 ( ) 1 ( ) ( )
( )
E
S E M P E M P E
G E
S (3)
Equation (3) gives the probability of the answer being ‘yes’. If the first and
second answers are both “yes”, the result will be a right censored observation. If
both answers are “no”, then the resulting observation is uncensored. An interval
observation is derived for alternative answers. Let E
1represents the first price
of the bid value while E
2denotes the second price, I
i=1 indicates that the
answer of an individual to bid price E
1is yes, while I
i=0 indicates that the
answer is no, where i =1, 2. The log likelihood function of observations is
( ) log ) 1 )(
1 ( ) (
1 log
) (
) (
log ) 1 ( ) (
) (
log ) 1 ( log
2 2
1 2
2 1
2 1
1 2 1
2 2
1
F E I
E I F I
I
F E F E
I E I
E F F I
I L
(4)
3. Results
On-site samples were conducted from November to December, 2006.
During this period 600 people were asked to complete a questionnaire, and 200 samples were done in the three most populated metropolitan in Taipei, Taichung and Kaohsiung, respectively. Trained interviewers make the survey at supermarkets and convenient stores. Meanwhile, 582 complete replies were obtained, yielding a response rate of 97%.
3.1. Analysis of consumers’ preferences for purchasing fresh milk
Since the consumption preference of the consumer is quite different owing to different perception of products certified label. In this study, exploratory factor analysis method is going to be adopted to extract the major factorial dimension. The questionnaire of consumer’s perception was asked to evaluate all statements on a five-point Likert scale (1=Strongly disagree and 5=Strongly agree). Meanwhile, 16 attitudinal items are obtained after pretest.
Sixteen consumption behavior items were factor analyzed using principle component method and varimax rotation procedure to extract the set of interrelated variables into a smaller number of uncorrelated factors through the calculation of factors scores. Table 1 presents the results of factor analysis that all items of four dimensions with factor loading greater than 0.4, which indicate a reasonably high correlation between the delineated factors and individual items. Meanwhile, all factors with eigenvalues greater than 1, accounting for 60.32% of the total variance.
The first dimension was labeled as ‘Fresh Milk Logo’ attribute, which explained 32.99% of the total variance with a reliability of coefficient of 0.83.
The relatively large proportion of the total variance for that factor might be attributed to the fact that ‘Fresh Milk Logo’ is central theme of the event. The rest dimensions are ‘price/promotion’, ‘organic’, and ‘product/brand’ attributes, which explained the total variance with 13.20%, 7.58% and 6.55%, respectively.
Meanwhile, the reliability of coefficient was 0.74, 0.79 and 0.55, respectively.
Table 1 The factor analysis result of consumer perception of fresh milk
Variable Fresh Milk
Logo
Price/
promotion Organic
attributes Product/
brand Avoidance of reconstituted milk 0.74
To choice the domestic fresh milk 0.72 Pay attention to institution certify 0.65 Pay attention to product origin 0.58 Pay attention to food safety label 0.58 Pay attention to ingredient of product 0.53
Pay attention to media advertisement 0.85 Pay attention to promotion from expert
and government 0.79
Pay attention to package 0.70
Pay attention to price. 0.57
Pay attention to organic label 0.77
Pay attention to pollution of environment 0.73
Pay attention to additives 0.70
Pay attention to expiration date 0.83
Pay attention to product taste 0.58
Pay attention to product brand 0.46
Eigenvalues 5.28 2.11 1.21 1.05
Cumulative explanatory variance (%) 32.99 46.20 53.78 60.32
Reliability ( Cronbach
,s ) 0.83 0.74 0.79 0.55
3.3 Estimating WTP for organic CAS label
The questionnaire of CVM must detail the hypothetical scenarios, and may have an open-ended or close-ended format. Before the formal survey, conduct a pretest is important, which examine the questions both theoretically and empirically to determine the influence of individual bid behavior and avoid various biases.
During the pre-test interviews, respondents were asked face-to-face the following open-ended question, “Because the Fresh Milk Logo cannot inspect whether the products are really fresh milk or reconstituted milk. The CAS (certified agricultural standards) organic food labels will be implemented to certify fresh milk quality, food safety, and preserve consumer healthy and environmental quality If the Fresh Milk Logo of fresh milk were transforms into organic CAS label, how much would you be willing to pay an extra price to buy fresh milk?”
Responses obtained in the pre-test interviews indicated the likely bid range,
and the top five initial costs were identified as US$3.07, 6.15, 15.37, 30.74 and
92.22, respectively. Double-bounded dichotomous choice CVM involves asking a consumer regarding his(or her) WTP some pre-chosen and randomly assigned amount. Depending on respondent answers, the bid is lowered or raised and each individual is asked regarding the new bid. If the answer to the first closed-ended question was “yes”, the sizes of the increases (representing a rough doubling) stated in response to the follow-up question were US$6.15, 12.30, 30.74, 61.48 and 184.44, respectively. If the answer to the first close-ended question was
“no”, the sizes of the decreases (representing a rough halving) stated in response to the follow-up question were US$1.54, 3.07, 7.68, 15.37 and 46.11, respectively. This study adopted a face-to-face visitor survey.
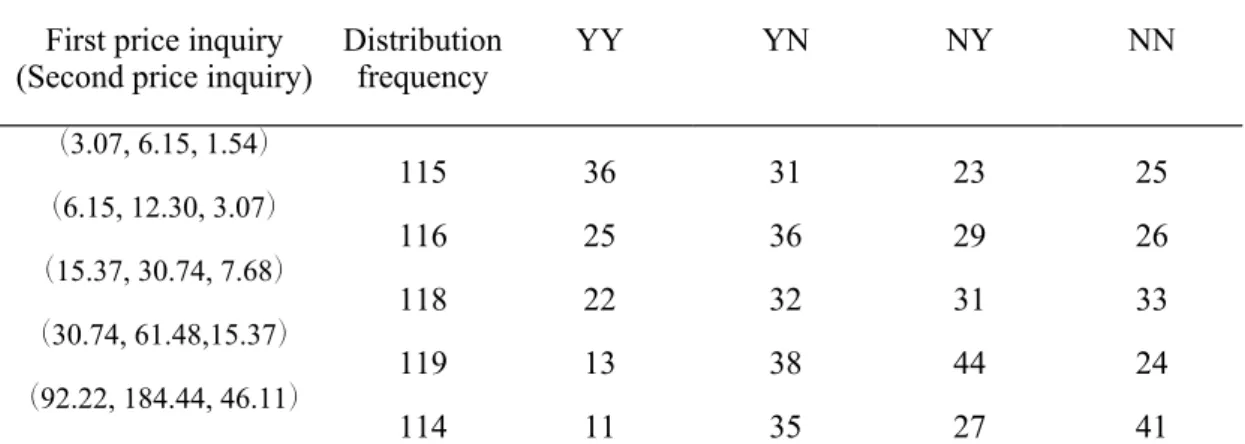
The respondents are randomly assigned a set of bid values from the list of five in Table 2. Five hundred and eighty two respondents completely responded to various bid amounts in the initial and follow-up WTP questions, with 18.38%
of respondents answering, “yes, yes”, 29.55% answering “yes, no”, 26.46%
answering “no, yes”, and 25.60% answering “no, no”.
Table 2 Frequency distribution of willingness-to-pay First price inquiry
(Second price inquiry) Distribution
frequency YY YN NY NN
(3.07, 6.15, 1.54)
115 36 31 23 25
(6.15, 12.30, 3.07)
116 25 36 29 26
(15.37, 30.74, 7.68)
118 22 32 31 33
(30.74, 61.48,15.37)
119 13 38 44 24
(92.22, 184.44, 46.11)
114 11 35 27 41
Note: The first number in parentheses is the starting WTP bid value. If the answer to the first question is “yes”, the second value is asked; if the answer is “no”, the third value is asked.
The valuation function of double-bounded model involves dichotomous
choice elicitation questions, resulting in the interval censoring of individual
subject value. The censored survey can use the survival analysis to provide a
wide parametric distribution. This study follows Stacy (1962) and obtains a
family of distributions from the generalized gamma distribution density
function, which is defined as follows:
) (
) ( exp )
) ( (
1
k
E E
E r f
r rk
(5)
where exp( ) denotes the location parameter, r 1 / represents the scale parameter, k 1 /
2is the shape parameter and denotes a Gamma function.
When r=k=1 (or 1 ), the distribution is exponential. If k=1 (or 1 ), represents a Weibull distribution, and k (or ) tends to infinity, leading to the lognormal distribution.
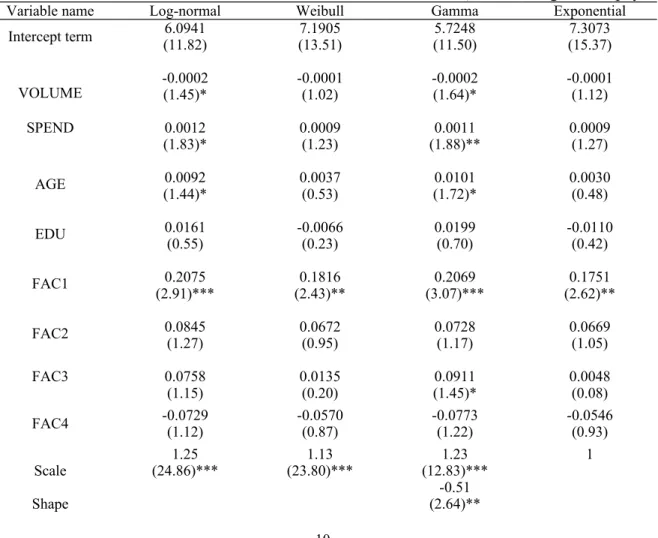
The valuation function employs lognormal, Weibull, Gamma and exponential distributions to explain respondent WTP using double-bounded data. Table 3 lists the variable introduction and descriptive statistics, explanatory variables included VOLME represents the volume of fresh milk consumer bought, SPEND denotes the money of consumer spent on fresh milk. AGE denotes the age of consumer. EDU represents the education years of consumer. FAC1, FAC2, FAC3 and FAC4 are factor score, which represents the dimensions of
‘Fresh Milk Logo’, ‘price/promotion’, ‘organic’, and ‘product/brand’ attributes.
Table 3 Definition of the variables and descriptive statistics
Variables name Definition Mean Std. Dev.
VOLUME The volume of fresh milk consumer bought. 689 cc 580 cc SPEND The expenditure of consumer spent on fresh milk. 2.95 USD 2.80 USD
AGE The age of consumer. 29.79 year 11.09 year
EDU The education years of consumer. 14.86 year 2.30 year FAC1 The factor score of ‘Fresh Milk Logo’ attributes. - -
FAC2 The factor score of ‘price/promotion’ attributes. - -
FAC3 The factor score of ‘organic’ attributes. - -
FAC4 The factor score of ‘product/brand’ attributes. - -
Survival valuation functions employed a likelihood ratio to test the goodness-of-fit of four survival evaluation models. In Table 4, only the Gamma evaluation model was differed significantly from 0 at the significance level of 0.05, which means the null hypothesis of all variables equaling to zero was rejected. However, the shape parameter and scale of the generalized Gamma distribution provides the Gamma distribution as the best representation of the empirical data.
In the Gamma distribution evaluation model, VOLUME, SPEND, AGE,
FAC1 and FAC3 variables are differ significantly from 0 at α=0.1. The
empirical results demonstrate that consumers who consume more qualities of
fresh milk have lower WTP for purchasing CAS organic fresh milk. While the
WTP increase with more expenditure on fresh milk. The positive effect for age
indicates that consumers with a higher age are more willing to pay an extra price to buy organic fresh milk. Meanwhile, consumers’ attitudes toward the perception of ‘Fresh Milk Logo’ and ‘organic’ attributes are willing to pay an extra price for buying fresh milk with CAS organic label.
The survival valuation function of the lognormal model estimated respondent willingness to pay by median indicator. The advantages of measuring welfare by median are that it not only eliminates extreme observations, but also has above mean sensitivity to specific distribution (León, 1996). Additionally, Cooper, Hanemann and Signorello (2002) compared the confidence interval for the double-bounded model, and demonstrated that mean WTP is more biased than median WTP with regard to the follow-up responses.
This study thus adopts median WTP, and can be calculated by