MECHANISM OF TWO-PHOTON FLUORESCENCE INCREMENT VIA
CROSSLINKED BOVINE SERUM ALBUMIN
C.-Y. Lin,
aC.-H. Lien,
aC.-Y. Chang,
band S.-J. Chen
a,*a
Department of Engineering Science, National Cheng Kung University, Tainan 701, Taiwan
b
Department of Photonics, National Cheng Kung University, Tainan 701, Taiwan
ABSTRACT
The two-photon excited fluorescence (TPEF) increments of two dyes via bovine serum albumin (BSA) microstructures fabricated by the two-photon crosslinking technique were investigated. One is Rose Bengal (RB) with a high non-radiative decay rate, while the other is Eosin Y with a low non-non-radiative decay rate. Experimental results demonstrate that the quantum yield and lifetime of RB are both augmented via crosslinked BSA microstructures. Compared with theoretical analysis, this result indicates that the non-radiative decay rate of RB is decreased; hence, the quenched effect induced by BSA solution is suppressed. However, the fluorescence lifetime of Eosin Y is acutely abated despite the augmented quantum yield for the two-photon crosslinking processing from BSA solution. This result deduces that the radiative decay rate increased. Furthermore, the increased TPEF intensity and lifetime of RB correlated with the concentration of fabricated crosslinked BSA microstructures through pulse selection of the employed femtosecond laser is demonstrated and capable of developing a zone-plate-like BSA microstructure.
Keywords: two-photon, fluorescence increment, bovine serum albumin, multiphoton microfabrication.
1. INTRODUCTION
Since multiphoton excited (MPE) photochemistry is confined to the focal volume, spatially-precise, sub-micron microstructures can be created three dimensionally (3D) [1-5]. In MPE photochemistry, Rose Bengal (RB) is utilized as the photoinitiator in two-photon polymerization (TPP) processing and the photoactivator in two-photon crosslinking (TPC) processing [6] to develop 3D microstructures of ethoxylated trimethylolpropane triacrylate (ethoxylated TMPTA) and bovine serum albumin (BSA), respectively. Also, RB is used as a chromophoric dye for two-photon excited fluorescence (TPEF) [7]. The TPEF of RB was significantly increased in crosslinked BSA microstructures but reduced in polymerized TMPTA microstructures [7]. This seems to be an augmentation mechanism for TPEF of RB via crosslinked BSA microstructures. TPEF is a nonlinear phenomenon and its intensity is proportional to the two-photon absorption (TPA) cross-section, square of excitation power, and fluorescence quantum yield [8]. Generally speaking, the intensity of TPEF is very weak, which results from the extremely low TPA cross-section. As such, enhancement of the TPEF signal has generated interest and led to several techniques that increase its intensity. Two such techniques include the enhancement of localized excitation power and the modification of the intrinsic characteristics of the fluorescent dye by increasing the TPA cross-section and fluorescence quantum yield. For instance, the periodic structures, based on waveguide resonance, were used to enhance localized excitation power 120 times [9], while designed organic molecules, based on symmetric charge transfer, can enlarge the TPA cross-section 400 times [10].
In this study, the TPEF increments of two dyes via BSA microstructures fabricated by the two-photon crosslinking technique were investigated. One is RB with a high radiative decay rate, while the other is Eosin Y with a low non-radiative decay rate. TPEF increments are due to enlargements of their quantum yields and can be confirmed from the variations of their fluorescence lifetimes. Experimental results demonstrate that the quantum yield and lifetime of RB are both augmented via crosslinked BSA microstructures resulting from reducing the non-radiative decay rate and suppressing the quenched effect induced by the BSA solution. For Eosin Y, the fluorescence lifetime is acutely abated despite the augmented quantum yield, which indicates that the radiative decay rate is increased. Both simulation and experimental results confirm that a fluorescent dye with a high non-radiative decay rate, such as RB, has a large TPEF augmentation. Furthermore, the concentration of crosslinked BSA can be modified by controlling the pulse number of the employed femtosecond laser. A zone-plate-like microstructure as a function of the concentration of crosslinked BSA correlating with the TPEF intensity and lifetime of RB was developed.
__________________________________
2. THEORETICAL ANALYSIS
A. Quantum Yield Proportional to Variation of TPEF Intensity
Investigation of the fluorescent dye TPEF increment relative to its quantum yield enlargement requires that the quantum yield and TPEF intensity are connected. The TPEF intensity is proportional to the square of excitation power. The time-averaged fluorescence F can be expressed as [8]
2 , p P F C Q f (1)where P is the excitation power of the employed femtosecond laser, τp the pulse width, and f the pulse repetition rate.
Further, σ(λ) is the TPA cross-section of fluorescent dye, C the concentration, and Q the fluorescence quantum yield. Eq. (1) can be modified as the slope S of the differentiation of the TPEF intensity divided by the differentiation of the square of the excitation power. The slope S is then proportional to the quantum yield as
2 1 . p F S C Q P f (2) To evaluate the fluorescence quantum yield according to the measured TPEF intensity and the standard of the quantum yield under same femtosecond laser excitation condition, an estimated quantum yield Q can be calculated by, r r r r Q S S C C Q (3)
where r denotes the fluorescence standard.
Verification of this theoretical model involved dissolving the same concentration (100 μM) of Rhodamine 6G (R6G) and B (RhB) in deionized water. The TPA cross-section of RhB has been found to be two times greater than that of R6G [11-13]. Experimental results also show that the slope of R6G is roughly two times greater than that of RhB. Herein, the R6G solution is taken as the fluorescence standard with a fluorescence quantum yield of 0.95 [13]. From the theoretical model analysis, the fluorescence quantum yield of RhB is evaluated to be 0.24, which closely matches previous research [13-15]. Therefore, the theoretical model based on Eq. (3) can be adopted to evaluate the fluorescence quantum yield and elucidate the relationship between the quantum yield and TPEF intensity.
B. Quantum Yield and Lifetime Based on Radiative and Non-radiative Decay Rates
Fluorescence quantum yield and lifetime are both major parameters when investigating the emission characteristics of fluorescent dyes in diverse environments. Fluorescence quantum yields are usually the ratio of the emitted photons to the absorbed photons. The quantum yield Q is also described by electron decay rates and can be expressed as [16]
, k Q (4) where Γ is the radiative decay rate and k is the non-radiative decay rate. When the non-radiative decay rate is smaller than the radiative decay rate, the quantum yield approaches unity. On the other hand, the quantum yield moves toward zero if the non-radiative decay rate is greater than the radiative decay rate. Fluorescence lifetime is usually defined as the average time required for an electron in the excited state to decay to the ground state. The fluorescence lifetime τ can be also relative to the decay rates and described as [16]
1 .
k
(5) The quantum yield enlarges with an increase in the radiative decay rate or a decrease in the non-radiative decay rate. However, the lifetime lengthens when decreasing either the radiative or non-radiative decay rate. Hence, increasing the radiative decay rate leads to an increase of the fluorescence quantum yield and a decrease in its lifetime. Consequently, increasing the non-radiative decay rate results in decreases of both the fluorescence quantum yield and lifetime.
lifetime. RB has a very low quantum yield of 0.01 and a short lifetime of 80 ps in deionized water [17]; by comparison, Eosin Y has a higher quantum yield of 0.2 and a longer lifetime of 0.95 ns in deionized water [18]. The original
radiative and non-radiative decay rates of RB are 1.25×10⁸ s-1 and 1.24×10¹⁰ s-1, respectively. As can be seen, the
non-radiative decay rate is two orders higher than the non-radiative decay rate. On the other hand, the original non-radiative decay
rate of Eosin Y is 2.11×10⁸ s-1, which is close to the non-radiative decay rate of 8.42×10⁸ s-1. As a consequence of a
fluorescent dye with a relatively large non-radiative decay rate such as RB, variations in the quantum yield and lifetime are dominated by the changes of the non-radiative decay rate. Alternatively, the quantum yield and lifetime of Eosin Y are both affected by the radiative and non-radiative decay rates; however, the quantum yield of which does not apparently change under the radiative and non-radiative decay rates. Hence, the increment of TPEF intensity can be observed for fluorescent dyes with low quantum yields. For example, the TPEF intensity of RB can be maximally increased by up to 100 times compared to that in solution.
3. MICROFABRICATION SETUP AND EXPERIMENTAL RESULTS
A. Sample Preparation and Optical Setup
The reactive monomer material was BSA. The first of two prepared solutions was mixed with the photoactivator of RB (Avocado Research Chemicals, UK) at a concentration of 2.0 mM and BSA (Sigma-Aldrich, USA) with a concentration of 20 mg/ml in deionized water. The second consisted of the photoactivator of Eosin Y (Sigma-Aldrich, USA) at a concentration of 4.0 mM and BSA (Sigma-Aldrich, USA) with a concentration of 50 mg/ml in deionized water. In our previous TPA spectrum measurement experiment, it was found that the fabrication wavelength corresponding to the maximum value of the relative TPA of RB is between 710 and 720 nm [19]; therefore, a laser wavelength of approximately 720 nm was adopted. For Eosin Y, the laser wavelength was also fixed at 720 nm, but the fabrication power must be higher than that of RB due to Eosin Y’s lower TPC efficiency. These fabrication solutions were confined in a small chamber created using a 100 μm-thick spacer to separate a cover slip and microscope slide.
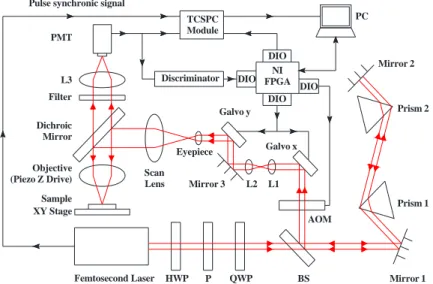
Figure 1 shows the schematic of the femtosecond laser fabrication system and how it is combined with the fluorescence lifetime imaging microscopy (FLIM) based on a time-correlated single photon counting (TCSPC) module. Key components of our instrument/microscope include a femtosecond, titanium-sapphire (ti-sa) laser (Tsunami, Spectra-Physics, USA) with a pulse width of less than 100 fs and a repetition rate of 80 MHz, an inverted optical microscope (Axiovert 200, Zeiss, Germany), a galvanometer x-y scanner (6215H, Cambridge, USA), a triple-axis
sample-positioning stage (ProScanTMII, Prior, UK), a z-axis piezoelectric nano-positioning stage (Nano-F100, Mad City
Labs, USA), an acousto-optic modulator (AOM) (23080-x-1.06-LTD, Neos, USA), photomultiplier tubes (PMTs) (H5783P, Hamamatsu, Japan), and a data acquisition (DAQ) card with a field-programmable gate array (FPGA) module (PCI-7831R, National Instruments, USA). A detailed description of the multiphoton fabrication instrument can be found in our previous studies [7,19]. For FLIM, the TCSPC module (PicoHarp 300, PicoQuant) is integrated into the main
Sample XY Stage Objective (Piezo Z Drive) Filter PMT L3 Galvo x Mirror 3 Galvo y Dichroic Mirror L1 L2 Eyepiece Scan Lens AOM P HWP BS
Femtosecond Laser QWP Mirror 1
Mirror 2 Prism 2 Prism 1 TCSPC Module Discriminator DIO DIO DIO NI FPGA DIO PC Pulse synchronic signal
control platform based on LabVIEW programming, which triggers the synchronic signal via the FPGA module, collects the fluorescence time-to-digital data via a USB 2.0 interface, and then constructs the fluorescence lifetime image via a PC. The time-to-digital data of different pixels is separated by inserting a marker via the main control platform. To facilitate 3D lifetime image and data analysis, the LabVIEW program also records the scanning parameters corresponding to the time-to-digital data. The timer overflow signal of the TCSPC is removed, allowing the accumulated time-to-digital data of each pixel to be programmed as a corresponding histogram. Nonlinear least square algorithms are used to fit the fluorescence lifetime decay curve for each pixel [20]. Based on the fitting lifetime data of each pixel and the pixel scanning information, the FLIM image can be displayed with a resolution of 0.1 ns under the main control platform.
B. Experiment Results for Fluorescent Dyes with Low and High Quantum Yields
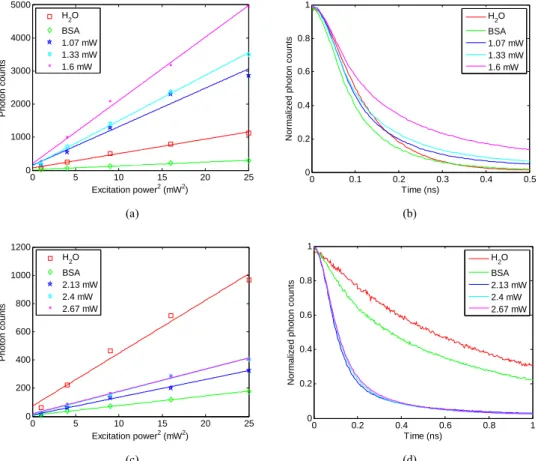
Figure 2 shows the variations of the TPEF intensities as a function of the square of excitation power and the fluorescence intensity decay curves of RB and Eosin Y in deionized water, BSA solution, and crosslinked BSA microstructures with three fabrication powers, respectively. The slope of the measured line indicates the relative value of the quantum yield (see Eq. (2)), as shown in Figs. 2(a) & (c) for RB and Eosin Y, respectively. In lieu of exact lifetime values, fluorescence intensity decay curves are adopted to show relative proportions or lifetime variation trends due to the lifetime variations of the employed dyes near the 0.1 ns resolution of our FLIM instrument, as shown in Figs. 2(b) & (d) for RB and Eosin Y, respectively. In the lifetime experiments, the excitation power was decreased to 0.5 mW and hence a further TPC processing can be avoided. Based on our previous study [21], the florescent intensity does not decay and reveals no photobleaching at the power of 0.5 mW even with long-term exposure. The fluorescence intensity decay curve on the left indicates a relatively low lifetime, while on the right, it shows a relatively high lifetime. Herein, the TPA cross-sections were assumed to be the same, with the concentrations mentioned in Sec. 3.1 maintained under the different conditions. In Figs. 2(a) & (b), the quantum yield and lifetime of RB in the BSA solution are both smaller
0 5 10 15 20 25 0 1000 2000 3000 4000 5000 Excitation power2 (mW2) P h ot o n c o un ts H 2O BSA 1.07 mW 1.33 mW 1.6 mW 0 0.1 0.2 0.3 0.4 0.5 0 0.2 0.4 0.6 0.8 1 Time (ns) N o rm alized ph oto n co unt s H2O BSA 1.07 mW 1.33 mW 1.6 mW (a) (b) 0 5 10 15 20 25 0 200 400 600 800 1000 1200 Excitation power2 (mW2) Photon coun ts H 2O BSA 2.13 mW 2.4 mW 2.67 mW 0 0.2 0.4 0.6 0.8 1 0 0.2 0.4 0.6 0.8 1 Time (ns) Nor m ali z ed p hoton co unts H 2O BSA 2.13 mW 2.4 mW 2.67 mW (c) (d)
Fig. 2. (a) Relative quantum yields and (b) lifetime decay curves of RB in deionized water, BSA solution, and crosslinked BSA microstructures with three fabrication powers, respectively. (c) Relative quantum yields and (d) lifetime decay curves of Eosin Y. Herein, relative quantum yield is proportional to the slope of the differentiation of TPEF intensity over the differentiation of the square of excitation power.
than those in deionized water. Hence, the fluorescent dye is quenched by the BSA molecule, leading to the estimated non-radiative decay rate being enlarged. The relative values of the quantum yield based on the quantity in deionized water are 0.26, 2.67, 3.15, and 4.39 for the BSA solution, and for the crosslinked BSA microstructures with the fabrication powers of 1.07, 1.33, and 1.60 mW, respectively. The lifetimes are also increased; therefore, the quenched effect is dramatically decreased resulting from attrition of the non-radiative decay rate when the BSA molecules are crosslinked. The fluorescence quantum yield and lifetime are both gradually increased as the fabrication power is increased. Compared with the quantum yield in the BSA solution, the quantum yields in the crosslinked BSA microstructures can be enhanced at least 10 times.
In comparison, the fluorescence quantum yield and lifetime of Eosin Y are both diminished in the BSA solution in deionized water (see Figs. 2(c) & (d)); hence, Eosin Y is quenched by the BSA molecule. This indicates that the non-radiative decay rate of Eosin Y is increased at this moment, and so the quenching effect is augmented for both RB and Eosin Y in the BSA solution. Nevertheless, the quantum yield increases and the lifetime decreases when BSA is crosslinked, as shown in Figs. 2(c) & (d), which implies that the radiative decay rate of Eosin Y is enlarged by BSA TPC processing. This is not, however, the same result as RB. The quantum yield and lifetime are both increased when the fabrication power is increased. The phenomenon is due to the reduction of the non-radiative decay rate in crosslinked BSA. The relative values of the quantum yield based on the quantity in deionized water are 0.18, 0.34, 0.42, and 0.42 for the BSA solution, and for the crosslinked BSA microstructures with the fabrication powers of 2.13, 2.40, and 2.67 mW, respectively. Compared with Eosin Y in the BSA solution, the highest quantum yield increment in the crosslinked BSA microstructures is only 2.3 times. Overall, the experimental results demonstrate that the quantum yields and lifetimes of RB and Eosin Y in the crosslinked BSA microstructures are increased due to the reduction of the quenching effect resulting from decreasing the non-radiative decay rate, particularly under high fabrication power.
C. Lifetime Imaging for RB in Crosslinked BSA Microstructures
The TPEF intensity of RB in the prepared crosslinked BSA microstructures is strongly related to fabrication parameters including laser dose, laser power, and the concentration of BSA solution, all of which alter the fluorescence quenching level via manipulation of the concentration of crosslinked BSA microstructures. In our previous study [7], the concentration of the fabricated BSA microstructures was easier to manipulate by selecting the pulse number of the femtosecond laser under the same laser power and BSA solution concentration. With the addition of Sec. 3.2, the TPEF intensities (i.e. relative quantum yields) and lifetimes of RB correlated with the concentrations of fabricated crosslinked BSA microstructures could be demonstrated via the pulse selection of the employed femtosecond laser. Fig. 3(a) shows
that a designed pattern of 4×4 squares (4×4 μm2) can be fabricated with BSA microstructures at the same laser power of
1.7 mW and BSA solution concentration of 20 mg/ml under different pulse selections. Herein, the scan rate for each pixel is fixed at 1 kHz. The pulse duty cycles move from 100% (80,000 pulses for the 1 kHz scan rate at the repetition rate of 80 MHz) at the upper left-hand corner down to 6.25% (5,000 pulses) at the lower right-hand corner with a sequentially decreasing interval of 6.25%. Fig. 3(b) shows that the designed BSA microstructure can be completely fabricated at a pulse duty cycle greater than 50%, while the TPEF intensity gradually weakens with reduced pulse numbers. The relative fluorescence lifetime image of the crosslinked BSA microstructures is shown in Fig. 3(c). Red color indicates a longer fluorescence lifetime (around 0.18 ns) with shorter ones (around 60 ps) represented by blue. Fluorescence lifetimes shorten with lower pulse numbers, a trend similar to TPEF intensities. In addition, the TPEF intensity and fluorescence lifetime have obvious variations when the pulse duty cycles are between 75% and 50%.
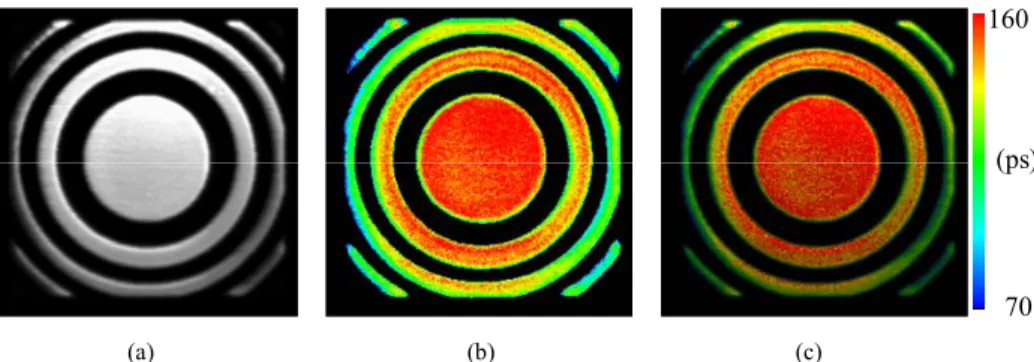
Figure 4 shows a zone-plate-like BSA crosslinked microstructure that was fabricated by modulating pulse numbers. Pulse numbers were 60,000 (75%), 51,200, 44,000 and 40,000 (50%) pulses for the zero-order, first-order, second-order, and third-order, sequentially. The radiuses of the concentric circles from the inside to the outside are 6.89, 9.74, 11.93, 13.78, 15.4, 16.87, and 18.23 μm, respectively. The average TPEF intensities are around 2,670, 3,970, 5,380, and 7,400 photon counts in Fig. 4(a), while Fig. 4(b) indicates average fluorescence lifetimes of about 100, 120, 140, and 160 ps for the third-order, second-order, first-order, and zero-order, respectively. The average TPEF intensity of RB measures only about 40 photon counts in BSA solution, it is significantly increased via the crosslinked BSA microstructure, the increment of which can reach well over 60 times. Obviously, the TPEF intensity and fluorescence lifetime are both increased with increasing pulse numbers, which also results in increasing the concentration of the crosslinked BSA. Therefore, the quenching effect gradually decreases according to the reduction in the non-radiative decay rate. Fig. 4(c) shows an image of the zone-plate-like BSA microstructure based on a combination of the TPEF intensity and fluorescence lifetime. Colors denote the different fluorescence lifetimes, while brightness indicates the TPEF intensity.
60 180
(ps)
(a) (b) (c)
Fig. 3. Images of TPEF intensity and fluorescence lifetime of RB in crosslinked BSA microstructures fabricated by selecting the pulse number of femtosecond laser: (a) design pattern of 4×4 squares, (b) TPEF intensity, and (c) fluorescence lifetime.
70
160
(ps)
(a) (b) (c)
Fig. 4. Images of zone-plate-like BSA microstructure fabricated by the four pulse numbers of 60,000, 51,200, 44,000, and 40,000 from inside to outside: (a) TPEF intensity, (b) fluorescence lifetime, and (c) combination of (a) & (b).
4. CONCLUSIONS
The TPEF intensity (i.e. the quantum yield) of RB is augmented via crosslinked BSA microstructures due to a reduction in the quenching effect. Therefore, increments in the fluorescence lifetime are observed while non-radiative decay rates decrease. However, the fluorescence lifetime of Eosin Y is acutely abated despite the augmented quantum yield for TPC processing from the BSA solution, which implies that the radiative decay rate is increased. Theoretical analysis and experimental results both reveal that the TPEF intensity of low quantum yield fluorescent dye can have large increments induced via crosslinked BSA microstructures. Compared with the TPEF intensity of RB in BSA solution, a maximal increment of 180 times can be achieved via the crosslinked BSA microstructures. The increased TPEF intensity and lifetime of RB correlated with the concentration of crosslinked BSA microstructures through modulation of the femtosecond laser pulse number is demonstrated and capable of developing a zone-plate-like BSA microstructure.
ACKNOWLEDGMENTS
This work was supported by the National Science Council (NSC) in Taiwan with the grant numbers of NSC 99-2627-B-006-017, NSC 99-3111-B-006-004, and NSC 100-2623-E-006-016-D.
REFERENCES
[1] S. Kawata, H. B. Sun, T. Tanaka, and K. Takada, “Finer features for functional microdevices,” Nature 412, 697-698 (2001).
[2] P. Galajda and P. Ormos, “Complex micromachines produced and driven by light,” Appl. Phys. Lett. 78, 249-251 (2001).
[3] T. Tanaka, H. B. Sun, and S. Kawata, “Rapid sub-diffraction-limit laser micro/nanoprocessing in a threshold material system,” Appl. Phys. Lett. 80, 312-314 (2002).
[4] M. Miwa, S. Juodkazis, T. Kawakami, S. Matsuo, and H. Misawa, “Femtosecond two-photon stereo-lithography,” Appl. Phys. A: Mater. Sci. Process. 73, 561-566 (2001).
73-76 (1990).
[6] D. C. Neckers, “Rose Bengal,” J. Photochem. Photobiol. A 47, 1-29 (1989).
[7] K.-C. Cho, C.-H. Lien, C.-Y. Lin, C.-Y. Chang, L. L. H. Huang, P. J. Campagnola, C. Y. Dong, and S.-J. Chen, “Enhanced two-photon excited fluorescence in three-dimensionally crosslinked bovine serum albumin microstructures,” Opt. Express 19, 11732-11739 (2011).
[8] C. Xu and W. W. Webb, “Measurement of two-photon excitation cross sections of molecular fluorophores with data from 690 to 1050 nm,” J. Opt. Soc. Am. B 13, 481-491 (1996).
[9] J. Y. Ye, M. Ishikawa, Y. Yamane, N. Tsurumachi, and H. Nakatsuka, “Enhancement of two-photon excited fluorescence using one-dimensional photonic crystals,” Appl. Phys. Lett. 75, 3605-3607 (1999).
[10] M. Albota, D. Beljonne, J. L. Bredas, J. E. Ehrlich, J. Y. Fu, A. Heikal, S. E. Hess, T. Kogej, M. D. Levin, S. R. Marder, D. McCord-Maughon, J. W. Perry, H. Rockel, M. Rumi, G. Subramaniam, W. W. Webb, X. L. Wu, and C. Xu, “Design of organic molecules with large two-photon absorption cross sections,” Science 281, 1653-1656 (1998).
[11] M. Kauert, P. C. Stoller, M. Frenz, and J. Ricka, “Absolute measurement of molecular two-photon absorption cross-sections using a fluorescence saturation technique,” Opt. Express 14, 8434-8447 (2006).
[12] N. S. Makarov, M. Drobizhev, and A. Rebane, “Two-photon absorption standards in the 550-1600 nm excitation wavelength range,” Opt. Express 16, 4029-4047 (2008).
[13] A. Nag and D. Goswami, “Solvent effect on two-photon absorption and fluorescence of rhodamine dyes,” J. Photochem. Photonbiol. A 206, 188-197 (2009).
[14] C. V. Bindhu, S. S. Harilal, G. K. Varier, R. C. Issac, V. P. N. Nampoori, and C. P. G. Vallabhan, “Measurement of the absolute fluorescence quantum yield of rhodamine B solution using a dual-beam thermal lens technique,” J. Phys. D 29, 1074-1079 (1996).
[15] C. V. Bindhu and S. S. Harilal, “Effect of the excitation source on the quantum-yield measurements of rhodamine B laser dye studied using thermal-lens technique,” Anal. Sci. 17, 141-144 (2001).
[16] J. R. Lakowicz, Principles of Fluorescence Spectroscopy, 3rd Edition (Springer, 2010).
[17] M. A. Montenegro, M. A. Nazareno, E. N. Durantini, and C. D. Borsarelli, “Singlet molecular oxygen quenching ability of carotenoids in a reverse-micelle membrane mimetic system,” Photochem. Photonbiol. 75, 353-361 (2002).
[18] A. Penzkofer, A. Beidoun, and M. Daiber, “Intersystem-crossing and excited-state absorption in eosin Y solutions determined by picosecond double pulse transient absorption measurements,” J. Lumin. 51, 297-314 (1992). [19] W.-S. Kuo, C.-H. Lien, K.-C. Cho, C.-Y. Chang, C.-Y. Lin, L. L. H. Huang, P. J. Campagnola, C. Y. Dong, and
S.-J. Chen, “Multiphoton fabrication of freeform polymer microstructures with gold nanorods,” Opt. Express 18, 27550-27559 (2010).
[20] M. Peter, S. M. Ameer-Beg, M. K. Y. Hughes, M. D. Keppler, S. Prag, M. Marsh, B. Vojnovic, and T. Ng, “Multiphoton-FLIM quantification of the EGFP-mRFP1 FRET pair for localization of membrane receptor-kinase interactions,” Biophys. J. 88, 1224-1237 (2005).
[21] L.-C. Cheng, C.-Y. Chang, C.-Y. Lin, K.-C. Cho, W.-C. Yen, N.-S. Chang, C. Xu, C. Y. Dong, and S.-J. Chen, “Spatiotemporal focusing-based widefield multiphoton microscopy for fast optical sectioning,” Opt. Express 20, 8939-8948 (2012).