Damascene process simulation using molecular dynamics
Shin-Pon Ju and Cheng-I Wenga)
Department of Mechanical Engineering, National Cheng Kung University, Tainan, Taiwan 701, Republic of China
Chi-Chuan Hwang
Department of Engineering Science, National Cheng Kung University, Tainan, Taiwan 701, Republic of China
共Received 11 April 2002; accepted 16 September 2002兲
This article uses a molecular dynamics parallel computing technique to investigate trench filling in the damascene process. The qualitative behavior of the trench filling process for different incident energies and substrate temperatures is described in terms of the filling morphology and the filling characteristics. The significance of the geometric size of the simulation model is evaluated by comparing the coverage percentage results obtained from the current large model with the results presented previously for a small model. Similar filling characteristics are identified for both simulation models. This indicates that the qualitative behavior is independent of the model size. However, a quantitative comparison shows that when the incident energy is small, or when the substrate temperature is high, the geometric dimensions of the model become significant. Finally, the results demonstrate that the nature of the relationship between coverage percentage improvement and incident energy is dependent on the model size. © 2002 American Institute of
Physics. 关DOI: 10.1063/1.1519947兴 I. INTRODUCTION
The shrinking size of semiconductor devices presents in-creasing difficulties in performing the physical observation and controls necessary to ensure that such devices conform to their requirements. Fortunately, however, the development of computer simulation methods has gone some way towards overcoming this problem. As shown in Fig. 1, the damascene process1,2 involves filling a trench etched into a dialectical material. The trench is then used as a conducting wire within the semiconductor device. Nowadays, the typical length of these wires may be as short as 130 nm, and therefore tradi-tional continuum approaches are inappropriate for modeling purposes. Since the particle effect becomes more significant at such small characteristic sizes, a particle-based method such as molecular dynamics共MD兲 simulation is a more ap-propriate choice.
Previously, continuum and particle-based molecular dy-namics approaches have both been used in the investigation of trench filling in the damascene process. One of the most frequently adopted continuum methods was the shock-tracking algorithm,3,4which was first developed by Hamagu-chi and Rossnagel in order to study the filling profile evolu-tion for the ion physical vapor deposievolu-tion process. However, a drawback of this method is that several parameters which directly influence the accuracy of the filling morphology must be obtained separately from empirical analysis or from simple theoretical analysis. The MD approach offers the ad-vantage that these parameters, which concern the reflection of incident atoms or the sticking of deposited atoms, may be modeled directly within the simulation. Although MD
simu-lation of the damascene trench filling process provides a valuable understanding of the detailed mechanisms which occur at the evolution interface, a literature review reveals a comparative lack of related research.5,6Furthermore, a valid criticism of the available material is that the geometric di-mensions of the simulation trench models are far smaller than those actually used in practice, e.g., some former re-search studies adopted a 2 nm model whereas the actual characteristic length is closer to 130 nm. The precise quan-titative influence of model size on the simulation results has never been fully determined. Accordingly, it is the aim of this current study to investigate this relationship. In order to en-large the simulation system sufficiently that the influence of model size may be fully understood, it is necessary to adopt a parallel computing approach.
Although parallel computing techniques have been de-veloped for a variety of computer simulation activities, in-cluding MD simulation,7–11to the best of the current authors’ knowledge, they have seldom found use in the investigation of the damascene trench filling process. A significant feature of this process is that the total number of atoms within the system increases continuously. Since most parallel comput-ing algorithms developed previously only consider a fixed number of atoms, they are clearly inappropriate for modeling this process. Furthermore, these algorithms seldom incorpo-rate the MD tight-binding potential.12–15 Utilization of this potential is advantageous, however, since it yields more ac-curate predictions of certain material properties of transition metals with a d-band structure.12,13
The present study uses an MD parallel computing tech-nique to simulate trench filling in the damascene process. The coverage percentage results obtained using the current large trench model are compared to those presented previ-ously for a small model.6The parallel computing algorithm
a兲Author to whom correspondence should be addressed; electronic mail: [email protected]
JOURNAL OF APPLIED PHYSICS VOLUME 92, NUMBER 12 15 DECEMBER 2002
7062
is modified to accommodate the continuously increasing number of atoms within the system. Furthermore, since a transition metal occurs in the region of the Ti barrier layer and the deposited Cu atoms, the tight-binding potential method is incorporated to simulate the interatomic forces between the Ti–Ti, Cu–Cu and Ti–Cu atoms.
II. SIMULATION MODEL
The simulation model includes two basic elements:共1兲 a trench comprising Ti layers, thermal control layers and a fixed layer, and共2兲 a set of functions which simulate a ran-dom spatial and angular deposition of the Cu atoms. The current simulation improves upon the previous small model6 through the addition of ‘‘trench wings’’ on either side of the trench opening, and through the incorporation of several fea-tures required to support the parallel computing technique. It
is noted that the current article only presents the new features of the simulation model. However, interested readers are in-vited to refer to Ref. 6 for a more comprehensive description of the model.
A. Trench and deposition models
A schematic diagram of the sputter trench filling process and the simplified three-dimensional trench model are shown in Figs. 1共a兲 and 1共b兲, respectively. Prior to the deposition of Cu atoms, it is assumed that the trench surface is first cov-ered by a uniform Ti barrier layer, as indicated by the black dots in Fig. 1共b兲. The layers beneath this film are used to control the thermal state of the barrier layer, and are referred to hereafter as the ‘‘thermal layer.’’ Due to the inherent com-putational limitations of MD simulation, the deposition rate adopted in the current investigation is far higher than the
FIG. 1. 共a兲 Schematic diagram of damascene process and共b兲 simplified model used in MD simulation.
deposition rate generally employed in practice. In order to preserve the validity of the results, the simulation assumes that the incident energy transfer takes place rapidly, and that the substrate atoms attain their equilibrium state very quickly. This assumption is implemented by means of the scaling method, which maintains the thermal layer at a con-stant temperature, referred to hereafter as the ‘‘substrate tem-perature.’’ Finally, the outermost trench layer is fixed to pre-vent shifting of the trench atoms, and is indicated in Fig. 1共b兲 by the lightest black dots.
The Ti film, fixed layer and thermal layer are all ar-ranged according to their hexagonal close-packed 共hcp兲 structure, and for simulation purposes are considered to com-prise a total of 20 300 atoms. As shown in Fig. 1共b兲, the current simulation model considers a trench of width and depth approximately 10 nm having wings of 5 nm length attached on either side of the trench opening. Periodic boundary conditions are applied in the x and y directions.
The incorporation of trench wings represents a signifi-cant improvement over the previous model. In order to ab-sorb the impact energy generated by the collision of high-energy incident atoms, the ends of these two wings are ‘‘capped’’ by the thermal control layer and the fixed layer. This prevents the incident energy from reflecting back and forth between the two ends of the trench, as would be the case if the periodic boundary conditions prescribed in the former research6were applied. Furthermore, the inclusion of trench wings allows the influence of incident atoms impact-ing upon the accumulation of deposited atoms to either side of the trench opening to be investigated.
It is assumed that all the incident atoms share a common initial velocity, which is dependent upon the specified inci-dent energy, i.e., Vatom⫽
冑
2•Eatom/ M , where Eatom repre-sents the incident energy and M is the atomic mass. In prac-tice, several deposition processes allow for the angular distribution to be controlled, e.g., collimated magnetron sput-ter deposition and ionized magnetron sputsput-ter deposition. Ac-cordingly, the current investigation also simulates the case where the collimation of the incident angle is well con-trolled. The incident angle of the deposited atoms is gener-ated by a random function and falls within a range of⫺5° to⫹5° 共where the vertical z axis represents the zero angle
reference兲. A cutoff angle3,6of ⫺5° to ⫹5° is also applied.
B. Potential model
This study employs the many-body potential of the tight-binding second moment approximation to simulate the inter-atomic forces between the various atoms. This model com-mences by summing the band energy, which is characterized by the second moment of the d-band density of state, and a pairwise potential energy of the Born–Mayer type12
Ei⫽⫺
再
兺
j 2exp冋
⫺2q冉
ri j r0 ⫺1冊册
冎
1/2 ⫹兺
j A exp ⫻冋
⫺p冉
ri j r0 ⫺1冊册
, 共1兲where is an effective hopping integral, ri j is the distance
between atoms i and j, and r0 is the first-neighbor distance. The parameters A, p, q andare determined by the experi-mental data of cohesive energy, lattice parameter, bulk modulus and shear elastic constants, respectively. The pa-rameters of tight-binding potential relating to Cu–Cu and Ti–Ti are listed in Table I.13Rather than resorting to rigorous mathematical manipulation or theoretical analysis to deter-mine the parameters of interatomic potential for Cu–Ti, an alternative approach is merely to take the average value of the two pure interatomic potential parameters, i.e., the rel-evant values of A, p, q and for Cu–Cu and Ti–Ti. This procedure has been used in previous literature to obtain the interaction parameters of Sb–Si16 and Cu–Ru, Cu–Ir, Cu–W, etc.17It might be argued that the inaccuracies arising as a result of adopting this simplified approach should be reflected within the simulation. However, Cu–Ti interaction is restricted to the initial stages of the deposition process when Cu atoms are first deposited on the Ti trench. As depo-sition continues, the distance between the point of impact of the incident Cu atoms and the Ti trench exceeds the trunca-tion distance of Ti. Therefore, Ref. 17 states that the effects of employing the simplified approach are negligible and may be ignored.
The interaction force on atom i can be expressed as
Fi⫽
兺
j⫽i冉
Ei ri j⫹ Ej ri j冊
r ¯i j ri j . 共2兲Deposition commences when the trench atom velocities have reached their thermal equilibrium state. In this condi-tion, the atoms are at a constant temperature and their veloci-ties conform to a Maxwell–Boltzmann distribution. The tra-jectories of the individual atoms are calculated by the leapfrog algorithm presented in Ref. 18.
C. Parallel computing algorithm
The current simulation runs on a cluster of eight per-sonal computers and adopts the atom decomposition 共AD兲 algorithm. The total number of atoms within the system is divided into a discrete number of pieces, which are then assigned evenly across the individual PCs. In the traditional AD algorithm, atom decomposition is based upon the se-quence number of individual atoms共assigned sequentially by the program兲, rather than upon the spatial position of these atoms, as is the case in the spatial deposition共SD兲 algorithm. Generally speaking, the SD algorithm reduces the volume of inter-processor traffic since data communication is only re-quired between the nearest neighbor regions. However, the current simulation involves atoms in a state of violent agita-tion. Under these conditions, the volume of data communi-cation required between each processor increases dramati-cally, and the SD algorithm loses its advantage. Furthermore,
TABLE I. Parameters used in tight-binding potential.
Parameters A(eV) 共eV兲 p q r0(Å)
Cu–Cu 0.0855 1.224 10.960 2.278 2.556
Ti–Ti 0.0741 1.4163 11.418 1.643 2.492
it is well known that obtaining the optimal division of the space domain between the individual processors within the cluster is problematic when using the SD composition algo-rithm. This is particularly true when the atoms undergo vio-lent motion, as in the current investigation.
One of the major improvements made to the AD algo-rithm utilized in the present study is the incorporation of ‘‘generating’’ and ‘‘arranging’’ functions which allow the al-gorithm to accommodate a continuously increasing number of atoms within the simulation system. The generating func-tion is responsible for the introducfunc-tion of new incident atoms into the simulation system, and determines both their veloci-ties and their incident positions. As the total number of atoms within the system increases, it is the responsibility of the arranging function to divide them equally between the nodes in the cluster. Since the incremental characteristic within the simulation lies in the time domain, it is convenient to assign the generating function to the last processor and the arrang-ing function to the first processor. This simple ‘‘head–toe’’ treatment allows the bulk of the traditional AD algorithm to be retained, thus minimizing the degree of modification re-quired.
III. RESULTS AND DISCUSSION
The total number of atoms within the simulation system is in the order of 70 000. As stated previously, the trench
comprises a constant 20 300 atoms, while a further 50 000 atoms are introduced progressively during the simulation.
Two main issues are discussed in this section of the ar-ticle:共1兲 the effects of incident energy and substrate tempera-ture upon the filling mechanisms, and共2兲 the effects of inci-dent energy and substrate temperature upon the trench coverage percentage. The influence of geometric model size is also evaluated by comparing the coverage percentage re-sults for a large model with those presented previously by the current authors for a small model.6
A constant deposition rate of 10 atoms/ps is used in all of the current simulations. Furthermore, to facilitate a valid comparison between the various case studies, the same num-ber of atoms is deposited in each case.
A. Incident energy effect
1. Nominal case of 1 eV and 300 K
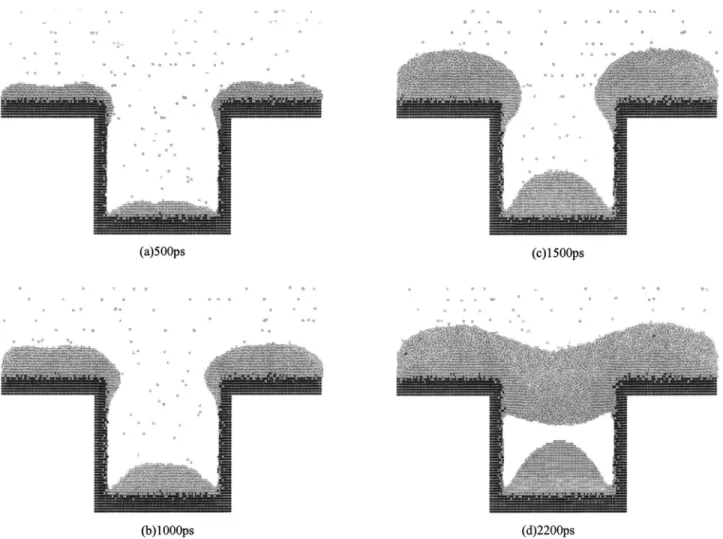
Figures 2共a兲–2共d兲 present four snapshots of the filling process for the nominal case of an incident energy of 1 eV and a substrate temperature of 300 K. The initial filling mor-phology is shown in Fig. 2共a兲 for an elapsed time of 500 ps. A small bulge of deposited atoms, generally referred to as an overhanging cluster, is noted on either side of the trench opening. Observation of Fig. 2共b兲, which shows the morphol-ogy at 1000 ps, indicates that these clusters have increased in
size. Furthermore, they appear to have a detrimental effect upon the coverage of the bottom corners of the trench.
Figures 2共c兲 and 2共d兲 show the filling morphology at 1500 and 2000 ps, respectively. The continuing accumulation of atoms on the trench wings and the increasing size of the overhanging clusters are both immediately apparent. Al-though the two corners are scarcely filled, a pronounced bulge of deposited atoms is evident in the center of the base of the trench. This phenomenon is attributed to the so-called shadowing effect, in which the overhanging clusters impede subsequent incident atoms from reaching the lower corners of the trench. Figure 2共d兲 presents the final trench filling morphology. The two overhanging clusters have increased to such a size that they actually meet and form a bridge, thus causing a void to become trapped within the trench.
2. Comparison of incident energies of 5 eV and 10 eV
Figure 3共a兲 presents a snapshot of the filling sequence at 1500 ps for an incident energy of 5 eV. A comparison of Fig. 3共a兲 with Fig. 2共c兲 shows that the overhanging clusters have migrated further towards the base of the trench. It is also noted that the atom accumulations on the trench wings are thinner than in the previous case. The difference in filling morphology arises mainly from the increase in incident en-ergy. Cu atoms which impact with higher incident energy
transfer more kinetic energy to the deposited atoms, and this prompts the atoms accumulated on the trench wings or within the overhanging clusters to ‘‘flow’’ into the unoccu-pied trench space.
Figure 3共b兲 illustrates the final filling morphology of the deposited atoms, i.e., at an instant of 2100 ps. Although the elapsed time is different than that of Fig. 2共d兲, which pre-sents a snapshot at 2000 ps, it is still valid to compare these two figures since the current morphology exhibits no change between 2000 and 2100 ps. A comparison indicates that uti-lization of a higher incident energy reduces the size of the trapped void. Additionally, the lower surface of the over-hanging cluster bridge and the height of the bulge in the base of the trench are both seen to be lower in Fig. 3共b兲. These observations are attributed to the ‘‘punch’’ effect generated by the higher incident energy of the Cu atoms.
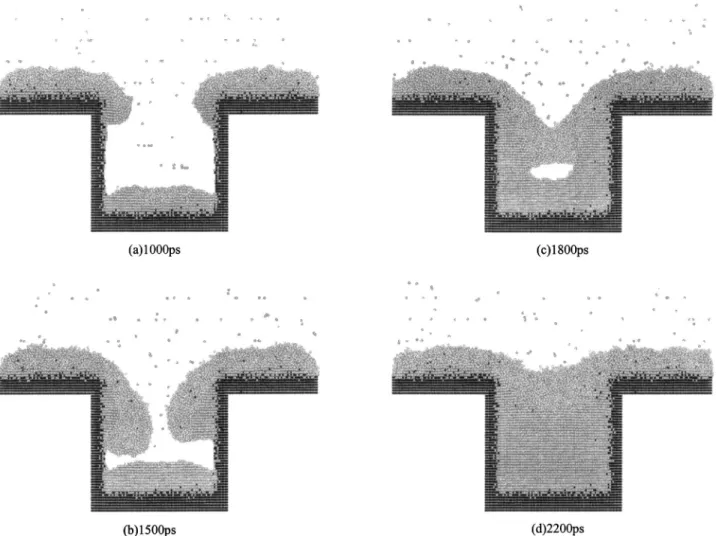
Figures 4共a兲–4共d兲 show four snapshots of the filling se-quence for an incident energy of 10 eV. A comparison of the filling morphology shown in Fig. 4共a兲 at a time instant of 1000 ps with the nominal case presented in Fig. 2共b兲 dem-onstrates that the effect of the higher incident energy is to flatten the layer of atoms deposited along the base of the trench. In other words, the punch effect causes the deposited atoms to spread into the two corners of the trench rather than to accumulate in its center. Accordingly, the height of the bulge is reduced and coverage of the corners is improved. Figure 4共b兲 shows the filling morphology at 1500 ps. Com-pared to Fig. 3共a兲, it is observed that the two overhanging cluster formations have migrated even further towards the base of the trench. Furthermore, the unoccupied space in the trench is far smaller than that observed in Fig. 2共c兲, which presents the morphology at the same time instant for the nominal incident energy of 1 eV. Figures 4共c兲 and 4共d兲 show the final filling sequences, i.e., at 1800 and 2200 ps, respec-tively. The size of the trapped void gradually reduces as deposition continues, and disappears completely in the steady state.
B. Substrate temperature effect
Substrate temperature elevated to 800 K for an incident energy of 5 eV
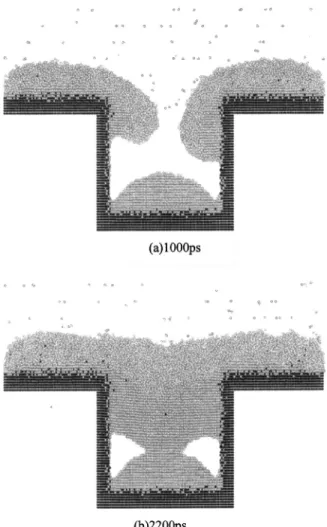
An aim of the current study is to investigate the influ-ence of substrate temperature upon the filling coverage of the trench. Accordingly, Figs. 5共a兲 and 5共b兲 present the filling morphology at elapsed times of 1000 and 2200 ps, respec-tively, for an incident energy of 5 eV and an elevated sub-strate temperature of 800 K. Comparing Fig. 5共a兲 with Fig. 3共a兲 reveals that the cluster overhanging the right side of the trench is lower in the case of the higher substrate tempera-ture. This suggests that the deposited atoms gain additional thermal energy from the high temperature substrate, and that this improves their mobility. Figure 5共b兲 shows the final fill-ing morphology at a time instant of 2200 ps. The void trapped within the trench is clearly much smaller than that shown in Fig. 3共b兲. This is further evidence that an elevated substrate temperature improves the fluidity of the deposited atoms.
FIG. 3. Two snapshots of filling sequence for case of 5 eV, 300 K at共a兲 1500 ps;共b兲 2100 ps.
C. Coverage percentage comparison for all cases
Figure 6 presents the coverage percentage results from the four simulations performed using the current large trench model. The numbers which appear within the parentheses located on the solid lines represent the incident energy and the substrate temperature, respectively. The results obtained from the previous research with a small model6are also pre-sented for comparison purposes. The coverage percentage is calculated by dividing the total number of atoms deposited within the trench by the number of atoms required for perfect coverage, i.e., the number of atoms required to fill the trench completely when arranged with the same hcp structure as the Ti barrier.
From Fig. 6, it can be observed that the improvement in coverage percentage over elapsed time exhibits a two-stage increase for all four current simulations, and that increasing the incident energy of the Cu atoms improves the coverage percentage of the trench. During the initial deposition stages, i.e., between 0 ps and 共approximately兲 1000 ps, the rate of improvement in coverage percentage is only marginally af-fected by an increase in the incident energy. However, as evidenced by the divergence of the solid curves, it is appar-ent that the improvemappar-ent in coverage percappar-entage becomes increasingly dependent upon the intensity of the incident en-ergy as deposition continues. This observation can be attrib-uted to the gradual collapse of the bridge structure formed by
the overhanging clusters in the latter stages of the deposition process. Finally, the solid curves are seen to approach a satu-ration value of the coverage percentage, which corresponds to the completion of the trench filling process. It is noted that the time required to attain this saturation coverage reduces as the intensity of the incident energy increases.
In order to investigate the substrate temperature effect, Fig. 6 presents the trench coverage results for an incident energy of 5 eV and a substrate temperature of 800 K. An elevation in the substrate temperature is seen to improve the trench coverage, and provides similar effects to those achieved by increasing the incident energy.
D. Quantitative comparison of geometrical effect
This subsection provides a quantitative comparison of the current coverage percentage results with those reported previously for a small model.6Although the former research employed the same tight-binding potential method to study the effects of incident energy and substrate temperature on the damascene trench filling process, the adopted simulation model was smaller, i.e., 2 nm deep by 2 nm wide, and it did not include trench wings. Furthermore, the previous simula-tion system comprised just 4000 atoms, a figure which rep-resents a mere 5.7% of the number of atoms considered in the present study.
The dashed lines in Fig. 6 represent the coverage per-centage results obtained previously. A separate time scale for the small model simulation is provided along the upper hori-zontal axis since the time required to complete trench filling is far shorter than in the current simulations. Other than deposition at 1 eV, 300 K, it is noted that the final coverage percentage for the small model is higher than that obtained for the large model under equivalent deposition conditions. Additionally, the shape of the coverage percentage improve-ment curve is significantly different for the two model sizes. Excluding the case of deposition at 5 eV, 300 K, which ex-hibits a two-stage increase similar to the current large model, the remaining small model simulations demonstrate a linear increase in the coverage percentage improvement. As stated previously, the abrupt improvement in coverage percentage is caused by the collapse of the overhanging clusters. The results presented in Fig. 6 indicate that the filling character-istics of the trench are affected significantly by the geometric dimensions of the model. Another significant difference be-tween the two sets of results is evident in the case of depo-sition at 1 eV, 300 K. The results suggest that the overhang-ing clusters collapse for the large model, but do not appear to do so for the small model. This is explained by the fact that in the latter case, the bridge is relatively shorter since the trench opening is smaller. Therefore, it is better able to with-stand the impact of the incident atoms.
Table II provides a quantitative comparison of the final trench coverage percentage for the four deposition cases. Other than the case of deposition at the minimum incident energy, the results confirm that a smaller model yields an improved final trench coverage percentage. The fourth col-umn presents the absolute difference in magnitude between the coverage percentage results for the two models, and also expresses this difference as a percentage. For a constant sub-strate temperature of 300 K, it is noted that the discrepancy between the two sets of results diminishes as the incident energy is increased. Therefore, the geometric model size is particularly significant when deposition is carried out at a lower incident energy. This observation is not unexpected since the mobility of the incident atoms is small when the incident energy is low, and therefore they are less able to overcome the geometric barriers imposed by the smaller model.
The bottom row of Table II provides the coverage per-centage results for deposition at 5 eV, 800 K. It is observed that the discrepancy between the two sets of results is the largest of the four deposition cases. Therefore, it can be stated that the geometric effect becomes more significant at elevated substrate temperatures. As in the previous cases, the coverage percentage is overestimated for the small size model. The results suggest that the thermal energy trans-ferred from the substrate to the deposited atoms is strongly influenced by the geometric size of the trench model, i.e., for a constant substrate temperature of 300 K, the energy which is transferred through the thermal layers and which increases the mobility of the deposited atoms, is greater in the case of a smaller model.
Table III shows the coverage percentage improvement for each step increase in the incident energy for a constant
FIG. 5. Two snapshots of filling sequence for case of 5 eV, 800 K at共a兲 1000 ps;共b兲 2200 ps.
FIG. 6. Coverage percentage comparison between a large size model and a small size model共see Ref. 6兲 for different situations. 共The elapsed time for the small model is shown by the dashed lines and refers to the upper hori-zontal time axis. The elapsed time for the large model is shown by the solid lines and refers to the lower horizontal time axis. The numbers in parenthe-ses indicate the incident energy and the substrate temperature, respectively, for both large and small models.兲
substrate temperature of 300 K. As before, a comparison is presented between the results obtained for the current large model and those of the previous model. When the incident energy is increased from 1 to 3 eV, the coverage improve-ment for the small model is 77.9%. However, the subsequent improvement as the incident energy is further increased to 5 eV is only 22.5%. By contrast, the equivalent improvements for the large model demonstrate an almost linear increase. The results indicate that the nature of the relationship be-tween coverage improvement and incident energy is depen-dent on the model size. The lower row of Table III shows the coverage improvement as the substrate temperature is in-creased from 300 to 800 K for a constant incident energy of 5 eV. As before, it is noted that the coverage improvement is overestimated by the small model.
Finally, a few comments upon the scale of the current simulation model are in order. If the model were to adopt a realistic trench length of 130 nm and a depth of 5 nm, a total of approximately 500 000 trench atoms would be included in the simulation system. Accordingly, the simulation task would require significant computational effort and would be very time consuming. The current simulation results indicate that the model size effect may be ignored when the incident energy exceeds 10 eV. Therefore, in the simulation of the damascene process it is convenient to conclude that the re-sults obtained from a smaller model may be extrapolated to represent a larger system if the incident energy is higher than 10 eV.
IV. CONCLUSION
This article has demonstrated the use of MD parallel computing techniques in the simulation of the damascene process. The traditional AD algorithm has been modified to accommodate a continuously increasing number of atoms within the simulation system. The modification basically in-volves the addition of a generating function and an arranging function to the first and the last processors within the eight-node cluster, respectively. An investigation into the trench filling process has been presented for a large size model, and a quantitative comparison has been made between the cur-rent results and those generated previously for a small model.6
The results of this study indicate that the qualitative be-havior of a large model is similar to that of a small model. Increasing the incident energy reduces the size of the
over-hanging clusters at the trench opening and the height of the bulge of atoms deposited on the base of the trench. Further-more, an increased incident energy improves the coverage of the bottom corners of the trench. It is found that an elevated substrate temperature promotes the fluidity of the deposited atoms and improves trench filling. A quantitative comparison of the two sets of results shows that the geometric effect is significant when the incident energy is small or when the substrate temperature is higher. Finally, the nature of the re-lationship between coverage improvement and incident en-ergy is found to depend on the model size.
ACKNOWLEDGMENTS
The authors gratefully acknowledge the support pro-vided to this research project by the National Science Coun-cil, Republic of China, under Grant No. NSC 90-2212-E-006-161. The authors are also indebted to a former project member, Dr. Jee-Gong Chang, for his valuable input regard-ing the use of parallel computregard-ing techniques for the tight-binding potential method.
1D. Bollmann, R. Merkel, and A. Klumpp, Microelectron. Eng. 37Õ38, 105
共1997兲.
2K. Abe, S. Tokitoh, S. C. Chen, J. Kanamori, and H. Onoda, IEEE 38th Annual International Reliability Physics Symposium, San Jose, CA, 2000, p. 333.
3S. Hamaguchi and S. M. Rossnagel, J. Vac. Sci. Technol. B 14, 2603
共1996兲.
4S. Hamaguchi and S. M. Rossnagel, J. Vac. Sci. Technol. B 13, 183
共1995兲.
5Y. Saito, S. Hirasawa, T. Saito, H. Nezu, H. Yamaguchi, and N. Owada, IEEE Trans. Semicond. Manuf. 10, 131共1997兲.
6S. P. Ju, C. I. Weng, J. G. Chang, and C. C. Hwang, J. Vac. Sci. Technol. B 20, 946共2002兲.
7
S. J. Plimpton and B. A. Hendrickson, in Materials Theory and Modelling, edited by J. Broughton, P. Bristowe, and J. Newsam, MRS Proceedings No. 291共Materials Research Society, Pittsburgh, PA, 1993兲, p. 37. 8S. J. Plimpton, J. Comput. Phys. 117, 1共1995兲.
9
S. J. Plimpton, Comput. Mater. Sci. 4, 361共1995兲. 10R. Murty and D. Okunbor, Parallel Comput. 25, 217共1999兲.
11C. F. Cornwell and L. T. Wille, Comput. Phys. Commun. 128, 477共2000兲. 12V. Rosato, M. Guillope, and B. Legrand, Philos. Mag. A 59, 321共1989兲. 13
F. Cleri and V. Rosato, Phys. Rev. B 48, 22共1993兲. 14
I. Meunier, G. Treglia, B. Legrand, R. Tetot, B. Aufray, and J.-M. Gay, Appl. Surf. Sci. 162,163, 219共2000兲.
15F. Hontinfinde, R. Ferrando, and A. C. Levi, Surf. Sci. 366, 306共1996兲. 16M. Ladeveze, G. Treglia, P. Muller, and F. Arnaud d’Avitaty, Surf. Sci.
395, 317共1998兲.
17T. Iwasaki, Comput. Mech. 25, 78共2000兲.
18D. Frenkel and B. Smit, Understanding Molecular Simulation共Academic, New York, 1996兲.
TABLE II. Coverage percentage comparison for small and large models.
Case Small model coverage percentage共%兲 Large model coverage percentage共%兲 Coverage percentage difference in magnitude共percentage兲 共1 eV, 300 K兲 38.5 49.7 11.2共22.5%兲 共5 eV, 300 K兲 68.5 58.9 9.6共16.3%兲 共10 eV, 300 K兲 83.9 81.5 2.4共2.9%兲 共5 eV, 800 K兲 85.3 66.5 18.8共28.3%兲
TABLE III. Coverage improvement comparison from increase of incident energy and substrate temperature.
Case Small model coverage improvement共%兲 Large model coverage improvement共%兲 (1 eV→5 eV, 300 K兲 77.9 18.5 (5 eV→10 eV, 300 K兲 22.5 38.4 (1 eV→10 eV, 300 K兲 117.9 64.0 (300 K→800 K, 5 eV兲 24.5 12.9