Behavioral/Systems/Cognitive
Spatiotemporal Dynamics of Bimanual Integration in Human Somatosensory Cortex and Their Relevance to Bimanual Object Manipulation
Patrick Jung,1,3Johannes C. Klein,1Michael Wibral,2Karsten Hoechstetter, Barbara Bliem,1Ming-Kuei Lu,1,4 Mathias Wahl,1and Ulf Ziemann1
1Department of Neurology and2Magnetoencephalography Unit, Brain Imaging Center, Goethe University Frankfurt, D-60528 Frankfurt, Germany,
3Department of Psychiatry and Psychotherapy, University Medical Center of the Gutenberg University Mainz, D-55131 Mainz, Germany, and4Department of Neurology, China Medical University Hospital, Taichung, Taiwan 40402, China
Little is known about the spatiotemporal dynamics of cortical responses that integrate slightly asynchronous somatosensory inputs from both hands. This study aimed to clarify the timing and magnitude of interhemispheric interactions during early integration of bimanual somatosensory information in different somatosensory regions and their relevance for bimanual object manipulation and exploration.
Using multi-fiber probabilistic diffusion tractography and MEG source analysis of conditioning-test (C-T) median nerve somatosensory evoked fields in healthy human subjects, we sought to extract measures of structural and effective callosal connectivity between different somatosensory cortical regions and correlated them with bimanual tactile task performance. Neuromagnetic responses were found in major somatosensory regions, i.e., primary somatosensory cortex SI, secondary somatosensory cortex SII, posterior parietal cortex, and premotor cortex. Contralateral to the test stimulus, SII activity was maximally suppressed by 51% at C-T intervals of 40 and 60 ms. This interhemispheric inhibition of the contralateral SII source activity correlated directly and topographically specifically with the fractional anisotropy of callosal fibers interconnecting SII. Thus, the putative pathway that mediated inhibitory interhemispheric interactions in SII was a transcallosal route from ipsilateral to contralateral SII. Moreover, interhemispheric inhibition of SII source activity correlated directly with bimanual tactile task performance. These findings were exclusive to SII. Our data suggest that early interhemispheric somatosensory integration primarily occurs in SII, is mediated by callosal fibers that interconnect homologous SII areas, and has behavioral importance for bimanual object manipulation and exploration.
Introduction
Skillful and coordinated bimanual object manipulation is a spe- cial feature of primates. It crucially depends on somatosensory feedback from both hands and its interhemispheric cortical inte- gration. The latter has long been assigned to higher-order so- matosensory cortices, such as the secondary somatosensory cortex (SII) and the posterior parietal cortex (PPC), because these regions, in contrast to areas 3b and 1 of the primary somato- sensory cortex (SI), show large, often bilateral receptive fields (Robinson and Burton, 1980) and dense callosal connections (Jones and Powell, 1969; Krubitzer and Kaas, 1990). Their ipsi- lateral responses generally emerge later and are weaker than the contralateral ones (Hari and Forss, 1999; Jung et al., 2009) and are most likely mediated via a transcallosal route (Iwamura, 2000;
Stanca´k et al., 2000) through the posterior third of the corpus callosum (CC) (Fabri et al., 1999, 2001).
Some studies, however, also detected small ipsilateral re- sponses in SI during unimanual somatosensory stimulation (Kanno et al., 2003; Nihashi et al., 2005; Sutherland and Tang, 2006). They most likely originate from area 2 of SI, because bilat- eral receptive fields and callosal connections have been demon- strated exclusively for this area of SI (Killackey et al., 1983;
Iwamura et al., 2001). However, the significance of area 2 for the integration of bimanual somatosensory inputs has not been in- vestigated yet.
Recent reports also showed suppressive interhemispheric in- teractions in area 3b of monkey SI during simultaneous tactile stimulation of both hands (Tommerdahl et al., 2006; Reed et al., 2011). Because of the lack of direct callosal connections between hand representations of area 3b in primates, it was suggested that the interhemispheric effects in area 3b involve indirect intra- hemispheric feedback projections from other areas, such as area 2 of SI, SII, or PPC.
In humans, Ragert et al. (2011) recently described interhemi- spheric inhibitory interactions between areas 3b of SI. However, these interactions were only present if ipsilateral preceded con- tralateral median nerve (MN) stimulation by a critical time win-
Received Nov. 30, 2011; revised Jan. 31, 2012; accepted March 5, 2012.
Author contributions: P.J., J.C.K., M.Wi., M.Wa., and U.Z. designed research; P.J., B.B., and M.-K.L. performed research; K.H. and B.B. contributed unpublished reagents/analytic tools; P.J. and J.C.K. analyzed data; P.J. and U.Z.
wrote the paper.
This study was supported by the Goethe University Frankfurt and Bayer HealthCare.
CorrespondenceshouldbeaddressedtoDr.PatrickJung,DepartmentofPsychiatryandPsychotherapy,JohannesGuten- bergUniversityMainz,UntereZahlbacherStrasse8,D-55131Mainz,Germany.E-mail:[email protected].
DOI:10.1523/JNEUROSCI.5957-11.2012
Copyright © 2012 the authors 0270-6474/12/325667-11$15.00/0
dow of 20 –25 ms. Reed et al. (2011) described suppression of neuronal responses in monkey area 3b if the ipsilateral stimulus was presented 0 –100 ms before the contralateral stimulus onset.
The neuronal responses were maximally suppressed at a stimulus onset delay of 100 ms and fully recovered if the interval was 500 ms. Thus, in analogy to the motor system (Ferbert et al., 1992), the degree of interhemispheric somatosensory inhibition criti- cally depends on the temporal asynchrony of bilateral inputs. As a limitation, the highlighted studies restricted their analysis to area 3b of SI.
In this study, we used a conditioning-test (C-T) median nerve paradigm with various C-T intervals and MEG source analysis to investigate the timing and magnitude of interhemispheric inter- actions during early integration of bimanual somatosensory in- formation in all major somatosensory regions (SI, SII, and PPC).
Moreover, we performed multi-fiber probabilistic diffusion trac- tography and bimanual tactile psychometric tests to assess the linkage of neurophysiological measures of interhemispheric so- matosensory processing with those of callosal structural connec- tivity and performance in bimanual tactile tasks.
Materials and Methods
Subjects. Fourteen healthy volunteers (age range, 21 to 43 years; mean age, 30.6 years; nine females) were investigated after obtaining informed consent. Subjects were reimbursed for their participation. All partici- pants were right-handed according to the Edinburgh Inventory (Old- field, 1971) (mean⫾ SD handedness score, 89.4 ⫾ 16.9) and had normal or corrected-to-normal visual acuity. Only subjects were included who (1) showed a normal clinical neurological examination, (2) had no his- tory of neurological or psychiatric diseases, and (3) showed normal find- ings of Erb’s potential (N10), the cortical N20/P25 component, and the N20 –N10 interpeak latency of left and right MN–somatosensory evoked potentials (SEPs) at a visually high signal-to-noise ratio (SNR) in a pre- vious screening session. The study was approved by the local ethics com- mittee of the medical faculty of Frankfurt University and conformed to the latest version of the Declaration of Helsinki.
C-T paradigm. Constant-current square-wave pulses of 0.2 ms dura- tion were delivered to the left (lMN) and right (rMN) median nerve at the wrist with suprathreshold stimulus intensities to elicit a small thumb twitch and nonpainful sensation (mean⫾ SD, 9.8 ⫾ 1.8 mA for lMN, 10.0 ⫾ 2.8 mA for rMN). We used a C-T paradigm (Gardner and Costanzo, 1980; Ferbert et al., 1992) to measure the effect of a first ipsi- lateral conditioning stimulus on cortical responses to a second contralat- eral test stimulus. The ipsilateral conditioning stimulus was applied to the lMN 5, 10, 15, 20, 40, 60, and 100 ms before the rMN test stimulus.
These C-T intervals were selected on the basis of previous observations in primates (Greenwood and Goff, 1987; Huttunen et al., 1992; Ragert et al., 2011; Reed et al., 2011). In addition, conditioning lMN and test rMN stimuli were presented alone and simultaneously. We recorded 12 runs with 150 trials each. The 10 different stimulus conditions were presented 15 times in each run in a balanced and pseudorandomized order at an intertrial interval of 2 s⫾ 25% time variation.
MEG data acquisition and preprocessing. MEG data were continuously recorded on a 275-channel whole-head system (Omega 2005; VSM Med- Tech) at a sampling rate of 2.4 kHz in a synthetic third-order axial gra- diometer configuration (Data Acquisition Software version 5.4.0; VSM MedTech). Data were filtered online with a 0.5 Hz high-pass fourth- order Butterworth filter. Before and after each run, the subject’s head position relative to the gradiometer array was measured using coils placed at the subject’s nasion and 1 cm anterior to the tragus of the left and right ear. Runs with head movement exceeding 5 mm compared with the starting head position were discarded. Cushions were used to stabilize subjects’ heads inside the MEG helmet.
The subjects watched a movie (“The Incredibles”) during measure- ment, projected from outside the magnetically shielded MEG room on a translucent screen at a size of a 10 cm square and a viewing distance of
⬃50 cm to preserve a high level of vigilance and to reduce the frequency
of blink artifacts. Stimulus presentation was controlled using the Presen- tation software package (www.neurobs.com).
For data preprocessing, epochs were defined from the continuously recorded MEG signals from⫺350 to 500 ms with respect to the onset of the rMN stimulus. Very noisy MEG channels were rejected on visual inspection. Data epochs contaminated by artifacts were automatically discarded using the artifact scan tool of BESA (Brain Electrical Source Analysis) software (version 5.2). The baseline was defined as the mean amplitude during an epoch ranging from⫺350 to ⫺150 ms before the onset of the contralateral T stimulus. Across all stimulus conditions and subjects, the number of artifact-free averaged trials ranged from 121 to 180.
To eliminate superimposed responses to ipsilateral stimulation, so- matosensory evoked fields (SEFs) to separate lMN stimulation were first corrected for the time lag of the respective C-T interval and then sub- tracted from the SEFs obtained during the different C-T conditions (for a similar approach in a visual event-related potential study, see Wibral et al., 2009). For example, if the C-T interval was 5 ms, then SEFs to separate lMN stimulation were moved forward by 5 ms before they were sub- tracted from the SEFs of the 5 ms C-T condition. The resulting difference waveforms for each C-T interval were assigned to the conditions C-T[5], C-T[10], …, C-T[100]. In the case of simultaneous bilateral MN stimu- lation (BilatSim), the separate lMN waveforms were subtracted from BilatSim without any latency shift, yielding the control condition C-T[0].
We chose this control condition to test for the effects of asynchronous bilateral stimulation on cortical somatosensory responses that occur in addition to known effects of BilatSim (Hoechstetter et al., 2001). In con- trast to BilatSim, the temporal asynchrony between lMN and rMN stim- uli further enabled us to draw conclusions about the direction of interhemispheric interactions (effective connectivity).
MEG–MRI coregistration. Anatomical T1-weighted MR images were acquired for every participant [MPRAGE, generalized autocalibrating partially parallel acquisitions (GRAPPA) acceleration factor of 2; TR, 2250 ms; TE, 2.6 ms; TI, 900 ms; flip angle, 9°; FOV, 256 mm; 256⫻ 240 matrix; 176 sagittal slices; voxel size, 1⫻ 1 ⫻ 1 mm3] with an eight- channel receive head coil on a 3 tesla Siemens Trio scanner. During MRI acquisition, each fiducial point used for head localization in MEG was replaced by vitamin E capsules for MEG/MRI coregistration. Moreover, one additional capsule was placed on the right side of the scalp to unam- biguously differentiate right and left hemispheres. The T1 images were aligned to the anterior commissure–posterior commissure (AC–PC) plane and transferred into Talairach space using Brain Voyager (www.
brainvoyager.com). The best-fitting spherical MEG head model was cal- culated on the basis of the individual head shapes on AC–PC aligned MR images.
MEG source analysis. We used a sequential fitting strategy of multiple discrete dipole source analysis (Scherg, 1990) for source analysis, because this was shown to provide reproducible and valid results in numerous previous MN–SEP/SEF investigations (Mauguie`re et al., 1997; Hari and Forss, 1999; Jung et al., 2009), as well as reliable estimations of source activity with minimal mutual crosstalk. For source analysis, the BilatSim condition and the separate lMN and rMN conditions were combined to the BilatMN condition to achieve the best possible SNR with 504⫾ 52 (mean⫾ SD) artifact-free averaged trials and to encompass the maxi- mum number of active brain regions. MEG data were filtered with a high-pass filter of 0.5 Hz, 6 dB/octave, forward and a low-pass filter of 200 Hz, 12 dB/octave, zero phase. Source analysis was applied for every individual in the 10 –200 ms latency range using the following fitting strategy. At first, the onset-to-peak latency range of the P30m component in the global field power (GFP) (i.e., the spatial SD of amplitudes in the different MEG sensors as a function of time; compare with Fig. 3A) was marked as the fitting interval, and a principal component analysis (PCA) was performed for this epoch. In all subjects, the topography of the first PCA component consisted of one dipolar magnetic field pattern in each hemisphere and explained at least 90% of data variance, whereas the succeeding PCA components each accounted for⬍5% of data variance.
We chose to fit symmetrical pairs of regional sources (RSs) because this leads to a more reliable and robust source modeling, and somatosensory areas show essentially symmetric locations (Tecchio et al., 1997; Wegner
et al., 2000). Moreover, source waveforms are only marginally influenced by small location shifts but heavily by changes of dipole orientations. An RS represents electrical activity in a brain region regardless of its orien- tation, and, thus, it can model activity of several distinct cortical gray matter patches that are close to each other.
During the first fit interval (P30m), RS of all 14 subjects were localized to the SI region. The next fit interval was determined by the earliest residual activity peak, during which (1) only one dipolar field pattern per hemisphere was present on scalp topographies of residual activity, and (2) PCA calculated only one dominant spatial component, explaining at least 90% of residual data variance. This second step was repeated for later epochs if the residual variance was still⬎5%. This source modeling approach yielded RS localizations in SII in 14, PPC in 11, and premotor cortex (PMC) in 5 subjects at variable fit intervals between 50 and 200 ms.
As proposed by previous MN–SEF source analysis studies (Forss et al., 1999; Simo˜es and Hari, 1999), we selected a subset of 70 channels per hemisphere over PPC and PMC to further increase the number of indi- vidual RS fits for these regions. In that way, individual RS fits were pos- sible for one and five more subjects in PPC and PMC, respectively. In the remaining cases, grand averaged spatial RS coordinates were used (PPC, n⫽ 2; PMC, n ⫽ 4) to ensure that the source model of every subject consisted of the same number of sources.
In a next step, RSs were converted to single equivalent current dipoles (ECDs) (Jung et al., 2009). In MEG, RSs consist of two orthogonally oriented dipoles in which one RS component represents electrical activ- ity along one dipole orientation. Relevant activity was detected for SI and SII in two dipole orientations with maximum activity for the first RS component in SI (SI1) at⬃30 ms and the second RS component (SI2) at
⬃60 ms, and the two SII components were maximally active at ⬃85 ms (SII1) and⬃110 ms (SII2). In PPC and PMC, only one RS component contributed to the solution with peak activities at⬃100 and ⬃125 ms, respectively. Hence, the final model consisted of six ECDs in each hemi- sphere at four symmetrical locations. The mean goodness-of-fit (GoF) for the modeled BilatMN condition was 95.1⫾ 2.5% (mean ⫾ SD) in the 10 –150 latency range, in which no individual solution was allowed to explain⬍90% of data variance (thus, 2 of 16 successfully screened sub- jects had to be excluded from analysis).
The same dipole solution was finally applied to the other stimulus conditions (BilatSim, rMN, lMN, C-T[0], C-T[5], …, C-T[100]), still providing a GoF⬎90% for every single subject under every single condition.
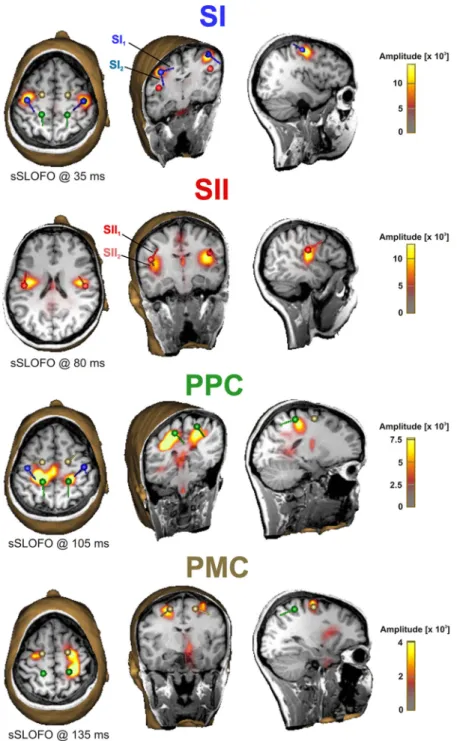
To cross-check the final multiple discrete dipole source model, sSLOFO (standardized shrinking LORETA-FOCUSS) (Liu et al., 2005), an iterative application of weighted distributed source images, was ap- plied to the BilatMN condition at latencies of maximum SI, SII, PPC, and
PMC activity. sSLOFO consists of an initial computation of an sLORETA (standardized low-resolution brain electromagnetic tomog- raphy) image (Pascual-Marqui, 2002), here computed on a regular cubic grid with 7 mm grid spacing covering the whole brain. The sLORETA computation is followed by three weighted minimum norm images. In each iter- ation step, grid points were pre-weighted by their estimated source activity of the previous iteration; grid points with⬍5% of the activity of the image maximum were eliminated from the source space in the following iteration. A truncated singular value decomposition cutoff value of 0.01% was used for regularization.
Acquisition of structural callosal connectivity measures. Three sets of diffusion-weighted MR volumes with diffusion gradients applied in 60 isotropically distributed directions were acquired with an eight-channel receive-only head coil on a 3 tesla Siemens Trio scanner (SE-EPI; TR, 8300 ms; TE, 95 ms; GRAPPA 2;
FOV, 208 mm; 60 axial slices; voxel size, 2⫻ 2⫻ 2 mm3; b value, 1000 s/mm2; 10 non- diffusion-weighted volumes). MR images were processed with tools from the FSL (FMRIB Software Library) soft- ware package (www.fmrib.ox.ac.uk). First, images were corrected for eddy current distortion and head motion using affine registration to a non-diffusion-weighted reference volume (Jenkinson and Smith, 2001).
The three image datasets were then averaged to increase SNR. Non-brain tissue was removed using BET (Brain Extraction Tool) (Smith, 2002).
Fractional anisotropy (FA) maps for every individual were calculated with DTIFIT, part of the FSL tools. FA values indicate the degree of anisotropy of the underlying tissue microarchitecture. They can range from 0 (isotropic diffusion) to 1 (diffusion occurs along one axis only).
The degree of anisotropy is linked to the integrity and the density of oriented structures in the tissue (Le Bihan, 2003). This includes the de- gree of myelination and axonal diameter of fibers.
After transformation of each individual MRI scan into MNI-152 stan- dard space (FLIRT tool of FSL), individual CC seed masks were defined by (1) choosing the sagittal slices ranging from x⫽ ⫺2 to ⫹2 in MNI space, (2) including only brain voxels with FA⬎ 0.4, and (3) manually eliminating spurious voxels of non-CC structures (fornix, in particular).
To use MEG sources as target masks, they were projected on structural T1 MR images and exported from BESA to Brain Voyager. MEG source locations were set to a fixed voxel intensity value outside the range of values observed in the brain and transformed to standard space via FSL–
FLIRT (Jenkinson and Smith, 2001; Jenkinson et al., 2002). Subse- quently, MEG sources were inflated to spheres of 20 mm in diameter to be used as target masks for tractography. Finally, multi-fiber probabilis- tic tractography between the CC and the respective target masks (inflated SI, SII, PPC, and PMC sources in the left and right hemispheres) was performed in diffusion space. Multi-fiber probabilistic diffusion tractog- raphy (Behrens et al., 2007) was run from seed voxels within the CC mask generated earlier. Counters were increased every time a virtual particle reached one of the cortical target masks, i.e., the inflated MEG sources, generating estimates of connectivity likelihood to these targets from ev- ery callosal seed mask voxel.
The detailed method of probabilistic tractography has been described previously (Behrens et al., 2003, 2007). In short, at each seed voxel, the probability density function (pdf) on each fiber direction is estimated. In this study, 50,000 streamline samples were drawn through these pdfs from each seed voxel. If a probabilistic streamline passes through a voxel in which more than one direction is estimated, it follows the direction that is closest to parallel with the direction at which the streamline ar- rives. A threshold of 100 of the 50,000 samples released was applied, and only voxels belonging to clusters of⬎20 seed voxels above this threshold were retained for additional analysis. This was done to be sensitive to paths from more distant, lateral cortical regions on the one hand and to Figure 1. Illustration of the wooden cubes that were used in the HORT. The cubes of 3⫻ 3 ⫻ 3 cm3size differed in (1) the size
(0.5 vs 1 cm) and position (central vs outer margin) of an indented hole, and (2) three different relative positions of two notched edges (equilateral, opposing, or diagonal to each other).
remove implausible connectivity on the other hand. The generated CC pathways to every tar- get region in each subject were then binarized and overlaid to an MNI-152 standard brain template to provide population probability maps for each pathway, in which voxel values represent the number of subjects exhibiting evidence of connectivity to the remote target listed.
For every target region under study, we computed the individual mean FA value of the CC voxel clusters exhibiting connectivity to that target, i.e., FA(CC–SI), FA(CC–SII), FA(CC–PPC), and FA(CC–PMC).
For visualization, we also calculated popula- tion probability maps of MEG source localiza- tions (see Fig. 4 A).
Bimanual tactile behavioral testing. To quan- titatively evaluate callosal somatosensory inte- gration on a behavioral level, each subject performed established neuropsychological tests while blindfolded, i.e., the tactile finger localization test (TLT) (Gazzaniga and Freed- man, 1973; Aglioti et al., 1998) and a haptic object recognition test (Sauerwein and Lassonde, 1997; Fabri et al., 2001). The degree of difficulty for both tests was increased com- pared with their original versions to enhance their sensitivity to small differences of perfor- mance within the normal range.
In TLT, the subject was lightly touched with a pen in pseudorandom succession at 1 of 12 points of each hand (center points of proximal, middle, or distal volar surface of fingers 2–5, two stimulations per point, 24 trials). In the intramanual TLT task, which was executed for both hands separately, the subject had to point at the stimulated site immediately thereafter with the thumb of the same hand. In the inter- manual task, the subject was stimulated on the left hand and immediately had to indicate the mirror point on the contralateral right hand with the right thumb. This way, interhemispheric transfer from the right to the left hemisphere was tested, as for the MEG C-T paradigm. The num- ber of incorrect TLT responses was counted.
In HORT, subjects were instructed to man- ually explore special features of 3⫻ 3 ⫻ 3 cm3 wooden cubes and to perform as fast and pre- cise as possible (Fig. 1). In the intramanual task, subjects unimanually identified special features of the wooden cubes (24 trials). In half of the trials, they were asked to decide whether a round indentation was small or large and whether its position was at the center or at the outer margin. They gave verbal responses like
“small, outer margin.” In the other half of the trials, they decided on the different relative po- sitions of two notched edges, i.e., if they were
equilateral, opposing, or diagonal to each other. In the intermanual task, the subjects explored one cube in either hand simultaneously and de- cided at maximum speed and accuracy whether a certain feature was identical or not. In 12 trials, they determined whether the size and posi- tion of the round indentation was identical or different for the cubes in both hands; in the other 12 trials, they had to compare the relative posi- tions of the two notched edges. The trials were presented in a pseudoran- domized and balanced order. The time needed to perform the HORT tasks and the number of incorrect trials was noted.
Statistical analysis. Mean waveforms of C-T[0] and their 95% confi- dence intervals were calculated by using the bootstrap bias-corrected and
accelerated method (Efron and Tibshirani, 1993; Hoechstetter et al., 2001). Significant activation was assumed at latencies in which the con- fidence intervals did not include the baseline.
One-way repeated-measures ANOVA with the within-subjects factor “D condition ” was calculated for peak amplitudes of each source component at latency ranges in which the 95% confidence interval of source waveforms under C-T[0] did not include the baseline. To adequately test for sphericity, absolute values of source strengths were used instead of percentage values (normalized to 100% for the C-T[0] condition). If Mauchly’s sphericity tests indicated that the assumption of sphericity was violated, the degrees of free- dom were corrected according to Greenhouse–Geisser estimates.
Figure 2. Multiple discrete dipole source model of a single subject and its validation via a distributed source imaging method (sSLOFO) (Liu et al., 2005). Distributed source images were calculated at peak latencies of SI, SII, PPC, and PMC source activity waveforms. The maxima on distributed source images corresponded well with the source locations of the discrete dipole source model (SI, blue; SII, red; PPC, green; PMC, copper). Moreover, no relevant activity of additional cortical regions was reconstructed by distributed source analysis. Note that two source components within SI (SI1, SI2) and SII (SII1, SII2) with orthogonal dipole orientations significantly contributed to the model.
Conditional on significant effects in the repeated-measures ANOVA, post hoc paired t tests were used with Bonferroni’s corrected p values ( p*⫽ corrected p value).
The CC index of TLT was calculated by subtracting the sum of errors in the left- and right-handed intramanual tasks from the errors in the inter- manual task. For computation of the CC index of HORT, the bimanual performance time was divided by the mean time of unimanual left and right hand performance. For each error, a time penalty that equalized the individual performance time for one trial was added.
To investigate the relationship between structural, functional, and be- havioral callosal connectivity measures, Pearson’s correlation coeffi- cients were calculated to explore relations between continuous variables, such as mean FA values of individually specified CC voxel clusters, neu- rophysiological MEG source activity changes, and CC indices of HORT.
Spearman’s correlation coefficients were calculated to assess relations between CC indices of TLT, a discrete variable, and structural and
neurophysiological measures. P values of correlation coefficients were not corrected for multiple comparisons.
All data are presented as mean⫾ SEM unless otherwise stated. We controlled for type 1 error at a level of p⫽ 0.05.
Results
MEG source analysis
Multiple discrete source analysis resulted in four symmetrical source locations at SI, SII, PPC, and PMC (Fig. 2). In the most strongly responding regions SI and SII, two source components with different dipole orientations were detected. The computed dipole source model was ap- plied to all other stimulus conditions, without a significant drop in the GoF (compare with Fig. 3A), supporting our a priori assumption that all relevantly active sources under all stimulus condi- tions would be covered by a BilatMN- based dipole solution. The temporal activity profiles of the different sources (Fig. 3B) closely matched those reported in previous MN–SEP/SEF studies (Forss et al., 1994; Mauguie`re et al., 1997; Stanca´k et al., 2005; Jung et al., 2009).
Figure 2 shows the results of one repre- sentative subject, in whom sSLOFO (Liu et al., 2005), an iteratively applied distributed source analysis technique, agreed with all ECD locations and showed no additional active cortical regions. The small activity on sSLOFO images in central thalamic and brainstem regions was interpreted as noise activity that is typically localized near the head center. Across all subjects, sSLOFO images illustrated activation maxima in SI in 14, SII in 14, PPC in 10, and PMC in 8 cases.
Therein, PPC maxima overlapped with re- constructed activity in SI in most cases, and PMC maxima were also fused with domi- nant SI activity in some cases. However, sSLOFO yielded no significant activation of any additional cortical regions, supporting the validity of the computed discrete multi- ple dipole source model.
Probability maps suggested that local- ization of MEG sources was dominated by electrical activity of cytoarchitectonic areas 3b in SI (Geyer et al., 1999), OP1 in SII (Eickhoff et al., 2006), subarea 5L of superior parietal lobule in PPC (Scheperjans et al., 2008), and area 6 in PMC (Geyer, 2003) (Fig. 4A). MEG sources within area 6 were best attributable to the dorsal area of the PMC. All of these areas are known to be essential for human somatosensory processing.
Effective interhemispheric somatosensory connectivity We tested for effects of a first lMN conditioning stimulus on MN–SEF source activities to a second rMN test stimulus. The control condition (C-T[0]) was calculated as the difference be- tween source activities after bilateral simultaneous and unilateral left MN stimulation. The difference conditions C-T[5], C-T[10],
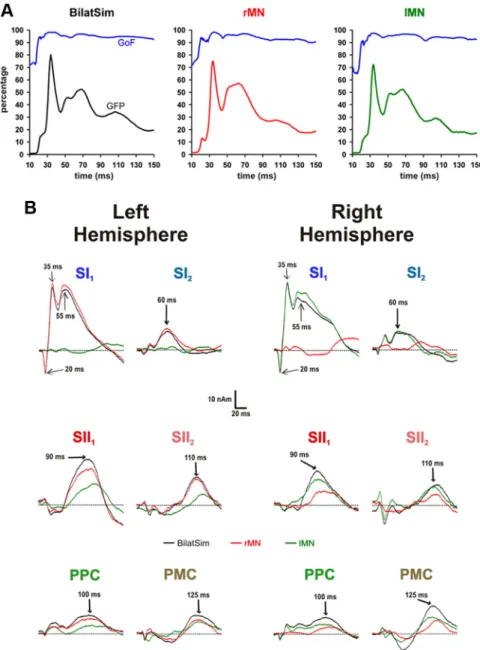
…, C-T[100] were defined as the difference between bilateral MN Figure 3. A, Grand averaged GoF (blue lines) and GFP (black, red, and green lines) as a function of the 10 –150 ms poststimulus
interval after BilatSim (black), rMN (red), and lMN (green) median nerve stimulation. The calculated multiple discrete source model sufficiently explained the recorded MEG data for each stimulus condition. B, Grand averaged source activity waveforms of all modeled source components in the 10 –150 ms poststimulus interval after BilatSim (black curves), rMN (red curves), and lMN (green curves) stimulation. Arrows indicate the peak latencies of every single source component. In line with previous results (Hoechstetter et al., 2001), SI and SII source waveforms of BilatSim were similar to contralateral responses after unilateral MN stimulation but did not reflect ipsilateral activities.
stimulation conditions with C-T intervals of 5, 10, … 100 ms and the unilateral lMN stimulation condition, corrected for the latency shift of the respective C-T interval.
The resulting difference source wave- forms for all D conditions are illustrated in Figure 5A. As expected, significant cor- tical responses were predominantly seen in the left hemisphere, i.e., contralateral to the test stimulus. Under C-T[0], signifi- cant activity of difference waveforms oc- curred in the left hemisphere exclusively for the sources SI2(peak at⬃60 ms), SII1
(⬃90 ms), SII2 (⬃110 ms), and PPC (⬃100 ms). The SI1source showed strong left-hemispheric, but also weak right- hemispheric, activations (peak at⬃70–75 ms), whereas PMC activation exceeded the significance level only in the right hemisphere (peak at⬃125 ms).
One-way repeated-measures ANOVA indicated that the strengths of the N75m of the right SI1source ( p⫽ 0.018), P90m of the left SII1source ( p⫽ 0.00010), and P110m of the left SII2source ( p⫽ 0.026) were significantly dependent on the C-T in- tervals (Fig. 5A). In contrast, the strengths of the N20m (p⫽0.72),P30m(p⫽0.64),and P50m (p⫽ 0.44) components of the left SI1
source, P60m (p ⫽ 0.37) of the left SI2
source, P100m (p⫽ 0.38) of the left PPC source, and P125m (p⫽ 0.09) of the right PMC source were not significantly influ- enced by the C-T intervals. In addition, peak latencies of all SEF source components were not significantly altered by the various C-T intervals (all p⬎ 0.2) (Fig. 5A).
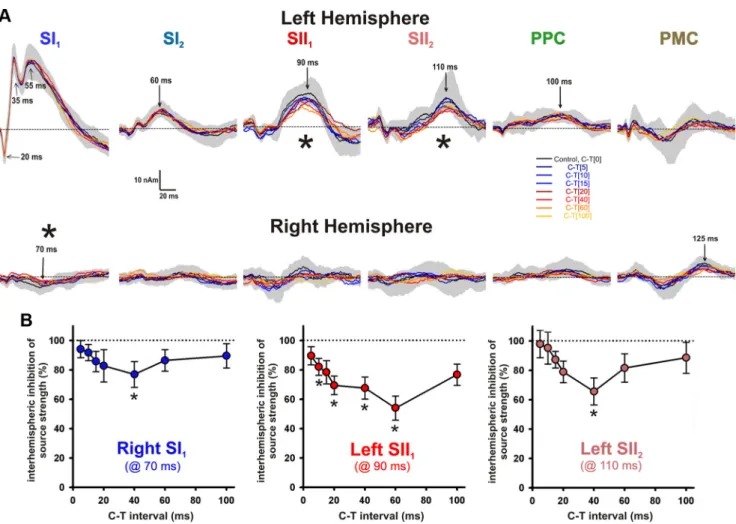
In post hoc comparisons, left SII1source strengths were significantly reduced at C-T intervals of 10 ms (⫺18.4 ⫾ 6.1%, p* ⫽ 0.005), 20 ms (⫺31.5 ⫾ 6.7%, p* ⫽ 0.002), 40 ms (⫺33.1 ⫾ 8.0%, p* ⫽ 0.02), and 60 ms (⫺46.5⫾8.8%,p*⫽0.001)(Fig.5B).In addition, trends of inhibited left SII1source activity were detected at C-T intervals of 15 ms (⫺21.6 ⫾ 8.5%, p* ⫽ 0.053) and 100 ms (⫺23.5⫾7.8%,p*⫽0.060).Onanindivid- ual level, interhemispheric inhibition of left SII1source activity was largest at C-T inter- vals of 10 ms in 2, 15 ms in 1, 20 ms in 1, 40 ms in 4, and 60 ms in 6 subjects. Maximum interhemispheric inhibition of left SII1 source responses was⫺50.8 ⫾ 7.7%.
Significantly reduced strengths were also determined for right SI1 (⫺23.0 ⫾ 8.7%) and left SII2 (⫺34.3 ⫾ 9.2%) sources at a C-T interval of 40 ms (all p*⬍ 0.05) (Fig. 5B). In summary, the first con- ditioning lMN stimulus executed a sup- pressive effect only on test rMN stimulus responses in the right SI and left SII re- gions. The magnitude of inhibition of source activities in these regions was de-
Figure 4. A, Probability maps for each source localization (right hemisphere) and its corresponding cytoarchitectonic cortical area (left hemisphere) of the Juelich Histological Atlas (Eickhoff et al., 2005), linearly transformed into MNI-152 standard space. For source localizations, color coding reflects the proportion of the population in which a dipole source was localized within 1 cm from the respective location from dark (4 of 14) to light (14 of 14) color; the probability for each cytoarchitectonic area was color coded from dark (30%) to light (100%). SI and BA 3b, blue; SII and OP1, red; PPC and subarea 5L of BA5, green; PMC and BA6, copper. B, Population-based probability maps and topography of callosal tracts between homologous somatosensory cortical areas. Probabilistic tractography was performed with the whole CC as seed mask and the inflated MEG sources in the right and left hemisphere as target masks. For each subject, only those CC voxels were considered that had higher connectivity likelihood than 90% of the maximum connectivity value to the target masks.
Color coding indicates the number of subjects in which a given CC voxel connects to the particular target, ranging from dark (4 of 14) to light (14 of 14) color. sCC between SI sources, blue; sCC between SII sources, red; sCC between PPC sources, green; sCC between PMC sources, copper. The map shows anteroposterior topographic organization with partial overlap- ping between sCC of SII and PPC sources as well as SI and PMC sources.
pendent on the C-T interval and taken as a measure of interhemi- spheric somatosensory effective connectivity.
Structural callosal somatosensory connectivity
Multi-fiber probabilistic tractography traced somatosensory cal- losal connections (sCC) between homologous SII, PPC, and PMC in all subjects, whereas sCC between SI were found in only 8 of 14 subjects. sCC were topographically ordered with an anterior-to-posterior succession of fibers between PMC, SI, SII, and PPC (Fig. 4 B). The interindividual variation of sCC between SII in the anteroposterior direction was larger than that of sCC between the other cortical regions. This was at least partly attribut- able to a more pronounced variability of SII source localizations in the anteroposterior than in the mediolateral or inferior–superior direction (cf. Table 1).
Relationship between functional, structural, and behavioral measures of sCC
CC indices of behavioral tactile tests that are dependent on pos- terior CC integrity (Fabri et al., 2001, 2005), i.e., TLT and HORT,
were significantly correlated to the magnitude of maximum in- terhemispheric inhibition of SII1source activity in the left hemi- sphere, i.e., contralateral to the test stimulus (Fig. 6). Moreover, FA values of sCC between SII in the midsagittal plane were sig- nificantly correlated to interhemispheric inhibition of SII1source activity (Fig. 6). In contrast, no significant correlations between FA of sCC between SII and CC indices of TLT or HORT were found ( ⫽ ⫺0.16, r ⫽ ⫺0.22). These results suggest that inhibi- tion of left SII1source activity was mediated by a transcallosal route from right to left SII. The structural–functional linkage between interhemispheric inhibition of left SII1source activity Figure 5. A, Difference waveforms of two source components in SI and SII and one source component in PPC and PMC for all different intervals between the lMN conditioning stimulus and the rMN test stimulus in the left (top row) and right (bottom row) hemisphere. The control condition (C-T[0], black line) was calculated as the difference between source activities after bilateral simultaneous and unilateral left MN stimulation. Shaded gray area⫽ 95% confidence interval of difference waveforms under C-T[0]. C-T[5], C-T[10], …, C-T[100] were defined as the difference between bilateral MN stimulation with a C-T interval of 5, 10, … 100 ms and unilateral lMN stimulation corrected for the C-T interval. The strengths of the N75m of the right SI1source, P90m of the left SII1source, and P110m of the left SII2source were significantly dependent on different C-T intervals, whereas all other relevant SEF components (N20m, P30m, P55m of left SI1; P60m of left SI2; P100m of left PPC; P125m of right PMC) were not. B, Inhibition of source strengths (mean⫾SEM;0%indicatescompleteinhibition,100%noinhibitioncomparedwiththecontrolconditionC-T[0]) at different C-T intervals, in which only those source components are illustrated that were significantly affected by different C-T intervals. Left SII1source strengths were significantly reduced at C-T intervals of 10, 20, 40, and 60 ms. In addition, strong trends of left SII1source inhibition were detected at C-T intervals of 15 and 100 ms ( p*⬍ 0.06). Significantly reduced strengths were also determined for right SI1and left SII2sources at a C-T interval of 40 ms (all p*⬍0.05).Thus,interhemisphericinhibitionofcorticalsourceswascriticallydependentontheC-Tinterval,withmaximum effects at intervals of 40 and 60 ms. p* is Bonferroni’s corrected for multiple comparisons.
Table 1. Cortical MN–SEF dipole source locations in Talairach space (symmetrical fit, meanⴞ SEM)
x (mm) y (mm) z (mm)
SI ⫾39.8 ⫾ 1.1 ⫺18.9 ⫾ 0.8 47.9⫾ 1.6
SII ⫾44.4 ⫾ 1.9 ⫺14.3 ⫾ 2.8 19.0⫾ 1.3
PPC ⫾26.6 ⫾ 2.9 ⫺35.7 ⫾ 1.7 53.1⫾ 2.2
PMC ⫾19.5 ⫾ 3.0 ⫺6.6 ⫾ 3.1 52.9⫾ 2.3
and FA of sCC between SII was topo- graphically specific because no significant correlations were demonstrated between interhemispheric inhibition of left SII1 source activity and FA of sCC between PMC or PPC (all r⬍ 兩0.29兩), although sCC between SII and PPC overlapped (Fig. 4 B) and their FA values were significantly cor- related (r⫽ 0.70, p ⫽ 0.006).
The magnitude of interhemispheric inhibition of right SI1and left SII2sources at a C-T interval of 40 ms was not signifi- cantly related to the CC index of TLT (all
⬍ 兩0.29兩), to the CC index of HORT (all r⬍ 兩0.23兩), or to FA values of sCC between SII (all r⬍ 兩0.11兩). Furthermore, the cor- relation between interhemispheric inhibi- tion of right SI1 source and FA of sCC between SI was not significant (r ⫽
⫺0.33) (Fig. 6).
Discussion
This study provides new insights into in- terhemispheric interactions during early cortical integration of bimanual somato- sensory information. It clarifies the tim- ing and magnitude of interhemispheric effective connectivity and demonstrates a linkage of interhemispheric effective con- nectivity to callosal structural connectiv- ity and bimanual tactile task performance.
Among the activated somatosensory cor- tical regions SI, SII, PPC, and PMC, only SII was identified as a key region for in- terhemispheric integration of bimanual input.
SI: cortical origin of neuromagnetic sources, callosal connectivity, and relevance to bimanual exploration
The primary somatosensory cortex comprises areas 3a, 3b (SI proper), 1, and 2. Human neurophysiological studies strongly suggested that the MN–SEP/SEF components N20 and P30 are generated in contralateral area 3b (Allison et al., 1989a; Jung et al., 2008) and the N60/P60 component in contralateral area 1 (Alli- son et al., 1992; Ploner et al., 2000; Jung et al., 2008). We found two source components in the SI region (Fig. 3). SI1contained the N20m and P30m components, whereas SI2 represented the P60m. Hence, we attributed SI1 to area 3b and SI2 to area 1.
Probability maps suggested that SI source localization was dom- inated by electrical activity of area 3b (Fig. 4 A).
We found no significant interhemispheric interactions in left- hemispheric, i.e., contralateral to the test stimulus, areas 3b (SI1 source component) and 1 (SI2source component). This is in line with results of several previous human studies (Uttal and Cook, 1964; Greenwood and Goff, 1987; Huttunen et al., 1992; Hoech- stetter et al., 2001) but at variance with other recent monkey and human studies (Tommerdahl et al., 2006; Ragert et al., 2011; Reed et al., 2011). The divergent results across studies suggest that bimanual interactions in areas 3b and 1 are critically dependent on multiple factors, such as species, applied methods, stimulus intensities, and selective attention.
In contrast to the left SI, interhemispheric interactions oc- curred in the ipsilateral right SI. The low amplitude N75m com-
ponent of the right-hemispheric SI1 source was significantly reduced at a C-T interval of 40 ms (Fig. 5), although to a lesser extent than the contralateral left-hemispheric SII source compo- nents. It is conceivable that area 3b represents activity of the right SI1source because several fMRI studies have demonstrated deac- tivations in ipsilateral area 3b during unilateral tactile stimulation (Hlushchuk and Hari, 2006; Eickhoff et al., 2008; Kastrup et al., 2008; Klingner et al., 2011). However, it is more likely that area 2 generates neural activation in ipsilateral SI because (1) bilateral receptive fields and sCC have been demonstrated exclusively for this area of SI (Iwamura et al., 2001), and (2) local activation maxima in electrocorticography, EEG, and fMRI were placed more posteriorly during ipsilateral than during contralateral hand stimulation (Allison et al., 1989b; Eickhoff et al., 2008).
Thus, right SI1responses probably reflect activation of area 2.
The most likely pathway that mediates suppression of ipsilat- eral area 2 (SI1) is a transcallosal route from the homologous contralateral area 2 (Tomasch, 1954; Iwamura, 2000). We failed to provide supportive evidence, possibly because correlation analysis between FA values of sCC between SI regions and the degree of interhemispheric inhibition of the right SI source was underpowered, given that probabilistic tractography between homologous SI was effective in only 8 of 14 subjects. However, these reservations did not apply for the lack of correlations be- tween interhemispheric inhibition of the right SI source and per- formance of bimanual tactile tasks. Hence, interhemispheric interactions in the ipsilateral SI region do not seem to be pivotal for bimanual exploration.
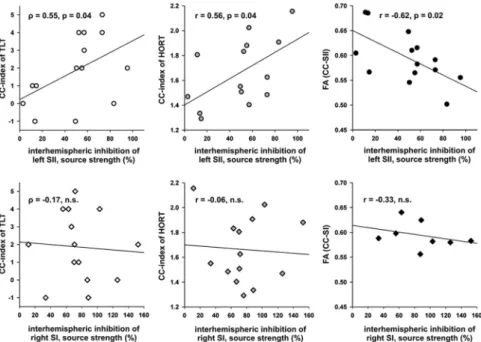
Figure 6. Relationship between structural, functional, and behavioral measures of somatosensory callosal connectivity.
The magnitude of maximum interhemispheric inhibition of left SII1source activity (0% indicates complete inhibition, 100%
no inhibition) was significantly correlated to the CC indices of TLT and HORT, which assess transcallosal interactions on a behavioral level. This means that bimanual tactile performance improved with increasing interhemispheric inhibition of left SII1sources. Moreover, maximum interhemispheric inhibition of left SII1sources showed a significant negative corre- lation with the mean FA values of midsagittal CC voxels interconnecting the homologous SII sources, i.e., interhemispheric inhibition of SII1source activity increased with the density and directionality of CC fibers between SII. This suggests that interhemispheric inhibition of left SII1sources arose through effective connectivity via a transcallosal route from the right to the left SII. In contrast, interhemispheric inhibition of the right SI1source was related to neither CC indices of behavioral tactile tasks nor to FA indices of CC fibers between SI. Note, however, that CC fiber tracking between SI sources was only possible in 8 of 14 subjects. CC index of TLT⫽ errors intermanual task ⫺ (errors intramanual RH ⫹ errors intramanual LH);
CC index of HORT⫽ t[intermanual]/((t[intramanual RH] ⫹ t[intramanual LH])/2).
SII: cortical origin of neuromagnetic sources, callosal connectivity, and relevance to bimanual exploration
Conditioning lMN stimuli most effectively changed activity of the left SII1 and SII2 source components. The two SII source components represent two different cortical generators in close spatial relationship (Mima et al., 1997; Stanca´k et al., 2005). Sev- eral candidate areas exist in the SII region to represent the two SII source components. We propose that the S2 area and the parietal ventral area (PV), but not the parietal rostroventral area (PR), the ventral somatosensory area (VS), or the posterior insula (pINS), are reflected in the two SII source components. Areas S2 and PV are well-established key areas within the somatosensory cortical network, whereas areas PR and VS are only vaguely characterized in primates (Disbrow et al., 2000; Eickhoff et al., 2006) and do not consistently respond to pure somatosensory stimuli (Fitzgerald et al., 2006; Hinkley et al., 2007). Likewise, activity of pINS is rather unlikely to be reflected in the SII source waveforms because acti- vation occurs at latencies⬎150 ms after stimulus (Frot et al., 2007). Moreover, MEG sensitivity for pINS is rather low because it is located relatively deep in the brain with preferentially radially oriented pyramidal output neurons toward the scalp.
The SII1source (P90m) showed stronger activity than SII2 (P110m) and thus was more likely the principal component that drove source localization. Probability maps (Fig. 4 A) illustrated that SII source locations best matched with OP1 (i.e., area S2).
We suggest that the SII1source component reflected activity of S2/OP1 and SII2responses in PV/OP4. In some cases, PV might have attracted SII source localization to more anterior coordi- nates, which would explain the higher variance of SII source lo- cations in anteroposterior than other directions (Table 1).
Interhemispheric inhibition of left SII1 source activity in- creased significantly with higher FA values of sCC between SII and with the performance of bimanual tactile tasks. Heterotopic sCC between SI and SII (Manzoni et al., 1986) might have con- tributed to source inhibition in area S2, but numerous studies suggest that these connections are sparse for the hand represen- tation (Pandya and Vignolo, 1968; Jones and Powell, 1969). In contrast, homologous S2 areas are densely connected interhemi- spherically via callosal fibers and more prominently so than areas PV/OP4 (Eickhoff et al., 2010). Hence, we can reasonably con- clude that sCC from right to left area S2 accounted for the ob- served inhibitory effects on left-hemispheric SII1source activity.
To enable differentiated and independent patterns of activity between the hands during simultaneous bimanual tactile explo- ration of objects, callosal inhibition may alternately suppress in- terfering signals of the homologous cortical area, because it was demonstrated in primary motor cortex MI (Hu¨bers et al., 2008).
Callosal inhibition might also be mandatory to suppress pre- ferred coupling modes (Swinnen, 2002), to encode the difference between special features of two objects by different levels of inhi- bition, or to accomplish the interhemispheric comparison of ac- tion phase controlling contact events (Johansson and Flanagan, 2009).
Callosal connectivity of PPC and PMC
Extensive callosal connections exist between higher-level integra- tive areas in the two hemispheres, such as PPC and PMC (Zarei et al., 2006). Moreover, recent findings indicated that right PPC excitability influences somatosensory cortical processing in the left hemisphere (Blankenburg et al., 2008). However, we did not find evidence for interhemispheric interactions in these areas.
Because this study was restricted to the first 150 ms after test
stimulus presentation, we cannot rule out that PPC and PMC are involved in bimanual somatosensory integration at later stages.
Topography of sCC
SCC of SII mapped to the border between the posterior midbody and rostral splenium, in line with the part of CC that was pro- posed to be essential for bimanual task performance in TLT and HORT (Fabri et al., 2005). The topographical organization of sCC fibers between SI, SII, PPC, and PMC (Fig. 4 B) corresponds well with previous probabilistic fiber tracking results (Zarei et al., 2006).
Temporal dynamics of somatosensory callosal connectivity Callosal inhibition of SII1source activity, which is linked to both structural and behavioral sCC measures, started at C-T intervals of 10 ms and peaked at 40 – 60 ms intervals. Thus, interhemi- spheric somatosensory inhibition in SII peaked later and lasted over a longer range of C-T intervals compared with interhemi- spheric motor inhibition, regardless of whether the latter is me- diated directly via connections between MI (Ferbert et al., 1992) or via connections between homologous PPC (Koch et al., 2011).
In contrast to MI, SII serves as a higher-order area, i.e., it integrates information from other somatosensory areas. It is well possible that these intrahemispheric integrative process- ing steps precede the callosal information transfer between SII.
In addition, small-diameter CC fibers are thought to connect higher-order areas, such as SII, whereas faster-conducting large- diameter fibers link homologous primary sensorimotor areas (Aboitiz et al., 1992). Moreover, the fiber diameter and myelina- tion degree of sCC of SII might be more variable than for MI because they are more numerous and are running through parts of the CC in which both large (posterior midbody) and small (rostral splenium) diameter fibers are located (Aboitiz et al., 1992).
Significance
This is the first study to clarify the timing and magnitude of callosal effective connectivity during early somatosensory corti- cal processing and its linkage to callosal structural connectivity and bimanual tactile task performance. Our findings suggest that early interhemispheric cortical integration of bimanual somato- sensory input primarily occurs in SII but not in areas within the SI, PPC, or PMC regions. Early interhemispheric integration of bimanual somatosensory input is mediated by callosal fibers that interconnect homologous SII areas and has behavioral impor- tance for bimanual object manipulation and coordination.
References
Aboitiz F, Scheibel AB, Fisher RS, Zaidel E (1992) Fiber composition of the human corpus callosum. Brain Res 598:143–153.
Aglioti S, Beltramello A, Tassinari G, Berlucchi G (1998) Paradoxically greater interhemispheric transfer deficits in partial than complete callosal agenesis. Neuropsychologia 36:1015–1024.
Allison T, McCarthy G, Wood CC, Darcey TM, Spencer DD, Williamson PD (1989a) Human cortical potentials evoked by stimulation of the median nerve. I. Cytoarchitectonic areas generating short-latency activity. J Neu- rophysiol 62:694 –710.
Allison T, McCarthy G, Wood CC, Williamson PD, Spencer DD (1989b) Human cortical potentials evoked by stimulation of the median nerve. II.
Cytoarchitectonic areas generating long-latency activity. J Neurophysiol 62:711–722.
Allison T, McCarthy G, Wood CC (1992) The relationship between human long-latency somatosensory evoked potentials recorded from the cortical surface and from the scalp. Electroencephalogr Clin Neurophysiol 84:301–314.
Behrens TE, Woolrich MW, Jenkinson M, Johansen-Berg H, Nunes RG, Clare S, Matthews PM, Brady JM, Smith SM (2003) Characterization and propagation of uncertainty in diffusion-weighted MR imaging. Magn Reson Med 50:1077–1088.
Behrens TE, Berg HJ, Jbabdi S, Rushworth MF, Woolrich MW (2007) Prob- abilistic diffusion tractography with multiple fibre orientations: what can we gain? Neuroimage 34:144 –155.
Blankenburg F, Ruff CC, Bestmann S, Bjoertomt O, Eshel N, Josephs O, Weiskopf N, Driver J (2008) Interhemispheric effect of parietal TMS on somatosensory response confirmed directly with concurrent TMS-fMRI.
J Neurosci 28:13202–13208.
Disbrow E, Roberts T, Krubitzer L (2000) Somatotopic organization of cor- tical fields in the lateral sulcus of Homo sapiens: evidence for SII and PV.
J Comp Neurol 418:1–21.
Efron B, Tibshirani RJ (1993) An introduction to the bootstrap. New York:
Chapman and Hall.
Eickhoff SB, Stephan KE, Mohlberg H, Grefkes C, Fink GR, Amunts K, Zilles K (2005) A new SPM toolbox for combining probabilistic cytoarchitec- tonic maps and functional imaging data. Neuroimage 25:1325–1335.
Eickhoff SB, Schleicher A, Zilles K, Amunts K (2006) The human parietal operculum. I. Cytoarchitectonic mapping of subdivisions. Cereb Cortex 16:254 –267.
Eickhoff SB, Grefkes C, Fink GR, Zilles K (2008) Functional lateralization of face, hand, and trunk representation in anatomically defined human so- matosensory areas. Cereb Cortex 18:2820 –2830.
Eickhoff SB, Jbabdi S, Caspers S, Laird AR, Fox PT, Zilles K, Behrens TE (2010) Anatomical and functional connectivity of cytoarchitectonic ar- eas within the human parietal operculum. J Neurosci 30:6409 – 6421.
Fabri M, Polonara G, Quattrini A, Salvolini U, Del Pesce M, Manzoni T (1999) Role of the corpus callosum in the somatosensory activation of the ipsilateral cerebral cortex: an fMRI study of callosotomized patients.
Eur J Neurosci 11:3983–3994.
Fabri M, Polonara G, Del Pesce M, Quattrini A, Salvolini U, Manzoni T (2001) Posterior corpus callosum and interhemispheric transfer of so- matosensory information: an fMRI and neuropsychological study of a partially callosotomized patient. J Cogn Neurosci 13:1071–1079.
Fabri M, Del Pesce M, Paggi A, Polonara G, Bartolini M, Salvolini U, Manzoni T (2005) Contribution of posterior corpus callosum to the interhemi- spheric transfer of tactile information. Brain Res Cogn Brain Res 24:73– 80.
Ferbert A, Priori A, Rothwell JC, Day BL, Colebatch JG, Marsden CD (1992) Interhemispheric inhibition of the human motor cortex. J Physiol 453:525–546.
Fitzgerald PJ, Lane JW, Thakur PH, Hsiao SS (2006) Receptive field (RF) properties of the macaque second somatosensory cortex: RF size, shape, and somatotopic organization. J Neurosci 26:6485– 6495.
Forss N, Hari R, Salmelin R, Ahonen A, Ha¨ma¨la¨inen M, Kajola M, Knuutila J, Simola J (1994) Activation of the human posterior parietal cortex by median nerve stimulation. Exp Brain Res 99:309 –315.
Forss N, Hietanen M, Salonen O, Hari R (1999) Modified activation of somatosensory cortical network in patients with right-hemisphere stroke.
Brain 122:1889 –1899.
Frot M, Magnin M, Mauguie`re F, Garcia-Larrea L (2007) Human SII and posterior insula differently encode thermal laser stimuli. Cereb Cortex 17:610 – 620.
Gardner EP, Costanzo RM (1980) Temporal integration of multiple-point stimuli in primary somatosensory cortical receptive fields of alert mon- keys. J Neurophysiol 43:444 – 468.
Gazzaniga MS, Freedman H (1973) Observations on visual processes after posterior callosal section. Neurology 23:1126 –1130.
Geyer S (2003) The microstructural border between the motor and the cog- nitive domain in the human cerebral cortex. Vienna: Springer.
Geyer S, Schleicher A, Zilles K (1999) Areas 3a, 3b, and 1 of human primary somatosensory cortex. Neuroimage 10:63– 83.
Greenwood PM, Goff WR (1987) Modification of median nerve somatic evoked potentials by prior median nerve, peroneal nerve, and auditory stimulation. Electroencephalogr Clin Neurophysiol 68:295–302.
Hari R, Forss N (1999) Magnetoencephalography in the study of human somatosensory cortical processing. Philos Trans R Soc Lond B Biol Sci 354:1145–1154.
Hinkley LB, Krubitzer LA, Nagarajan SS, Disbrow EA (2007) Sensorimotor
integration in S2, PV, and parietal rostroventral areas of the human syl- vian fissure. J Neurophysiol 97:1288 –1297.
Hlushchuk Y, Hari R (2006) Transient suppression of ipsilateral primary somatosensory cortex during tactile finger stimulation. J Neurosci 26:5819 –5824.
Hoechstetter K, Rupp A, Stanca´k A, Meinck HM, Stippich C, Berg P, Scherg M (2001) Interaction of tactile input in the human primary and second- ary somatosensory cortex—a magnetoencephalographic study. Neuro- image 14:759 –767.
Hu¨bers A, Orekhov Y, Ziemann U (2008) Interhemispheric motor inhibi- tion: its role in controlling electromyographic mirror activity. Eur J Neu- rosci 28:364 –371.
Huttunen J, Ahlfors S, Hari R (1992) Interaction of afferent impulses in the human primary sensorimotor cortex. Electroencephalogr Clin Neuro- physiol 82:176 –181.
Iwamura Y (2000) Bilateral receptive field neurons and callosal connections in the somatosensory cortex. Philos Trans R Soc Lond B Biol Sci 355:267–273.
Iwamura Y, Taoka M, Iriki A (2001) Bilateral activity and callosal connec- tions in the somatosensory cortex. Neuroscientist 7:419 – 429.
Jenkinson M, Smith S (2001) A global optimisation method for robust af- fine registration of brain images. Med Image Anal 5:143–156.
Jenkinson M, Bannister P, Brady M, Smith S (2002) Improved optimization for the robust and accurate linear registration and motion correction of brain images. Neuroimage 17:825– 841.
Johansson RS, Flanagan JR (2009) Coding and use of tactile signals from the fingertips in object manipulation tasks. Nat Rev Neurosci 10:345–359.
Jones EG, Powell TP (1969) Connexions of the somatic sensory cortex of the rhesus monkey. II. Contralateral cortical connexions. Brain 92:717–730.
Jung P, Baumga¨rtner U, Magerl W, Treede RD (2008) Hemispheric asym- metry of hand representation in human primary somatosensory cortex and handedness. Clin Neurophysiol 119:2579 –2586.
Jung P, Baumga¨rtner U, Stoeter P, Treede RD (2009) Structural and func- tional asymmetry in the human parietal opercular cortex. J Neurophysiol 101:3246 –3257.
Kanno A, Nakasato N, Hatanaka K, Yoshimoto T (2003) Ipsilateral area 3b responses to median nerve somatosensory stimulation. Neuroimage 18:169 –177.
Kastrup A, Baudewig J, Schnaudigel S, Huonker R, Becker L, Sohns JM, Dechent P, Klingner C, Witte OW (2008) Behavioral correlates of neg- ative BOLD signal changes in the primary somatosensory cortex. Neuro- image 41:1364 –1371.
Killackey HP, Gould HJ 3rd, Cusick CG, Pons TP, Kaas JH (1983) The re- lation of corpus callosum connections to architectonic fields and body surface maps in sensorimotor cortex of new and old world monkeys.
J Comp Neurol 219:384 – 419.
Klingner CM, Huonker R, Flemming S, Hasler C, Brodoehl S, Preul C, Bur- meister H, Kastrup A, Witte OW (2011) Functional deactivations: mul- tiple ipsilateral brain areas engaged in the processing of somatosensory information. Hum Brain Mapp 32:127–140.
Koch G, Cercignani M, Bonn ì S, Giacobbe V, Bucchi G, Versace V, Caltagi- rone C, Bozzali M (2011) Asymmetry of parietal interhemispheric con- nections in humans. J Neurosci 31:8967– 8975.
Krubitzer LA, Kaas JH (1990) The organization and connections of somato- sensory cortex in marmosets. J Neurosci 10:952–974.
Le Bihan D (2003) Looking into the functional architecture of the brain with diffusion MRI. Nat Rev Neurosci 4:469 – 480.
Liu H, Schimpf PH, Dong G, Gao X, Yang F, Gao S (2005) Standardized shrinking LORETA-FOCUSS (SSLOFO): a new algorithm for spatio- temporal EEG source reconstruction. IEEE Trans Biomed Eng 52:1681–1691.
Manzoni T, Conti F, Fabri M (1986) Callosal projections from area SII to SI in monkeys: anatomical organization and comparison with association projections. J Comp Neurol 252:245–263.
Mauguie`re F, Merlet I, Forss N, Vanni S, Jousma¨ki V, Adeleine P, Hari R (1997) Activation of a distributed somatosensory cortical network in the human brain. A dipole modelling study of magnetic fields evoked by median nerve stimulation. Part I. Location and activation timing of SEF sources. Electroencephalogr Clin Neurophysiol 104:281–289.
Mima T, Ikeda A, Nagamine T, Yazawa S, Kunieda T, Mikuni N, Taki W,