CHAPTER Ⅳ Ⅳ Ⅳ Ⅳ RESEARCH FINDINGS
This chapter illustrates findings and analysis from the data collection based on the purposes of the study. The data was collected via Delphi technique with 12 experts who engaged in human resource management in domestic life insurance companies.
Constructing Key Performance Indicators on Human Resource Management
This section illustrates four rounds of data collection, including mode represents most experts’ opinions, mean score represents the importance of KPIs on HRM, standard deviation (S.D.) represent the consensus degree of participants, quartile deviation (Q.D.) represent experts’ consensus and rank order by its mean score of each KPI.
The questionnaire return rate of this study is 67%, 100%, 100% and 100%
respectively for round 1 to round 4 as shown in table 4.1. Besides, this study seeks to identify the importance of each KPI from the expert panel’s point of view, reach the consensus after three rounds of discussion through questionnaire and construct an instrument of KPI on HRM which is significant and meaningful to represent the importance and availability of it and is able to be conducted among insurance companies in Taiwan.
The KPIs on HRM in this study is divided into six categories, including labor
costs coded as A, recruiting indicator coded as B, retention indicator coded as C, HRD
indicator coded as D, benefit cost coded as E and employee relations coded as F.
Table 4.1 The Return Rate of Questionnaire
Round Mail-Out Copies Return Copies Return Rate
1 18 12 67%
2 12 12 100%
3 12 12 100%
4 12 12 100%
Statistical Result of Round One
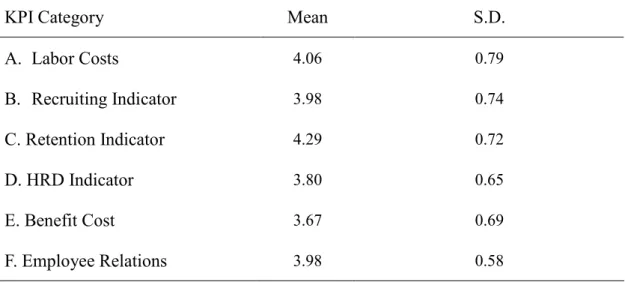
From the result of first round questionnaire, retention indicator and labor costs relatively deemed as the highly important KPIs category among the six ones with average that their averages mean score reach upon 4, while benefit cost gets lower mean score in this round. The standard deviation is aroud 0.6 to 0.7. The detail information is listed in table 4.2
Table 4.2 Mean and S.D. Comparison of KPI Category for Round 1
KPI Category Mean S.D.
A. Labor Costs
B. Recruiting Indicator C. Retention Indicator D. HRD Indicator E. Benefit Cost
F. Employee Relations
4.06 3.98 4.29 3.80 3.67 3.98
0.79 0.74 0.72 0.65 0.69 0.58
As for each KPI under each category, appendix H illustrates mode, mean score, standard deviation (S.D.), quartile deviation (Q.D.) and ranker order by its mean score in the first round of data collection.
From appendix H, we can find that participants’ are relatively with low
consensus in the category E. Benefit Cost, there are six KPI out of 12 with Q.D. equal to 1. While in other categories, the participants almost reach consensus in each KPI (Q.D.≦0.6). Besides, The KPIs which are deemed as important (M≧3.75) in the first round of questionnaire are as follows,
Labor costs: A1, A2, A3, A4, A5, A6.
Recruiting indicator: B1, B2, B3, B4, B5, B6.
Retention indicator: C1, C2, C3, C4.
HRD indicator: D1, D2, D4, D5, D9, D10, D11.
Benefit cost: E1, E6, E7, E8, E11.
Employee relations: F1, F2, F3, F4, F5, F6, F9.
Statistical Result of Round Two
From data collection of round one, the panel added 5 KPIs. The researcher added those 5 KPIs into questionnaire round 2, which were as followings:
A7: employee quantity growth rate divide revenue growth rate A8: pay-to-grade
A9: employee’s age distribution rate
D15: the ratio of employee fully understanding the item of assessment F10: employee’s satisfaction toward executives
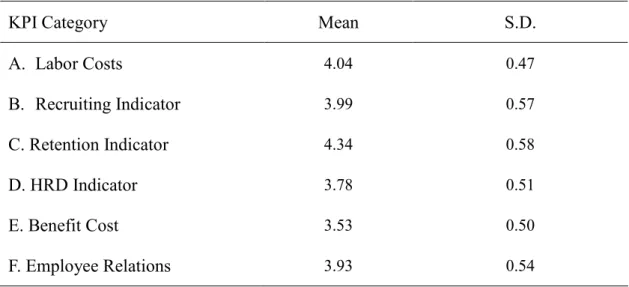
Among those six KPIs categories, the average mean score is quite the same as
round one. Table 4.3 is the mean score and standard deviation of six KPIs categories
in round two.
Table 4.3 Mean and S.D. Comparison of KPI Category for Round 2
KPI Category Mean S.D.
A. Labor Costs
B. Recruiting Indicator C. Retention Indicator D. HRD Indicator E. Benefit Cost
F. Employee Relations
4.04 3.99 4.34 3.78 3.53 3.93
0.47 0.57 0.58 0.51 0.50 0.54
The KPIs which are deemed as important (M≧3.75) in the second round of questionnaire are as follows,
Labor cost: A1, A2, A3, A4, A5, A7, A8, A9.
Recruiting indicator: B1, B2, B3, B4, B5, B6.
Retention indicator: C1, C2, C3, C4.
HRD indicator: D1, D2, D4, D5, D10, D11, D14.
Benefit cost: E1, E6, E8, E11.
Employee relations: F1, F2, F3, F4, F5, F6, F9, F10.
From appendix I, we can find that the panel had the tendency to reach the
consensus than the first round, only the KPI E-7 had the Q.D. ≧1. Other detail
information is listed in the appendix I.
Statistical Result of Round Three
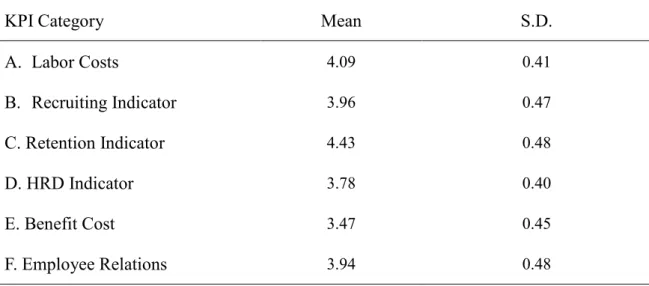
From the data collection of round three, the average mean score is similar to the second round, the mean score just had slightly change, the detail information is listed in table 4.4.
Table 4.4 Mean and S.D. Comparison of KPI Category for Round 3
KPI Category Mean S.D.
A. Labor Costs
B. Recruiting Indicator C. Retention Indicator D. HRD Indicator E. Benefit Cost
F. Employee Relations
4.09 3.96 4.43 3.78 3.47 3.94
0.41 0.47 0.48 0.40 0.45 0.48
The KPIs which are deemed as important (M≧3.75) in the third round of questionnaire are as follows,
Labor costs: A1, A2, A3, A4, A5, A7, A8, A9.
Recruiting indicator: B1, B2, B4, B5, B6.
Retention indicator: C1, C2, C3, C4.
HRD indicator: D1, D2, D3, D4, D5, D10, D11, D14, D15.
Benefit cost: E1, E8, E10, E11.
Employee relations: F1, F2, F3, F4, F5, F6, F9, F10.
Other detail information is listed in the appendix I.
Comparison of the Statistical Result of each KPI for Three Rounds
Through the comparison of the statistical result of each KPI category for three rounds data collection, the tendency of how panel looks upon each KPI will be easily and clearly shown from the table. Table 4.5 to table 4.10 reveals the mean score, S.D.
and Q.D for the third round of each KPI category.
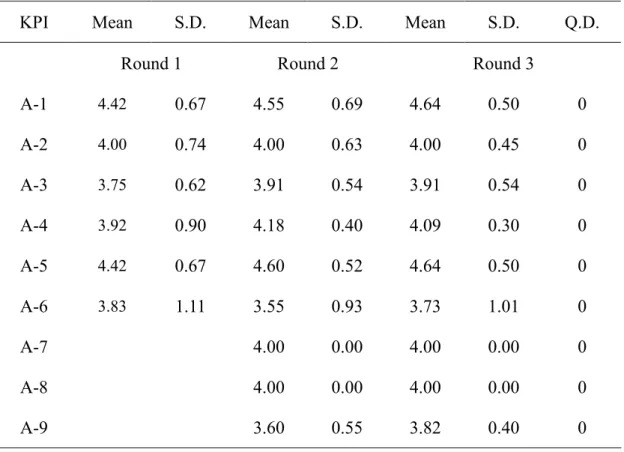
From table 4.5, except A-6, all the KPIs’ mean score reach the standard (M≧3.75), besides, all the KPIs in this category reach the consensus (Q.D. ≦0.6).
Besides, A-1, A-5 and A-9 got higher mean score in every round of data collection;
A-1 and A-5 were also looked upon the most important two KPIs in this category. The detail information is presented in table 4.5.
Table 4.5 Comparison of the Statistical Result from Three Rounds Data Collection of each KPI in the Category A. Labor Costs
KPI Mean S.D. Mean S.D. Mean S.D. Q.D.
Round 1 Round 2 Round 3
A-1
4.420.67 4.55 0.69 4.64 0.50 0
A-2
4.000.74 4.00 0.63 4.00 0.45 0
A-3
3.750.62 3.91 0.54 3.91 0.54 0
A-4
3.920.90 4.18 0.40 4.09 0.30 0
A-5
4.420.67 4.60 0.52 4.64 0.50 0
A-6
3.831.11 3.55 0.93 3.73 1.01 0
A-7 4.00 0.00 4.00 0.00 0
A-8 4.00 0.00 4.00 0.00 0
A-9 3.60 0.55 3.82 0.40 0
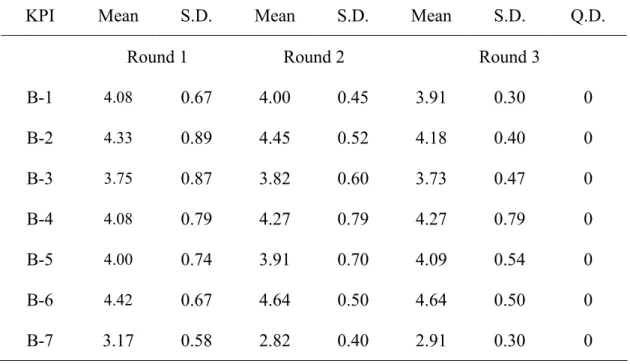
From table 4.6, the Q.D. of round three shows that the expert panel’s opinions reach the consensus. B-3 and B-7 fail to reach the standard by their mean score; other information is listed as follows.
Table 4.6 Comparison of the Statistical Result from Three Rounds Data Collection of each KPI in the Category B. Recruiting Indicator
KPI Mean S.D. Mean S.D. Mean S.D. Q.D.
Round 1 Round 2 Round 3
B-1
4.080.67 4.00 0.45 3.91 0.30 0
B-2
4.330.89 4.45 0.52 4.18 0.40 0
B-3
3.750.87 3.82 0.60 3.73 0.47 0
B-4
4.080.79 4.27 0.79 4.27 0.79 0
B-5
4.000.74 3.91 0.70 4.09 0.54 0
B-6
4.420.67 4.64 0.50 4.64 0.50 0
B-7 3.17 0.58 2.82 0.40 2.91 0.30 0
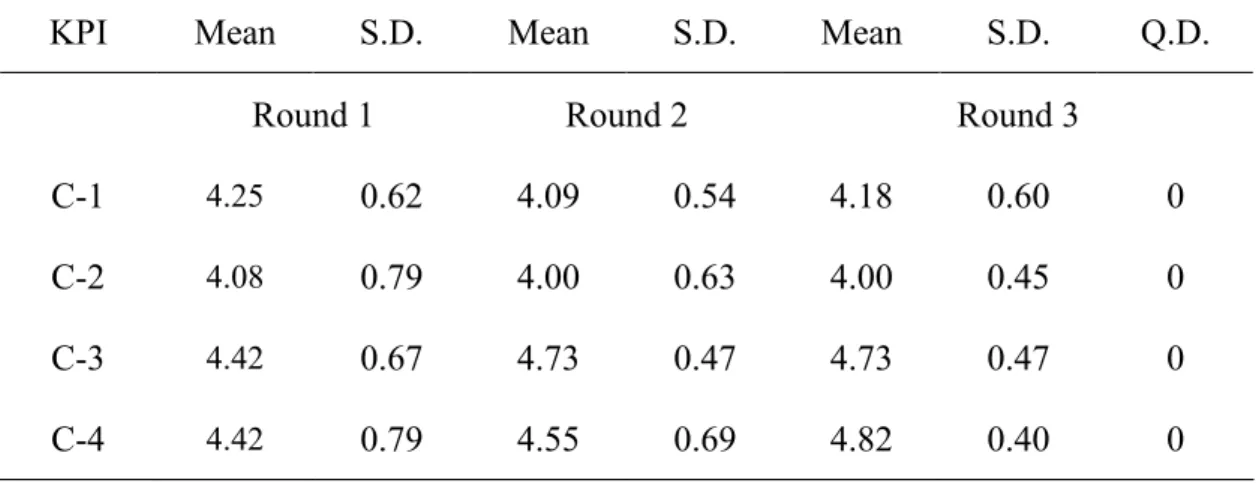
From table 4.7, the Q.D. of round three shows that the expert panel’s opinions reach the consensus. All the KPIs reach the standard by their mean score; other information is listed as follows.
Table 4.7 Comparison of the Statistical Result from Three Rounds Data Collection of each KPI in the Category C. Retention Indicator
KPI Mean S.D. Mean S.D. Mean S.D. Q.D.
Round 1 Round 2 Round 3
C-1
4.250.62 4.09 0.54 4.18 0.60 0
C-2
4.080.79 4.00 0.63 4.00 0.45 0
C-3
4.420.67 4.73 0.47 4.73 0.47 0
C-4
4.420.79 4.55 0.69 4.82 0.40 0
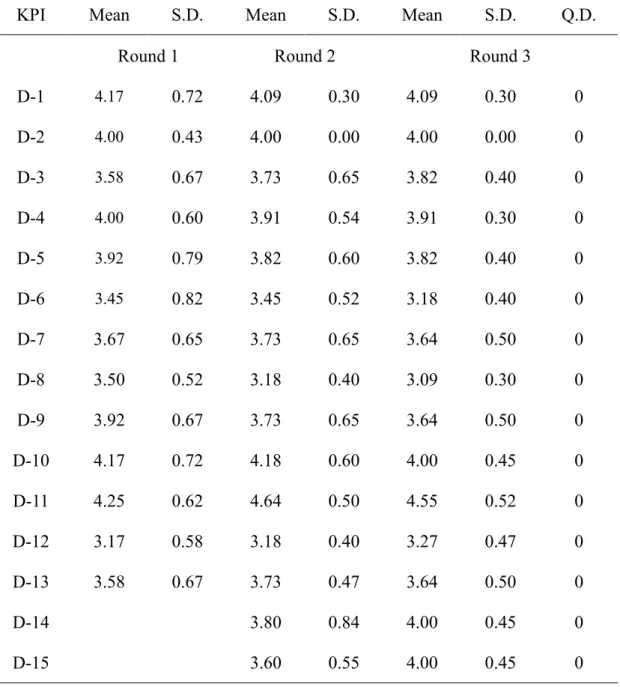
From table 4.8, the experts reach the consensus based on the Q.D. of the third round; D-3, D-12, D-14 and D-15 had the tendency to get higher mean score than the previous round, while D-8 and D-9 and obviously tendency to get lower means score than previous round; other information is listed as follows.
Table 4.8 Comparison of the Statistical Result from Three Rounds Data Collection of each KPI in the Category D. HRD Indicator
KPI Mean S.D. Mean S.D. Mean S.D. Q.D.
Round 1 Round 2 Round 3
D-1
4.170.72 4.09 0.30 4.09 0.30 0
D-2
4.000.43 4.00 0.00 4.00 0.00 0
D-3
3.580.67 3.73 0.65 3.82 0.40 0
D-4
4.000.60 3.91 0.54 3.91 0.30 0
D-5
3.920.79 3.82 0.60 3.82 0.40 0
D-6
3.450.82 3.45 0.52 3.18 0.40 0
D-7 3.67 0.65 3.73 0.65 3.64 0.50 0
D-8 3.50 0.52 3.18 0.40 3.09 0.30 0
D-9 3.92 0.67 3.73 0.65 3.64 0.50 0
D-10 4.17 0.72 4.18 0.60 4.00 0.45 0
D-11 4.25 0.62 4.64 0.50 4.55 0.52 0
D-12 3.17 0.58 3.18 0.40 3.27 0.47 0
D-13 3.58 0.67 3.73 0.47 3.64 0.50 0
D-14 3.80 0.84 4.00 0.45 0
D-15 3.60 0.55 4.00 0.45 0
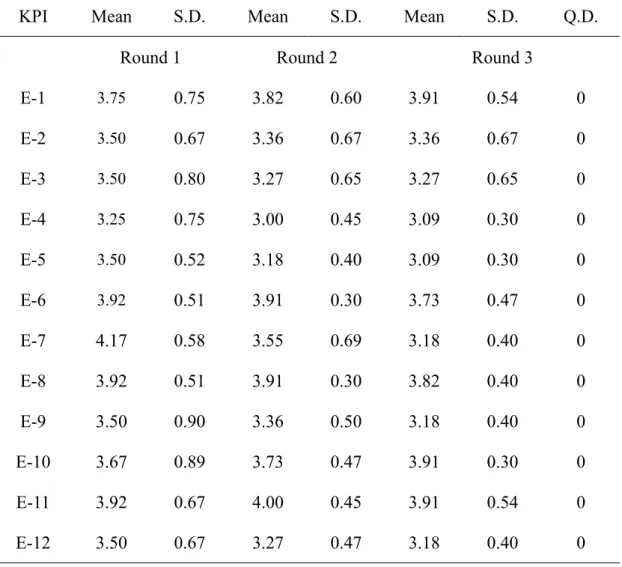
From table 4.9, the experts reach the consensus based on the Q.D. of the third round. Besides, no mean score of KPIs in this category higher than 4, it reveals that experts’ relatively pay less attention to this category. Other information is presented as follows.
Table 4.9 Comparison of the Statistical Result from Three Rounds Data Collection of each KPI in the Category E. Benefit Cost
KPI Mean S.D. Mean S.D. Mean S.D. Q.D.
Round 1 Round 2 Round 3
E-1
3.750.75 3.82 0.60 3.91 0.54 0
E-2
3.500.67 3.36 0.67 3.36 0.67 0
E-3
3.500.80 3.27 0.65 3.27 0.65 0
E-4
3.250.75 3.00 0.45 3.09 0.30 0
E-5
3.500.52 3.18 0.40 3.09 0.30 0
E-6
3.920.51 3.91 0.30 3.73 0.47 0
E-7 4.17 0.58 3.55 0.69 3.18 0.40 0
E-8 3.92 0.51 3.91 0.30 3.82 0.40 0
E-9 3.50 0.90 3.36 0.50 3.18 0.40 0
E-10 E-11 E-12
3.67 3.92 3.50
0.89 0.67 0.67
3.73 4.00 3.27
0.47 0.45 0.47
3.91 3.91 3.18
0.30 0.54 0.40
0
0
0
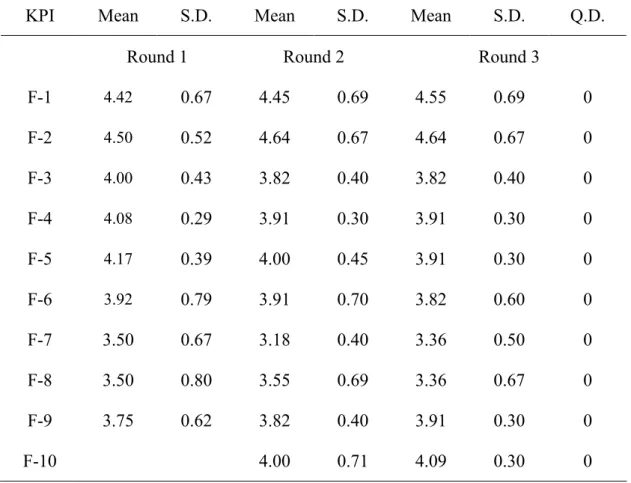
From table 4.10, the Q.D. of round three shows that the expert panel’s opinions reach the consensus. All the KPIs reach the standard by their mean score except F-7 and F-8; other information is listed as follows.
Table 4.10 Comparison of the Statistical Result from Three Rounds Data Collection of each KPI in the Category F. Employee Relations
KPI Mean S.D. Mean S.D. Mean S.D. Q.D.
Round 1 Round 2 Round 3
F-1
4.420.67 4.45 0.69 4.55 0.69 0
F-2
4.500.52 4.64 0.67 4.64 0.67 0
F-3
4.000.43 3.82 0.40 3.82 0.40 0
F-4
4.080.29 3.91 0.30 3.91 0.30 0
F-5
4.170.39 4.00 0.45 3.91 0.30 0
F-6
3.920.79 3.91 0.70 3.82 0.60 0
F-7 3.50 0.67 3.18 0.40 3.36 0.50 0
F-8 3.50 0.80 3.55 0.69 3.36 0.67 0
F-9 3.75 0.62 3.82 0.40 3.91 0.30 0
F-10 4.00 0.71 4.09 0.30 0
The Instrument of Key Performance Indicators on Human Resource Management among Insurance Companies in Taiwan
Constructing the Instrument of KPIs on Human Resource Management
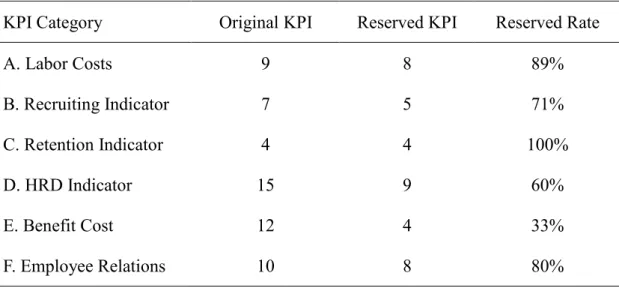
From three rounds of data collection, the researcher reserves the KPIs which are deemed as importantly and practically (M≧3.75) and also reaches the consensus (Q.D.≦0.6) of the third round by experts. There are totally 38 KPIs reserved out of 57, including 8 from A. Labor Costs, 5 from B. Recruiting Indicator, 4 from C.
Retention Indicator, 9 from D. HRD indicator, 4 from E. Benefit Cost and 8 from F.
Employee Relations. The detail quantity includes original KPIs, reserved KPIs and the percentage of reserved rate of each KPI category is presented in table 4.11, while those reserved KPIs are presented in table 4.12.
Table 4.11 Reserved Rate of KPI Category
KPI Category Original KPI Reserved KPI Reserved Rate
A. Labor Costs 9 8 89%
B. Recruiting Indicator 7 5 71%
C. Retention Indicator 4 4 100%
D. HRD Indicator 15 9 60%
E. Benefit Cost 12 4 33%
F. Employee Relations 10 8 80%
Table 4.12 Reserved KPIs on HRM from Three Rounds of Data Collection
KPI Mean Q.D.
A. Labor Costs
A-1
4.64 0A-2
4.00 0A-3
3.91 0A-4
4.09 0A-5
4.64 0A-7
4.00 0A-8
4.00 0A-9
3.82 0B. Recruiting Indicator
B-1
3.91 0B-2
4.18 0B-4
4.27 0B-5
4.09 0B-6
4.64 0C. Retention Indicator
C-1
4.18 0C-2
4.00 0C-3
4.73 0C-4
4.82 0D. HRD Indicator
D-1
4.09 0D-2
4.00 0KPI Mean Q.D.
D-3
3.82 0D-4
3.91 0D-5 3.82
0D-10
4.00 0D-11
4.55 0D-14
4.00 0D-15
4.00 0E. Benefit Cost
E-1
3.91 0E-8
3.82 0E-10
3.91 0E-11
3.91 0F. Employee Relations
F-1
4.55 0F-2
4.64 0F-3
3.82 0F-4
3.91 0F-5
3.91 0F-6
3.82 0F-9
3.91 0F-10
4.09 0After the KPIs are selected after three rounds of data collection via Delphi technique, the researcher develops an instrument of KPIs on HRM among insurance company in Taiwan. The information of the instrument includes the following information,
1. KPIs, which is generalized from the opinions of expert panel 2. goal, which should be decided by the user of this instrument
3. subject, including “all employees”, “executives” or “specific subjects” which are difficult to generalize,
4. achieve, including “yes” or “no” to show whether the KPI is achieved or not afterwards
5. result, showing the result of the KPI
6. evaluation, to examine the relationship between the goal and the result
7. description, at the each page of the instrument, the researcher lists the description about how to use the instrument
Besides, the researcher designs a questionnaire for collecting the opinions from experts’ point of views about the instrument as the fourth round of data collection, the purposes of the questions plan to ensure the experts understand each item of the instrument and the context of the instrument is appropriate to apply among insurance companies in Taiwan to meet the purposes of this study. 9 questions of the instrument in the fourth round data collection and coded numbers are as followings, the instrument and the questionnaire is present in appendix K and appendix L.
1. Have clear ideas about how to use this “Instrument of KPIs on HRM” coded
as Q1
and understandable coded as Q2
3. The arrangement of this “Instrument of KPIs on HRM” meets your expectation coded as Q3
4. Clearly understand the meaning of each column coded as Q4 5. Clear understand the meaning of each KPI coded as Q5
6. The categories of this “Instrument of KPIs on HRM” cover every needed function coded as Q6
7. This “Instrument of KPIs on HRM” meets the practical needs coded as Q7 8. This “Instrument of KPIs on HRM” reflects the needs of human resource
management coded as Q8
9. Overall, this “Instrument of KPIs on HRM” is practical and meets the expectation coded as Q9
As for the information of the statistical result of the fourth round data collection,
appendix L shows the mean score, S.D, Q.D. of all questions. The mean score of
every question is higher than 4 (agree), all the Q.D. are under 0.6 which means the
experts reach the consensus, other detail information is presented in appendix M.
Discussion
The findings of the Delphi technique will be further discussed in this section, including the comparison of each KPI category and the reserved KPIs of the instrument.
Comparison of each KPI category from three rounds data collection
From table 4.13, the overall mean score for the three rounds data collection didn’t change a lot. A. Labor Costs and C. Retention Indicator had the obviously higher tendency than previous rounds, while E. Benefit Cost, had the obviously tendency to get lower than previous rounds among the six categories. The detail statistical result is presented as follows.
Table 4.13 The Mean Score of the Statistical Result of Three Rounds data collection
KPI Category Round 1 Round 2 Round 3
Mean Mean Mean
A. Labor Costs
B. Recruiting Indicator C. Retention Indicator D. HRD Indicator E. Benefit Cost
F. Employee Relations
4.06 3.98 4.29 3.80 3.67 3.98
4.04 3.99 4.34 3.78 3.53 3.93
4.09 3.96 4.43 3.78 3.47 3.94