行政院國家科學委員會專題研究計畫 成果報告
低收縮不飽和聚酯樹脂在聚合固化中之微孔洞生成、本質聚 合收縮及反應動力之研究
計畫類別: 個別型計畫
計畫編號: NSC92-2216-E-011-014-
執行期間: 92 年 08 月 01 日至 93 年 07 月 31 日 執行單位: 國立臺灣科技大學化學工程系
計畫主持人: 黃延吉
計畫參與人員: 黃兆緯同學、吳政潔同學、陳紹偉同學、馬鈞奎同學、董志平 同學
報告類型: 精簡報告
處理方式: 本計畫涉及專利或其他智慧財產權,2 年後可公開查詢
中 華 民 國 93 年 11 月 2 日
行政院國家科學委員會補助專題研究計畫成果報告
※※※※※※※※※※※※※※※※※※※※※※※※※
※低收縮不飽和聚酯樹脂在聚合固化中之微孔洞生成、※
※本質聚合收縮及反應動力之研究 ※
※※※※※※※※※※※※※※※※※※※※※※※※※
計畫類別:ˇ個別型計畫 □整合型計畫 計畫編號:NSC 92-2216-E-011-014
執行期間:92 年 8 月 1 日至 93 年 7 月 31 日 計畫主持人:黃延吉教授
共同主持人:
計畫參與人員:黃兆緯同學、吳政潔同學、陳紹偉同學、馬鈞奎 同學、董志平同學
成果報告類型(依經費核定清單規定繳交):ˇ精簡報告 本成果報告包括以下應繳交之附件:
□赴國外出差或研習心得報告一份
□赴大陸地區出差或研習心得報告一份
□出席國際學術會議心得報告及發表之論文各一份
□國際合作研究計畫國外研究報告書一份
處理方式:除產學合作研究計畫、提升產業技術及人才培育研 究計畫、列管計畫及下列情形者外,得立即公開查詢
□涉及專利或其他智慧財產權,□一年 ˇ二年後 可公開查詢
執行單位:台灣科技大學化工系
中華民國 93 年 10 月 30 日
1
計劃名稱:低收縮不飽和聚酯樹脂在聚合固化中之微孔洞生成、本質聚合收縮及反應動力之 研究
Investigation of Microvoid Formation, Intrinsic Polymerization Shrinkage, and Reaction Kinetics in the Cure of Low-Shrink Unsaturated Polyester Resins
計劃編號:NSC92-2216-E-011-014 執行期限:92/8/1 – 93/7/31
計劃主持人:黃延吉教授
執行機構:台灣科技大學化工系
中文摘要
本計劃探討不同分子量之聚醋酸乙烯 (PVAc)型抗收縮劑(LPA)
對低收縮不飽和聚酯樹脂(UP)其高溫 110oC 聚合固化過程中樣品之微孔
洞生成、本質聚合收縮及反應動力之影響。實驗結果,吾人以 DSC、
SEM、OM、影像分析、原子力顯微鏡(AFM)、動態機械測定(DMA)、
熱剌激去極化電流分析 (TSC)、及萬能機械測試之整合性測量,包括苯 乙烯(ST)/ UP/ LPA 三成份系在未反應前之相溶性、聚合固化反應動力、
聚合固化反應後之樣品破壞面之微觀型態結構、聚合固化過程中所生成 的微孔洞体積分率及大小分佈、聚合固化後樣品的玻璃轉移溫度、及機 械性質,解釋之。根據 Takayanagi 機械模式,聚合固化後的加工成品可 同時獲致良好的体積收縮控制及可接受的內部可染性色的因素,在文中 亦有探討。
關鍵詞:聚醋酸乙烯;抗收縮劑;不飽和聚酯樹脂;聚合固化;微孔洞;
反應動力;原子力顯微鏡;体積收縮特性;內部可染色性
ABSTRACT
The effects of poly(vinyl acetate) with different molecular weights as low-profile additives (LPA) on the microvoid formation, intrinsic polymerization shrinkage and reaction kinetics for low-shrink unsaturated polyester resins (UP) during the cure at 110oC were investigated. The experimental results have been explained by an integrated approach of measurements for the static phase characteristics of the styrene (ST)/UP/LPA system, reaction kinetics, cured sample morphology, volume fraction and size distribution for the microvoid formed during the cure,glass transition temperatures for the cured samples, and mechanical properties by using differential scanning calorimetry (DSC), scanning electron microscopy (SEM), optical microscopy (OM), image analysis, atomic force microscopy (AFM), methods of dynamic mechanical analysis (DMA), the method of thermally stimulated current (TSC), and a universal testing machine. Based on the Takayanagi mechanical model, factors leading to both a good volume shrinkage control and acceptable internal pigmentability for the molded parts have been explored.
Keywords: poly(vinyl acetate), low-profile additive (LPA); unsaturated
polyester resins (UP); curing; microvoid; reaction kinetics; atomic force microscope (AFM); volume shrinkage; pigmentabilityINTRODUCTION
Adding specific thermoplastic polymers as low profile additives (LPA) in the unsaturated polyester resins (UP) can lead to a reduction or even elimination of the polymerization shrinkage during the cure1. However, low-profile polyester molding compounds when formulated with pigments may usually exhibit an unacceptable hazing of the pigment's color. In recent years, unique non-reactive LPAs for high temperature applications have been developed2 that give significantly improved deep color pigmentation while maintaining a smooth surface and zero shrinkage, yet the fundamental principle has not been treated. Most recently, Huang et al 3 have studied the effects of volume fraction and average size of microvoid generated during the cure of ST/UP/LPA systems on the volume shrinkage characteristics and internal pigmentability. Three factors in microvoid formation, including the polymerization strain in the crosslinked polyester phases, the interfacial area between the LPA-rich phase and the crosslinked UP phase, and the yield strain for the LPA-rich phase, were proposed.
Since they employed the image analysis method on OM micrographs, only relative volume fraction of microvoids can be measured. Also, the size distribution of microvoids was unable to be measured.
In a study of carbon black filled polyethylene conductive composites, Oakey et al4 demonstrated that atomic force microscopy (AFM) can be used to identify void size and absolute volume fraction of microvoids through a comparison of complementary height and phase impages.
The objective of this work is to investigate the effects of poly(vinyl acetate) types of LPA and their molecular weights on the microvoid formation, intrinsic polymerization shrinkage and reaction kinetics for styrene(ST)/UP/LPA ternary systems cured at 110oC. Above all, the atomic force microscopy (AFM) has been used to identify size distribution and absolute volume fraction of microvoids. Glass transition temperatures by DMA and TSC and mechanical properties of the cured samples have also been studied.
EXPERIMENTAL
Materials. The molecular characteristics of poly(vinyl acetate) types
of LPAs synthesized by suspension polymerizations3,5 are summarized in Table 1.The UP resin5-6 was made from maleic anhydride (MA), 1,2-propylene glycol (PG), and phthalic anhydride (PA) with a molar ratio of 0.62:1.28:0.38. The acid number and hydroxyl number were found to be 28.5 and 30.3 by end-group titration, which gives an Mn of 1910 g/mole.
For the sample solution, 10% by wt. of LPA was added, while the molar ratio of styrene to polyester C=C bonds was fixed at MR = 2/1. The reaction was initiated by 1% by wt. of tert-butyl perbenzoate (TBPB). For the sample solution with pigments, 10% by wt. of Bordeaux Red was added as pigments. All the cure reactions were carried out at 110oC isothermally for 1 hr.
Instrumentation and Procedure. The compatibility of ST/UP/LPA
systems at 25oC prior to reaction6, cure kinetics of the ternary systems by DSC7-8, cured sample morphology for the fractured surface by SEM9, and cured sample morphology by optical microscopy (OM)9 have been investigated. The relative quantity of microcracking in the morphology sample under OM was also measured by means of an image analyzer9. Volume shrinkage and color depth2 of the cured sample were measured by density methods9 and by using a chromameter (Minolta, CR-300) respectively.The absolute quantity of microvoids for the cured ST/UP/LPA systems was measured by AFM method4,10, where the area method was employed for the determination of volume fraction of microvoids, and the line segment method for the size distribution of microvoids. The details can be found elsewhere10.
For the measurement of the glass-transition temperatures for the fully cured samples (i.e. cured at 110oC for 1 h, followed by a postcure at 150oC for 1 h), dynamic mechanical analysis (DMA)10-11 and the method of stimulated currents (TSC)8,12-13 measurements have been carried out.
Impact strength and tensile properties of the fully cured samples have also been measured10-11.
RESULTS AND DISCUSSION
Interrelationship Between the Polarity Difference of UP and LPA and the Compatibility of Styrene/UP/LPA Systems. The molecular
polarity of UP resin and LPA was evaluated in terms of the calculated dipole moment per unit volume6,µ
/V1/2 (Table 2). In general, the higher the polarity difference per unit volume between UP and LPA, the less compatibility for the ST/UP/LPA system at 25oC prior to reaction. In this work, only one type of LPA (i.e. PVAc) was employed. Data in Table 3 reveal that all of the ternary systems containing PVAc as an LPA remained a single homogeneous phase after the phase equilibrium at 25oC. It was also true of the ternary systems at 110oC prior to the reaction5.Compatibility of Styrene/UP/LPA Systems During the Cure. During
the cure at 110oC, SEM micrographs10 showed that the sample solution containing no LPA exhibited a flake-like microstructure (not shown). For all of the ST/UP/LPA systems containing 10% PVAc irrespective of its molecular weight, the cured sample exhibited a homogeneous globule morphology. Except the PVAc2S system, which was the least compatible among the four systems, adding an LPA with a higher molecular weight cancause a less compatible ST/UP/LPA system, with the precipitation of microgel particles being more clearly identified. Adding a higher molecular weight of LPA can also lead to the increase in viscosity for the ST/UP/LPA system, and the phase separation rate during the cure may then be slowed down. The reason why the PVAc3S and PVAc4S systems were more compatible than the PVAc2S system is due to the effect of increasing viscosity (increasing phase separation time) predominating over the effect of decreasing compatibility (increasing the degree of phase separation) for the former systems with higher LPA molecular weights.
Relationship Between Morphologies and Mechanical Properties – the Takayanagi Models. For the cured LPA-containing UP resin systems
with their characteristic morphologies, their mechanical behavior can be approximately represented by the Takayanagi models11, where arrays of weak LPA (R) and stiff styrene-crosslinked polyester (P) phases are employed (Fig. 1). For all of the four ST/UP/PVAc systems, the globule microstructure may be represented by the P-P-S model (Fig. 1(a)). The microgel particles (P1 phase) are surrounded by a layer of LPA (R phase).Between the LPA-covered microgel particles there are some lightly St-crosslinked polyesters chains and polystyrene chains (taken together as the P2 phase), which have different compositions of St and UP than those in the P1 phase, that are dispersed in the LPA phase (R phase). Hence, the characteristic globule microstructure may be represented by the parallel-parallel-series (P-P-S) model as shown in Fig. 1(a). In contrast, for the ST/UP/LPA systems with PMMA as an LPA, a two-phase microstructure would arise14, which can be represented by a P-(P-P-S) model (Fig. 1(b)).
Cure Kinetics. For the ST/UP/PVAc systems, except for the PVAc4S
system, the DSC rate profile showed that the peak reaction rate was higher than that of the neat UP resin system. (not shown) The final cure conversion of C=C bonds was lower for all the PVAc-containing samples than for the neat UP resin system. (Table 3) Also, the least compatible PVAc2S system possessed the lowest final cure conversion.Effects of LPA on Volume Shrinkage After the Cure. The volume
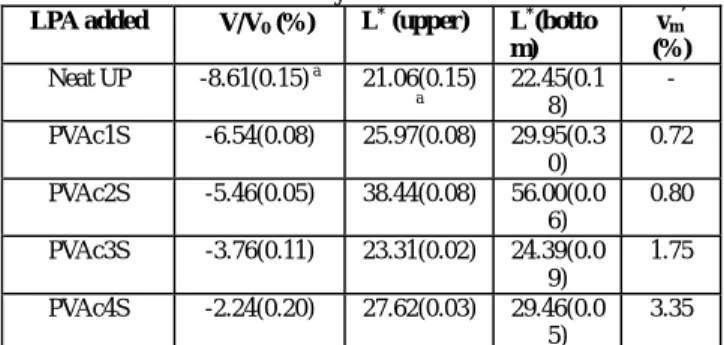
shrinkage of the neat UP resin was about 8.6%, whereas adding PVAc types of LPAs with different molecular weights can generally reduce the volume shrinkage to about –2.0% to –6.5% (Table 4). Increasing the molecular weight of LPA can lead to a lower fractional volume shrinkage. The PVAc4S system possessed the best volume shrinkage control among the four ST/UP/LPA systems. (∆V/V0 = -2.2%)Effects of LPA on Internal Pigmentability After the Cure. Adding
PVAc types of LPA may lead to a higher L* value, and hence worse internal pigmentability for ST/UP/LPA systems after the cure. (The higher the L* value, the worse the internal pigmentability.) Since an L* value within about 30 can be employed as the acceptable upper bound for good internal pigmentability in this study, except the most incompatible PVAc2S system, all of the systems exhibit good internal pigmentability (Table 4). Among the four ST/UP/LPA systems containing PVAc as an LPA, the PVAc4S system has provided the best volume shrinkage control (∆V/V0≅ -2.2%),
and achieved acceptable internal pigmentability (L*≅
28-29)..Effects of Microvoid Formation and Intrinsic Polymerization on Volume Shrinkage and Internal Pigmentability. Pattison et al.
15 have proposed that as the crosslinking of LPA-containing UP resins proceeds, strain due to polymerization shrinkage develops in the system, particularly at the interface of LPA phase (phase R) and crosslinked UP phase (phase P).This strain can increase to the point that stress cracking propagates through the weak LPA phase, relieving this strain, forming microcracks and/or microvoids, and compensating for the overall volume shrinkage by the microcrack or microvoid space. For the ST/UP/LPA system containing PVAc as an LPA, the relative volume fraction of microvoid data, vm’, in Table 4, as measured by the image analysis method on OM micrographs, show that the higher the vm’, the lower the fractional volume shrinkage, which has supported the volume shrinkage compensation through strain relief mentioned above.
Besides microvoid formation, the intrinsic polymerization shrinkage9 is also important in determining the volume shrinkage control during the cure of ST/UP/LPA system. This is especially true of the ST/UP/LPA system with a reactive LPA, which will not be discussed in this report.
The microvoid formation is intimately connected with the internal pigmentability2. As incident light enters an internally pigmented part of the cured ST/UP/LPA system, the intensity of reflective light to the pigment can be greatly reduced due to the severe light scattering which may occur at the solid/air (microvoid) interface inside the parts, leading to the hazing of a pigment’s color. In theory, the higher the volume fraction of microvoids, the worse the internal pigmentability. For the ST/UP/LPA system
containing PVAc as an LPA, except the PVAc1S and PVAc2S systems, the relative volume fraction of microvoid data shown in Table 4 agreed with the experimental results, where the system with a larger volume fraction of microvoids, such as the PVAc4S system, would lead to a worse internal pigmentability (i.e. a higher L* value).
In addition to the volume fraction of microvoids, the average size of microvoids is also influential for the internal pigmentability. It should be noted3 that when the average size of the microvoids becomes larger than 0.05-0.1
µm, which is about 1/10 to 1/5 of the wavelength of visible light
(wavelength of visible light = 0.45 – 0.75 µm), the light scattering caused by the microvoids would be more significant and the haziness of a pigment’s color could be more noticeable. Hence, the worst internal pigmentability for the PVAc2S system (Table 4) should be connected with the size distribution of microvoids despite its lower relative volume fraction of microvoids, which will be discussed later on.Size Distribution, Average Size, and Volume Fraction of Microvoids by AFM. For the cured ST/UP/LPA systems, the size distribution and the
average size of microvoids generated during the cure have been measured by AFM. This is in contrast with the method of image analysis on OM micrographs, which does not allow the size distribution of microvoids to be measured.Data in Table 5 (AFM pictures not shown) show that the average size of microvoids, sm, for the four ST/UP/LPA systems ranged from 0.19 to 0.27
µm. The s
m was the largest for the PVAc2S system, followed by the PVAc1S, the PVAc3S, and the PVAc4S systems, which was generally in agreement with the trend of increasing internal pigmentability (i.e.decreasing L* value). (Table 4) Besides, the higher percentage of microvoids in the bracket of 0.25-0.45 µm for the PVAc2S system (Table 5) would greatly enhance the light scattering between the air/solid interface of the cured samples, and hence can lead to the poor performance of internal pigmentability.
For the ST/UP/LPA systems, the volume fraction of microvoids, vm, measured by AFM ranged from 18 to 27% (Table 5), which would be way too high. It is anticipated that the method of small angle X-ray scattering (SAXS) can allow us to measure the size and volume fraction of microvoids accurately in the future. (A SAXS system will be installed in our university at the end of 2004.) Nevertheless, adding a higher molecular weight of LPA can lead to a higher vm (by AFM), which shows the same trend as that in Table 4 (by the image analysis method on OM micrographs).
Glass Transition Temperatures by DMA. Table 6 shows DMA results for
the cured neat UP resins withous LPA at varied MRs of St/polyester C=C bonds. Based on the tanδ curve of DMA (not shown), the maximum point at higher temperatures (Tg1α) can be identified as the glass-transition temperatures for the overall St-crosslinked polyester matrix whereas the shoulder at lower temperature (Tg1β) can be identified as theβ
relaxation temperatures16 for the polyester segments between the crosslinks alone. It is reported3 that the Tg1β may also be affected by the motion of the chain segment of the St bridge between the crosslinks.The Tg values displayed in Table 6 reveal that, as the MR increases, the Tg1α exhibits an increase followed by a decrease; it reaches a maximum at a 2/1 MR (Tg1α = 162.6oC), which is a trend similar to those reported in the literature3.
Table 6 also shows the DMA results for the cured UP resins containing 10 wt% PVAc as an LPA. We propose a P-P-S model (Fig. 1(a)) for all of the four compatible ST/UP/LPA systems. For the Tg listed in Table 6 for the ST/UP/LPA systems, Tg1α is the glass-transition temperature for the major continuous phase of the St-crosslinked polyester (i.e., phase P1, Fig. 1), Tg1β (oC) is the β relaxation temperature for the polyester segments between the crosslink in mainly the densely St-crosslinked polyester phase [i.e., phase P1, Fig. 1(a)], Tg2 is the glass-transition temperature for the LPA concontinuous phase [i.e., phase P2, Fig. 1(a)], and TgR is the glass-transition temperature of the R phase. For the PVAc systems represented by a P-P-S model, the value of Tg2 cannot be clearly identified by DMA, which may be superposed with Tg1β.
It is found that the Tg1α was higher for the ST/UP/LPA systems than that of the neat UP system at MR = 2/1. (162.8-173.3 oC vs. 162.6oC) It is ascribed to the fact7 that adding PVAc as an LPA may enhance the formation of microgel particles during the cure and the conversion of polyester C=C bonds may be increased, leading to a higher crosslinking density for the St-crosslinked network and hence a higher Tg1α.
Glass Transition Temperatures by TSC. Table 7 shows TSC results for the
cured neat UP resins withous LPA at varied MRs of St/polyester C=C bonds.The variation of Tg1α with MR shows the same trend as that of DMA in Table 6.
3
For the ST/UP/LPA systems, TSC results in Table 7 show that Tg2 can be identified, which ranged from 69 to 89oC. Increasing LPA molecular weight may generally result in a decrease in Tg2. It can be caused by the more pronounced phase separation and the higher styrene concentration in the LPA-rich phase (i.e. phase P2), leading to a less compact St-crosslinked polyester network for the P2 phase and hence a lower Tg2 therein.Based on the TSC results, Tg1α was also higher for the ST/UP/LPA systems than for the neat UP system at MR = 2/1 (i.e. 157.2-157.6oC vs 141.9oC) However, Tg1α was unable to be identified for the PVAc3S and the PVAc4S systems. It can be due to the relatively large volume fraction of microvoid generated in the cured sample (see Tables 4 and 5), which may greatly reduce the intensity of depolarization current in the TSC test below the sensitivity range of the TSC detector.
Mechanical Properties. Table 8 shows the impact strength and tensile
properties for ST/UP/LPA systems. Adding PVAc as an LPA may lead to a decrease in impact strength (ca. 10%), tensile strength (ca. 10-30%), and Young’s modulus (ca. 10-30%), as compared with those of the neat UP system at MR = 2/1. Among the four ST/UP/LPA systems, the most compatible PVAc1S system possessed the highest impact strength and tensile strength, yet the lowest Young’s modulus. The reverse trend was true of the least compatible PVAc2S system. Detailed explanations can be found elsewhere17.CONCLUSIONS
For ST/UP/LPA systems, the microvoid formation can affect both the volume shrinkage control and internal pigmentability for the cured sample.
In this work, by employing the PVAc4S type of LPA (Mn = 106000 g/mol; Tg
= 27.2oC) and the MA-PA-PG type of UP resin (with a molar ratio of 0.62:1.28:0.38 for MA, PG, and PA), a good volume shrinkage control (∆V/V0 = -2.2%), and acceptable pigmentability (L* = 28-29) for the molded parts have been achieved.
The atomic force microscopy (AFM) can be used to measure the size distribution, average size, and volume fraction of microvoids generated during the cure of ST/UP/LPA system. A higher LPA molecular weight can lead to a higher volume fraction of microvoids and hence a better volume shrinkage control. (PVAc4S > PVAc3S > PVAc2S > PVAc1S) Although the volume fraction of microvoids measured by AFM ranges from 18 to 27%, which is way too high, yet the volume fraction of microvoids measured by the indirect method of image analysis and the direct method of AFM shows the same trend. In the future work, it is suggested that the small angle X-ray scattering technique be applied to measure the volume fraction and the size distribution of microvoids for the ST/UP/LPA systems.
The average size of microvoids, sm, for the four ST/UP/LPA systems as measured by AFM ranged from 0.19 to 0.27 µm. The sm was the largest for the PVAc2S system, followed by the PVAc1S, the PVAc3S, and the PVAc4S systems, which was generally in agreement with the trend of increasing internal pigmentability (i.e. decreasing L* value). Besides, the higher percentage of microvoids in the bracket of 0.25-0.45 µm for the PVAc2S system would greatly enhance the light scattering between the air/solid interface of the cured samples, and hence can lead to the poor performance of internal pigmentability.
In addition to the DSC rate and conversion profiles for cure kinetics, the DMA and TSC results, which allow us to identify Tg in each phase region as a result of phase separation during the cure, have been useful for the in-depth analysis of the cure behavior of ST/UP/LPA systems.
REFERENCES
1. Atkins, K.E. In Sheet Molding Compounds: Science and Technology;
Kia, H.G., Ed.; Hanser Publishers: New York, 1993; Chapter 4.
2. Atkins, K.E.; Rex, G.C.; Reid, C.G.; Seats, R.L.; Candy, R.C. 47th Annu. Conf., Cincinnati, OH, Feb. 1992, 7-D.
3. Huang, Y.J.; Chen, T.S.; Huang, J.G.; Lee, F.H. J. Appl. Polym. Sci.
2003, 89, 3336.
4. Oakey, J.; Marr, D.W.M.; Schwartz, K.B.; Wartenberg, M.
Macromolecules 2000, 33, 5198.
5. Huang, J.W. M.S. Thesis, National Taiwan University of Science and Technology, 2004.
6. Huang, Y.J.; Jiang, W.C. Polymer 1998, 39, 6631.
7. Huang, Y.J.; Su, C.C. J. Appl. Polym. Sci. 1995, 55, 305.
8. Ma, J.K. M.S. Thesis, National Taiwan University of Science and Technology, 2004.
9. Huang, Y.J.; Liang, C.M. Polymer 1996, 37, 401.
10. Chen, S.W. M.S. Thesis, National Taiwan University of Science and Technology, 2004.
11. Huang, Y.J.;Horng, J.C. Polymer 1998, 39, 3683.
12. Ibar, J.P. Fundamentals of Thermal Stimulated Current and Relaxation Map Analysis; SLP Press: New Canaan, CT, 1993.
13. Huang, Y.J.; Lee, S.C.; Dong, J.P. J. Appl. Polym. Sci. 2000, 78, 558.
14. Dong, J.P.; Huang, J.G.; Lee, F.H.; Roan, J.W.; Huang, Y.J. J. Appl.
Polym. Sci. 2004, 91, 3388.
15. Pattison, V.A.; Hindersinn, R.R.; Schwartz, W.T. J. Appl. Polym. Sci.
1974, 18, 2763.
16. Cook, W.D.; Delatycki, O. J. Polym. Sci. Polym. Phys. Ed. 1974, 12, 2111.
17. Huang, Y.J.; Chen, T.S; Huang, J.G.; Lee, F.H. J. Appl. Polym. Sci.
2003, 89, 3347.
Table 1. LPAs Used in This Study
LPA codes monomer M
naM
waPD
aT
g(C)
bPVAc1S VAc 23000 67000 2.9 29.7
PVAc2S VAc 65000 134000 2.1 28.9
PVAc3S VAc 88000 167000 1.9 29.5
PVAc4S VAc 106000 231000 2.2 27.2
a:by GPC (g/mole); b:by DSC.
Table 2. Molar Volumes and Dipole Moments for UP and LPA UP or LPA dipole
moment µ (debye/mole)
molar volume V (cm
3/mol)
dipole moment per unit volume µ’
( =(µ
2/V)
1/2)
(a) UP resinMA-PG-PA 2.79 1063.1 0.086
(b) Non-Reactive
LPAs
PVAc1S 10.39 17040 0.080
PVAc2S 17.86 50340 0.080
PVAc3S 20.78 68150 0.080
PVAc4S 22.81 81970 0.080
Table 3. Phase Separation Time, t
p, for ST/UP/LPA Uncured Systems at 25
oC, and Final Conversions of Total C=C Bonds, α,as Measured by
DSC for ST/UP/LPA Systems Cured at 110
oC
LPA added t
p(min) Upper layer (wt.%) α(%)
Neat UP 89.2
LPAs
PVAc1S
∞
a - 82.2PVAc2S
∞
- 74.6PVAc3S
∞
- 83.1PVAc4S
∞
- 80.0a: one phase (after 1440 min)
Table 4. Volume Shrinkage, ∆V/V
0, L
*for Both Sides of Molded Parts, and Relative Volume Fraction of Microvoids, v
m’, for ST/UP/LPA Cured
Systems
LPA added ∆V/V
0(%) L
*(upper) L
*(botto m)
v
m’(%)
Neat UP -8.61(0.15) a 21.06(0.15)a
22.45(0.1 8)
- PVAc1S -6.54(0.08) 25.97(0.08) 29.95(0.3
0)
0.72 PVAc2S -5.46(0.05) 38.44(0.08) 56.00(0.0
6)
0.80 PVAc3S -3.76(0.11) 23.31(0.02) 24.39(0.0
9)
1.75 PVAc4S -2.24(0.20) 27.62(0.03) 29.46(0.0
5)
3.35 a: The values in parentheses represent the estimated standard errors.
Table 5. Absolute Volume Fraction of Microvoids, v
m, Average Size of Microvoids, s
m, and Size Distribution of Microvoids for ST/UP/LPA
Cured Systems by AFM Void Size
(µm) PVAc1S PVAc2S PVAc3S PVAc4S
0 – 0.15 45.6% 25.4% 47.2% 50.8%
0.15 – 0.25 17.1% 17.2% 22.5% 22.6%
0.25 – 0.35 13.2% 33.0% 13.2% 13.3%
0.35 – 0.45 11.2% 17.2% 11.2% 13.3%
0.45 – 0.55 5.6% 5.9% 5.6% -
0.55 – 0.65 5.6% - - -
0.65 – 0.75 1.8% 2.0% - -
Total 100% 100% 100% 100%
Avg. Void Size, sm
0.24 µm 0.27
µm 0.20 µm 0.19 µm
SizeDistribution of Voids
Unimodal Bimodal Unimodal Unimodal
Volume Fraction of
Voids, vm
17.9% 18.6% 25.5% 27.1%
Table 6. Glass-Transition Temperatures of Fully Cured ST/UP/LPA Systems Based on tanδ by DMA
LPA MR Model T
g1αT
g1βT
g2T
gRNeat UP 1/1 157.6 89.9
2/1 162.6 92.4
3/1 157.8 101.4
6/1 140.4 100.0
LPA
PVAc1S 2/1 P-P-S 167.7 121.5 60.6 PVAc2S 2/1 P-P-S 173.3 114.0 57.4 PVAc3S 2/1 P-P-S 164.1 113.1 52.4 PVAc4S 2/1 P-P-S 162.8 112.4 52.7
Table 7. Test Conditions and Glass-Transition Temperatures of Fully
Cured ST/UP/LPA Systems by TSC (a)
LPA MR Polar.
Temp (
oC)
Polar.
Time (min)
Elec.
Field (V/mm)
Sample Thickness
(mm)
Neat UP 1/1 150 0.01 120 1.5242/1 150 0.01 120 1.601
3/1 150 0.01 120 1.324
6/1 150 0.01 120 1.547
LPA
PVAc1S 2/1 150 60 500 0.952
PVAc2S 2/1 150 60 500 0.964
PVAc3S 2/1 150 60 500 0.957
PVAc4S 2/1 150 60 500 0.948
(b)
LPA MR Model T
g1αT
g1βT
g2T
gRNeat UP 1/1 117.7 105.2
2/1 141.9 118.3
3/1 141.5 -
6/1 138.8 116.2
LPA
PVAc1S 2/1 P-P-S 157.6 88.7 24.8 PVAc2S 2/1 P-P-S 157.2 77.4 23.9
PVAc3S 2/1 P-P-S - 78.3 24.1
PVAc4S 2/1 P-P-S - 69.2 23.4