國立臺灣大學生命科學院生化科學研究所 碩士論文
Graduate Institute of Biochemical Sciences College of Life Science
National Taiwan University Master Thesis
N端螺旋結構域的陰電性變化如何影響細胞自噬蛋白LC3 What Negative Charges on NHD Can Impart to LC3
王旭祺 Hsu-Chi Wang
指導教授﹕楊維元 博士 Wei Yuan Yang, Ph.D.
中華民國 101 年 7 月
July, 2012
ii
致謝
記得剛進實驗室時,學習操作各種實驗,即使是很基本的agarose 膠體電泳,
楊維元老師也不厭其煩地親手指導,有時為了詢問藥品或儀器的使用,晚上也致 電煩擾老師,那種親切與熱情,著實令學生印象深刻;更重要地,當旭祺在遇到 各種學業上、甚至學業外的困境時,楊老師耐心聆聽、溝通的智慧,以及對學生 犯錯時的諒解和輔導,可說是學生在這段研究生涯的一大支柱。謝謝維元老師,
謝謝您為學生所費的苦心、及帶給旭祺的生命經驗!
家庭的支持是這段研究時光的另一大支柱,它不斷地給旭祺機會,讓旭祺能 勇敢嘗試各種想法、並向理想的目標作出挑戰!感謝爸爸、媽媽和其他家人,讓 隻身在外的我,仍能感受到來自家的溫暖及鼓勵!
旭祺也要謝謝實驗室的同儕與學長姐:學長姊們(家綾、惠君、聿賢、柏樺及 正偉等)的關心和實驗指導、同儕們(皓瑩、智群、顯壹、佩璇、廷松、曼文及朝 興等)一齊分享的學術切磋與生活調劑,另外還有碩士班及大學時代的師長、同窗 們,都讓旭祺在此研究階段,有歡笑、有鼓勵、有成長,也有肯定!
本研究中質譜實驗的完成,要感謝中研院生化所質譜室的林淑妤博士、范貞 貞小姐、余芳瑋小姐與蔡明潔先生,對實驗流程的說明及儀器的操作。
最後要特別感謝另二位擔任學生論文口試的委員:中研院生化所的陳佩燁博 士及化學所的黃人則博士;感謝老師們一直以來對學生的關心,並且在準備口試 上、舉行口試時,以至口試後的論文潤飾等,提供了許多寶貴的意見和幫助!
iii
摘要
細胞自噬普遍存在於真核生物細胞中。細胞會藉由細胞自噬的過程來清除較 次要的有機顆粒、受損的胞器,甚至胞內的病原體,以換取必須能量、進行養份 循環、完成免疫反應等。細胞自噬時,將被降解的物質首先會由一種稱作吞噬泡 的雙層膜構造的擴展所包圍而後封閉,稱為自噬體。自噬體接著與胞內的溶酶體 融合成自噬溶酶體,經由溶酶體的水解酶消化自噬體的內容物,並釋出降解後的 產物回細胞質。細胞自噬已知與多種人類的病理過程相關,如神經退化、癌症及 老化。
LC3 是一種類似泛素的細胞自噬蛋白,連接並修飾著擴展過程中的吞噬泡表
面。LC3 經由一套類似 E1-E3 的酵素系統,與吞噬泡上的磷脂醯乙醇胺連結。LC3
被認為藉由其自身的多聚化,能促使吞噬泡間膜的連結與半融合。先前的研究顯
示LC3 由兩個結構域構成:N 端螺旋結構域(NHD)和 C 端的類泛素結構域(ULD)。
當LC3 與自噬泡上的脂質連結,其 NHD 可能會減少與 ULD 間的接觸面,而成一
個「開啟」的形式,使得LC3 得以暴露 ULD 的部分表面區域,誘發 LC3 行多聚
化。
2010 年的兩項研究顯示小鼠的蛋白激酶 A 與大鼠的蛋白激酶 C 各別能磷酸化 LC3 之第 12 號絲胺酸與第 6 號蘇胺酸。這暗示著可能存在一套未知的 LC3 調控模
式,特別是藉由改變NHD 在 LC3 上的動態。
本研究使用仿磷酸化的人類LC3 突變型,T6D (將第 6 號蘇胺酸突變為天門冬
氨酸)及T12D (將第 12 號蘇胺酸突變為天門冬氨酸),來與野生型的 LC3 和重組
的ULD 比較,利用圓二色光譜技術(CD),作為觀察 LC3 二級構造之集體行為的
工具;以測試當 NHD 上存在帶額外負電荷的官能基時, LC3 的動態或穩定性是
否發生顯著改變,進而影響LC3 的活性。
結果顯示相較於ULD,不論野生型或仿磷酸化的 LC3,在波長 222 奈米附近
皆具有較強且相似的CD 訊號;α 螺旋結構的存在會大幅提高此處的訊號,故當此
iv
結構消失或變性時,CD222訊號會大幅下降。利用在不同濃度的尿素與鹽酸胍下產
生的CD222,來建立各種LC3 的變性曲線,結果發現仿磷酸化的 LC3 顯著較野生
型容易變性;若以ULD 的變性曲線作為參考,LC3 變性或去摺疊之過程的前期,
可能部分發生在其NHD 的 α 螺旋結構,而早於其 ULD 出現大規模的變性。
關鍵詞:LC3;細胞自噬;圓二色光譜;變性曲線;仿磷酸化
v
Abstract
Autophagy is ubiquitous in all eukaryotic cells. It is crucial for cells to clear less necessary organic particles, damaged organelles, or intracellular pathogens for emergent energy needs, nutrient recycling, immune response, etc. In autophagy, cellular components to be degraded are first surrounded by a double membrane structure called phagophore; this membrane gradually expands and is sealed into a close structure called autophagosome, which subsequently fuses with lysosome, becoming autolysosome; the content within the autolysosome is then digested with hydrolytic enzymes, and freed from the structure into cytosol. Autophagy has been linked to numerous human pathological processes, such as neurodegeneration, cancer, and aging.
LC3, a ubiquitin-like autophagic protein, is decorated on the phagophore during membrane expansion. In an E1-E3-like enzyme system, LC3 is conjugated to the phosphatidylethanolamine (PE) on the phagophore. LC3 is suggested to promote membrane tethering and hemifusion between phagophores through its multimerization.
Previous studies showed that LC3 consists of two domains: the N-terminal helical domain (NHD) and the C-terminal ubiquitin-like domain (ULD). During lipidation, the NHD may dissociate from the ULD, adopting an “open” form, and exposing a region on the ULD surface to induce LC3 multimerization.
In 2010, two studies showed that, both in vitro and in vivo, protein kinase A (PKA)
vi
and protein kinase C (PKC) could phosphorylate LC3’s Ser12 and Thr6, respectively.
These imply a novel mode of LC3 regulation, possibly through changing its NHD dynamics.
In this study, the phosphomimetic human LC3s, T6D and T12D, were used for comparison with the LC3 wild type and the ULD, to investigate whether the additional negative charges on the NHD influence their dynamics, or stabilities, and hence the activities of LC3. The technique circular dichroism (CD) was utilized for examining the collective behavior of their secondary structures.
The results showed that compared with the ULD, the wild type, T6D, and T12D all had much stronger and similar signals around the wavelength 222 nm, which largely arises from the presence of α-helices, and decreases drastically in their loss or denaturation. Further examining the urea and the guanidine hydrochloride denaturation curves by CD222 of these LC3 variants found that there are significant differences between the wild type and the phosphomimetic mutants, showing the later more readily denatured. Compared with the denaturation curve of the ULD, the observed early unfolding of the LC3 could be, at least partially, accounted by the NHD, which might begin massive denaturation before the ULD does.
Keywords: LC3; autophagy; circular dichroism; denaturation curve;
phosphomimetic
vii
Contents
致謝 ... ii
摘要 ... iii
Abstract ... v
List of Figures ... ix
List of Tables ... xii
List of Abbreviations ... xiii
I. Introduction ... 1
II. Materials ... 6
II.1. Reagents ...6
II.2. Equipments ... 11
II.3. Reagent Setup ... 16
III. Procedures ... 22
III.1. Mutageneses of the Expression Vector pHM MBP-LC3 ... 22
III.2. Preparations of the Proteins LC3 Wild Type, T6D, T12D, and ULD 26 III.3. Observations of the LC3s Using CD Spectropolarimetry ... 33
III.4. PKA Assay of the LC3 Wild Type ... 36
IV. Results ... 39
IV.1. Point Mutageneses of pHM MBP-LC3 ... 39
viii
IV.2. Preparations of the Recombinant Proteins LC3 Wild Type, T6D,
T12D, and ULD ... 40
IV.3. CD Spectra of the LC3s ... 42
IV.4. Urea and GuHCl Denaturation Curves of the LC3s ... 43
IV.5. Phosphorylation Assay of the LC3 Wild Type by PKA ... 45
V. Discussion ... 46
V.1. Stability and Aggregation Distinctness among LC3 Variants ... 46
V.2. The Limitations in Using the Phosphomimetic Mutants and Presenting the CD Denaturation Curves ... 48
V.3. Exploring the “Open-Closed” Hypothesis of LC3 with the Technique Other Than CD ... 50
V.4. The PKA as the Candidate to Directly Phosphorylate Human LC3 52 V.5. Possible Biological Effects of the Phosphorylations Using Other Biophysical Methods ... 53
VI. Figures ... 54
VII. Tables ... 87
VIII. References ... 92
IX. Appendices... 95
ix
List of Figures
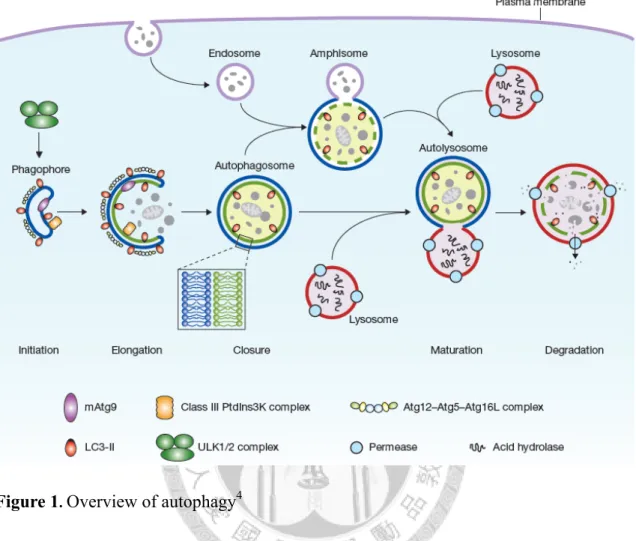
Figure 1. Overview of autophagy ... 54
Figure 2. Ubiquitin-like Atg8 (LC3) is conjugated to membrane PE through E1-E3 like system ... 55
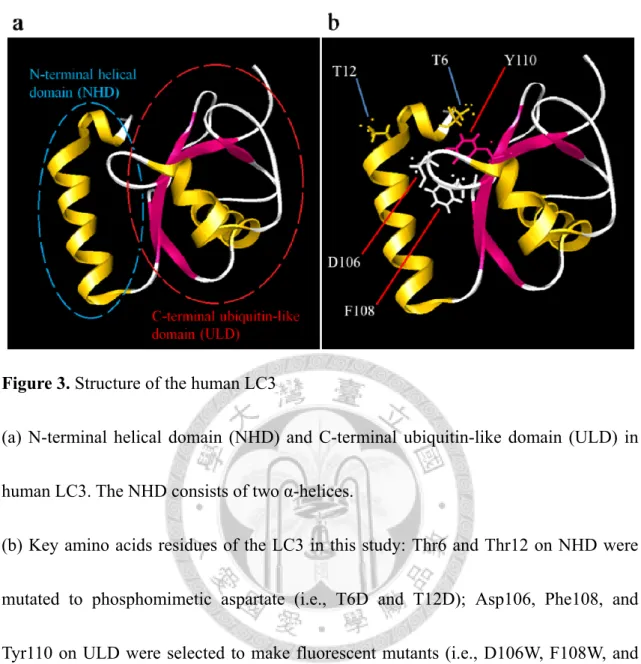
Figure 3. Structure of the human LC3 ... 56
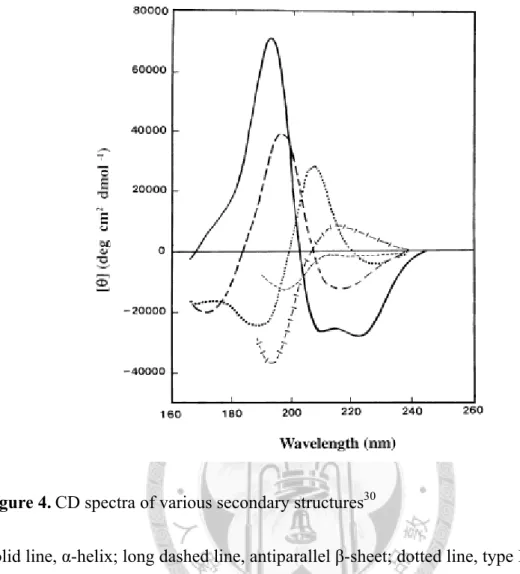
Figure 4. CD spectra of various secondary structures ... 57
Figure 5. PCR check of the LC3 T6D, T12D, T6A, and T12A mutageneses ... 58
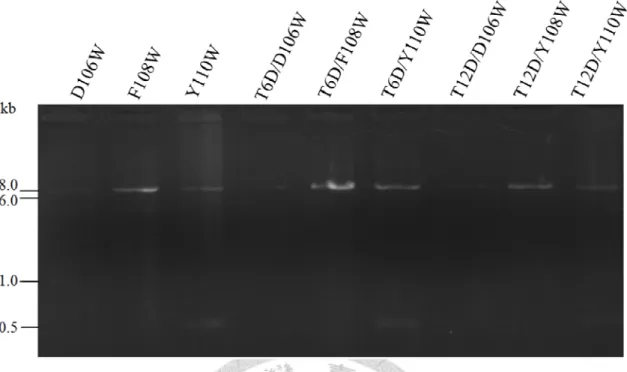
Figure 6. PCR check for the fluorescent LC3s and their phosphomimetic double mutants ... 59
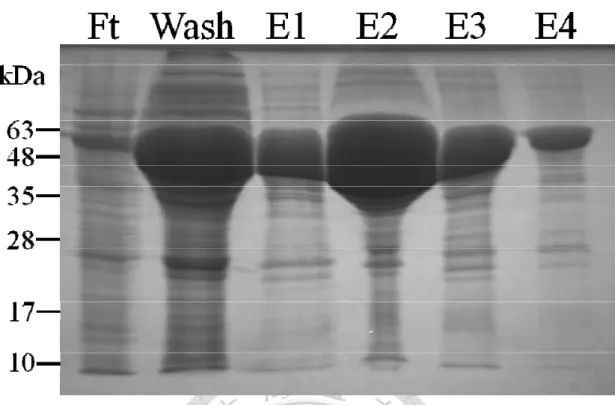
Figure 7. SDS-PAGE check for the amylose-resin-pulled down fusion protein MBP-LC3 wild type ... 60
Figure 8. SDS-PAGE check for the amylose-resin-pulled down fusion protein MBP-LC3 T6D ... 61
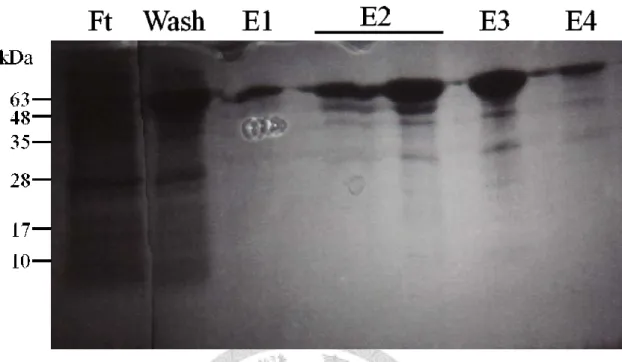
Figure 9. SDS-PAGE check for the amylose-resin-pulled down fusion protein MBP-LC3 T12D ... 62
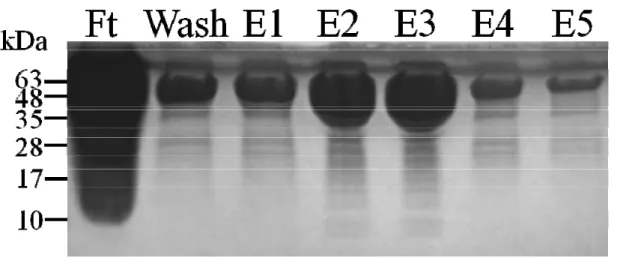
Figure 10. SDS-PAGE check for the amylose-resin-pulled down fusion protein MBP-ULD ... 63
Figure 11. SDS-PAGE check for MBP-removal from the Factor Xa-treated MBP-LC3 wild type by the amylose resin ... 64
Figure 12. SDS-PAGE check for MBP-removal from the Factor Xa-treated MBP-LC3 T6D by the amylose resin ... 65
Figure 13. SDS-PAGE check for MBP-removal from the Factor Xa-treated MBP-LC3 T12D by the amylose resin ... 66
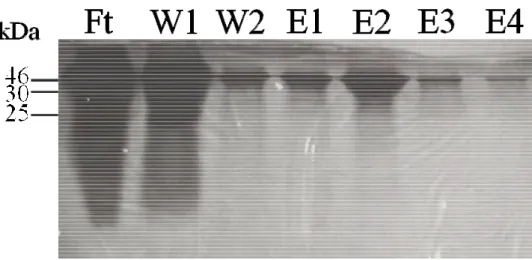
Figure 14. SDS-PAGE check for MBP-removal from the Factor Xa-treated MBP-ULD by the amylose resin ... 67
x
Figure 15. Repeated MBP-capture (cleaning) from the LC3 T12D “pool” with the
affitnity chromatography ... 69
Figure 16. Typical LC3 elution monitor in the FPLC (the wild type) ... 70
Figure 17. Typical LC3 elution monitor in the FPLC (the T6D) ... 71
Figure 18. Typical LC3 elution monitor in the FPLC (the T12D) ... 72
Figure 19. The ULD elution monitor in the FPLC ... 73
Figure 20. Changing chromatogram monitoring the ULD elution with time in the FPLC ... 74
Figure 21. MS confirmation of the gel-filtrated LC3 wild type ... 75
Figure 22. MS confirmation of the gel-filtrated LC3 T6D ... 75
Figure 23. MS confirmation of the gel-filtrated LC3 T12D ... 76
Figure 24. MS confirmation of the gel-filtrated ULD ... 76
Figure 25. How to determine the protein concentration for the CD using the spectrophotometry ... 77
Figure 26. CD spectra of the LC3s ... 78
Figure 27. CD spectra of the LC3s in the 8 M urea ... 79
Figure 28. CD spectra of the LC3s in the 6 M GuHCl ... 79
Figure 29. CD spectra of the LC3 T12D under different pH conditions ... 80
Figure 30. How to prepare the 50 μM LC3 under the different urea concentrations .... 81
Figure 31. Urea denaturation curves of the LC3 variants based on the CD signal at 222 nm ... 82
Figure 32. GuHCl denaturation curves of the LC3 variants based on the CD signal at 222 nm ... 82
Figure 33. Examination of pH dependence of the LC3 T12D by urea denaturation curves ... 83
xi
Figure 34. PKA activity assay using the standard substrate Kemptide ... 84 Figure 35. PKA activity assay on the human LC3 wild type ... 85 Figure 36. Hypothesis of LC3 denaturation based on the “open-closed” idea ... 86
xii
List of Tables
Table 1. Primers used in this study ... 87
Table 2. PCR conditions in this study ... 88
Table 3. Urea denaturation reaction setup ... 90
Table 4. GuHCl denaturation reaction setup ... 91
xiii
List of Abbreviations
Abs Absorbance Carb Carbenicillin
CD Circular Dichroism
Chlor Chloramphenicol
FPLC Fast Protein Liquid Chromatography GABARAP GABAA Receptor-Associated Protein GuHCl Guanidine Hydrochloride
LC3 The Microtubule-Associated Protein Light Chain 3
MBP Maltose-Binding Protein
mdeg Millidegree Mg(OAc)2 Magnesium Acetate
MS Mass Spectrometry
NHD N-Terminal Helical Domain
PE Phosphatidylethanolamine
PKA Protein Kinase A
PKC Protein Kinase C
TFA Trifluoroacetic Acid
ULD C-Terminal Ubiquitin-Like Domain
WT Wild Type
1
I. Introduction
Autophagy is a ubiquitous process in all eukaryotes. It primarily executes degradation or further recycling of intracellular components, cell-engulfed pathogens or particles for emergent energy needs, developments,1,2 immune responses,3,4 etc. In cells, this process first involves the sequestration of cellular component (or the engulfed materials) with a double-membrane structure, phagophore. With the help of several autophagic proteins (called Atgs) decorating or proximal to the phagophore surfaces (e.g., Atg8 and Atg5), the phagophre membrane surrounds the target to be degraded and is then sealed, becoming a closed structure called autophagosome. Atg8, or its mammalian ortholog, LC3, is a key player on the phagophore surface that facilitates multi-phagophore tethering and their further hemifusion into an larger autophagosome,5 which later undergoes fusion with lysosome, forming an “autolysosome.”4,6 The hereafter single-membrane vesicles in the autolysosome, altogether with their contents, are digested or degraded with lysosomal hydrolases, and the simpler products could be released into cytosol, through machinery such as the permeases on membrane, for other uses by the cell.4,7 Fig. 1 illustrates the process described above.
Autophagy, whether it’s functional or impaired, has been linked to several critical physiological conditions, such as cancer,8,9 neurodegeneration,10,11 innate or adaptive immunity,3,12 aging,13 longevity,14 etc. With increasing details elucidated, manipulation
2
of autophagy is becoming promising for developing rational therapeutic strategies, and understanding how autophagy could be regulated would thus be necessary.
Atg8/LC3 (hereafter called LC3) is a ubiqutin-like protein, and through an E1- E3-like system, it is conjugated to the lipid on the phagophore membrane and the subsequent autophagosome.15,16 In autophagic vesicle expansion, LC3 is first processed by cysteine protease Atg4, exposing its C-terminal glycine.15 Then LC3, along with another ubiquitin-like protein in the process, Atg12,17 are activated by the E1-like enzyme Atg7,18 and they are then transferred to the E2-like enzymes, Atg3 and Atg10, respectively.19,20 Atg12 is then conjugated to Atg5, which could non-covalently bind Atg1621 and the complex undergoes multimerization.22,23 The Atg5-Atg12 conjugate, which is suggested to act as the E3-like enzyme,24 ligates LC3 to the phosphatidylethanolamine (PE) on the autophagic vesicles (now termed LC3-II, Fig. 2).
This conjugation is through an amide bond between the C-terminal carboxyl group of the LC3 and the amine of the PE. LC3 then could promote autophagic vesicles’
interactions (e.g., hemifusion), as described earlier. Once the autophagsome is completed, Atg4 cleaves LC3 out of the membrane, finishing its role on the membrane.15
LC3 consists of two domains, the N-terminal helical domain (NHD, the first 26 amino acid residues) and the remaining C-terminal ubiquitin-like domain, ULD (Fig.
3
3a). It has been proposed that the NHD in free LC3 associates with ULD, adopting a
“closed” form; upon lipidation, NHD flips out from ULD, becoming an “open, or active”
form. A region entirely covered by the NHD in the “closed” LC3 has been found and suggested to induce the ULD multimerization on separate membranes, hence relevant to the membrane-tethering and the vesicle hemifusion function of LC3.5,25,26,27
In 2010, two studies showed that protein kinase A (PKA) and protein kinase C (PKC) could phosphorylate LC3, both in vitro and vivo, at Ser12 and Thr6, repectively.28,29 In Fig. 3b the positions of Thr12 and Thr6 on LC3 are shown. (Note that the 12th amino acid residue of the human LC3 is threonine instead of the serine in the mouse ortholog.) Although the lipidation of LC3 (i.e., forming LC3-II) is shown reduced under the higher activities of both kinases through uncertain mechanisms,28,29 the effects of the phosphorylations on LC3’s subsequent activities (i.e., LC3 multimerization and promoting the membrane hemifusion) are still unknown and worth investigating.
The charge distributions on the N-helical domains has been reported characteristic among LC3 and their homologs (e.g., GABARAP), especially when discriminating their binding partners during autophagy.26 In the same way, the electrostatic potential or the steric effect built upon the side chains of the amino acid residues on the NHD (or its post-translational modifications, e.g., phosphorylations) may also influence the
4
“open-closed, or intramolecular” conformations and the further intermolecular LC3 multimerization upon lipidation. If LC3-II could behave distinctly when its NHD bears an additional negatively-charged group, a novel switch to regulate autophagy would be implied.
Circular dichroism (CD) spectropolarimetry is a potent tool in observing proteins’
secondary structures. The combinatorial effect of the orientations of peptide bonds and side chains in various environments (hence different secondary structures) could lead to rotations of the plane-polarized light of particular wavelengths to different extents and toward distinct directions. In principle, the ellipticity of the polarized light at 222 nm changes significantly during the denaturation of α-helix (see Fig. 4),30 and this change could be indicative on the course of protein denaturation. In this study, I addressed the ensemble of the native secondary structures of the LC3 variants (i.e., wild type, phosphomimetic T6D & T12D, and the ULD) based on the CD spectra between 200-250 nm; also with the increasing challenges of urea or guanidine hydrochloride (GuHCl), the denaturation curves based on the ellipticity at 222 nm (CD222) were established among these LC3 variants and could help compare the stabilities of the α-helices of the NHDs. This will shed some light on how the LC3 phosphorylations per
se change the NHD’s dynamics and might also give some structural insights for the future explanation on their possible biological effects (e.g., multimerization induction or
5
activities toward other regulators).
The PKA phosphorylation of the LC3 in the previous study was performed using the mouse ortholog28 whereas this event in human has not yet been reported. In this study, the PKA activity on the recombinant human LC3 was also tested in vitro.
6
II. Materials
II.1. Reagents
II.1.1. Buffers
DNA gel loading dye (6x, blue), New England BioLabs, cat. no. B7021
DNA ligase reaction buffer (for T4 DNA ligase), 10x, New England BioLabs, cat. no.
B0202S
NEBuffer 1, 10x, New England BioLabs, cat. no. B7001
Protein sample loading dye (in SDS-PAGE), 4x Laemmli buffer (see reagent setup for detail, p. 16)
II.1.2. Cells
The competent cells, frozen at -80°C: Escherichia coli strain BL21-CodonPlus-RIL (for protein expression), strain DH5 alpha (for plasmid amplification), and strain DH5 alpha High Efficiency (for cloning), all supplied by W. Y. Yang, Academia Sinica
The cultured cells (hosting the plasmid pHM MBP-ULD, from 4-L cell culture) with induced expression of the fusion protein MBP-ULD, frozen at -20°C, provided by W. Y.
Yang, Academia Sinica
7
II.1.3. Chemicals
Acetonitrile (ACN), Merck, cat. no. 1.00030.4000
Acrylamide solution (Acryl/Bis 29:1, 40% w/v), AMRESCO, cat. no. 0311 Agarose powder, invitrogen, cat. no. 15510027
APS (ammonium persulfate), J.T.Baker, cat. no. 4030-04
ATP (adenosine 5′-triphosphate, disodium salt), Calbiochem, cat. no. 1191 Brij 35 (30% w/v), Sigma, cat. no. B4184
Bromophenol Blue (sodium salt), Sigma, cat. no. B8026 Carbenicillin, Gold Biotechnology, cat. no. C0109
CH3COOH (acetic acid, glacial 100%), Merck, cat. no. 1.00063.2500 Chloramphenicol, BioShop, cat. no. CLR201
Coomassie Brilliant Blue G-250, AMRESCO, cat. no. 0615 DMSO (dimethyl sulfoxide), Sigma, cat. no. D2650
EDTA (disodium salt dihydrate), AMRESCO, cat. no. 0105 Ethanol, Merck, cat. no. 1.00983.2500
Formic acid (FA, 98-100%), Merck, cat. no. 100264 Glycerol, ACROS ORGANICS, cat. no. 158920010 Glycine, AMRESCO, cat. no. 0167
GuHCl (guanidine hydrochloride), CalBiochem, cat. no. 369080, lot no. D00092972
8
H3PO4 (phosphoric acid, 85.9%), J.T.Baker, cat. no. 0260-01 HCl (hydrochloric acid, fuming 37%), cat. no. 1.00317.2500
IPTG (isopropyl β-D-1-thiogalactopyranoside), Gold Biotechnology, cat. no. I2481C β-Mercaptoethanol (β-ME), AMRESCO, cat. no. 0482
Methanol, Merck, cat. no. 1.06007.4000
Mg(OAc)2 (magnesium acetate, tetrahydrate), Sigma, cat. no. M5661
MOPS (3-(N-morpholino)propanesulfonic acid), Calbiochem, cat. no. 475898 NaCl (sodium chloride), Merck, cat. no. 1.06400.5000
NaH2PO4 (sodium phosphate monobasic, anhydrous), Sigma, cat. no. S6566 Na2HPO4 (sodium phosphate dibasic), Sigma, cat. no. S5136
NaOH (sodium hydroxide), Fisher Scientific, cat. no. S/4845/60 PMSF (phenylmethanesulfonylfluoride), AMRESCO, cat. no. 0754 SDS (sodium dodecyl sulfate), J.T.Baker, cat. no. 4095-02
TEMED (N,N,N′,N′-tetramethylethylenediamine), Sigma, cat. no. T7024 TFA (trifluoroacetic acid), Riedel-de Haën, cat. no. 61030
Tris, AMRESCO, cat. no. 0826 Urea, J.T.Baker, cat. no. 4111-01 Water, deionized, Milli-Q grade
Water, UltraPure DNase/RNase-free distilled water, invitrogen, cat. no. 10977
9
II.1.4. Culture Media
LB Agar Miller, Difco, cat. no. 244520 LB Broth Miller, Difco, cat. no. 244620
II.1.5. DNA, Peptide, and Protein
BSA (bovine serum albumin, fatty acid free heat shock BSA powder), Equitech-Bio, cat.
no. BAH66-0050
Expression vector plasmids, pHM MBP-LC3 and pHM MBP-ULD, harboring the genes of the fusion proteins, MBP (maltose-binding protein, as the affinity tag)-LC3 wild type and MBP-ULD, respectively, downstream from the T7 promoter, with the ampicillin (also carbenicillin)-resistant gene as the selection marker. These plasmids were provided by W. Y. Yang, Academia Sinica.
Kemptide, Enzo Life Sciences, cat. no. SPK-101J
II.1.6. Dyes and Markers
DNA gel marker, 1 kb DNA ladder, New England BioLabs, cat. no. N3232 DNA gel stain, SYBR Safe, 10,000x concentrate, invitrogen, cat.no. S33102
Protein markers (for SDS-PAGE), Prestained Protein Ladder 4, Geneaid, cat. no. PL004 (more recommended in this study); or Prestained Protein Marker Broad Range, New
10
England BioLabs, cat. no. P7708
II.1.7. Enzymes
DNA ligase (T4 ligase), New England BioLabs, cat. no. M0202
DNA polymerase, Finnzyme, Thermo Scientific, 2x Phusion Flash High-Fidelity PCR Master Mix, cat. no. F-548, or 2x Phusion HF Master Mix, cat. no. F-531
DNase I (from bovine pancreas), Sigma, cat. no. DN25 DpnI, New England BioLabs, cat. no. R0176
Factor Xa, Novagen, cat. no. 69036
PKA (protein kinase A), catalytic subunit, recombinant, Millipore, cat. no. 14-440 PNK (T4 polynucleotide kinase), New England BioLabs, cat. no. M0201
II.1.8. Kits
DNA plasmid purification kits: GENO Universal DNA Purification Kit, Genomics, cat.
no. GN-DE214-02; High-Speed Plasmid Mini Kit, Geneaid, cat. no. PD100; QIAprep Spin Miniprep Kit, QIAGEN, cat. no. 27104
11
II.2. Equipments
II.2.1. General Equipments
Bath (dry), Firstek, model DB-130-2; or Thermolyne, model 17600 Centrifuge (bench-top), eppendorf, model 5810R
Centrifuge (microcentrifuge), eppendorf, model 5424
Centrifuge (general purpose, e.g., spinning down the 1-L cell culture), Beckman Coulter, model Avanti J-20XP with the rotor JLA 8.1000
Centrifugal filter devices, Millipore, Amicon Ultra-0.5, 3 kDa, cat. no. UFC500324;
Ultra-4, 3 kDa, cat. no. UFC800308; Ultra-15, 3 kDa (10 kDa), cat. no. UFC900308 (UFC901008)
Cuvette (quartz, open top, for measuring protein concentrations by absorbance), 1.4 ml, pathlength 10 mm, Nova Biotech, cat. no. QS-467
Droppers (plastic and disposable, for adjusting pH when preparing water solutions) Dialysis tubes, SnakeSkin Pleated Dialysis Tubing, Thermo Scientific, 3.5K (7K, 10K) MWCO, cat. no. 68035 (68700, 68100)
Gel electrophoresis tanks, Wealtec, mini GES (horizontal, for PCR check), cat. no.
1011001; V-GES (vertical, for SDS-PAGE), cat. no. 1031103
Imaging equipment (for agarose or PAGE gel), UVP, model BioDoc-It 220 Imaging System
12
pH meter, Mettler Toledo, model FE20 FiveEasy pH
Pipettes, Axypet, Axygen, 2-20 μl (20-200 μl, 100-1000 μl), cat. no. AXH-AP-20 (AXH-AP-200, AXH-AP-1000); Pipetman Neo, Gilson, 0.2-2 μl (1-10 μl), cat. no. P2N (P10N)
Pipettes (serological pipettes), Corning Costar Stripette, Sigma, 5 (10, 25)-ml, cat. no.
CLS4487 (4488, 4489)
Pipette controller (motorized), Pipetboy, Ibs Integra, cat. no. IP-B
Pipette tips, Axygen, 0.5-10 μl (200 μl, 1000 μl), cat. no. T-300-L (T-200-C-L, T-1000-C-L)
Power supply (for gel electrophoresis), Wealtec, model ELITE 200 or ELITE 300 Plus Shaker (mixer), Elmi, model Intelli-Mixer RM-2L
Shaker (orbital), Firstek, model S-101 Shaker (rocking), Firstek, model RS-101
Spectrophotometer (UV/visible), Beckman Coulter, model DU 800 Spectrophotometer, NanoDrop, Thermo Scientific, model ND-1000
Stirrer, AREC digital heating magnetic stirrer, VELP Scientifica, model F20510010 Tubes (conical tubes), BD Falcon, 15-ml, 17 mm × 120 mm (50-ml, 30 mm × 115 mm), cat. no. 352096 (352070)
Tubes (microtubes), Axygen, 1.7-ml (2.0-ml), cat. no. MCT-175-C (MCT-200-C)
13
Tube (round-bottom tube, 14 ml, 17 mm × 100 mm), BD Falcon, cat. no. 352059 Vortex mixer, Vortex-Genie 2, Scientific Industries, model G560, cat. no. SI-0236 Wash bottles, Nalgene, for distilled water (for ethanol), cat. no. 2425-0505 (2425-0502) Weighing balances, Acculab, model VIC-1501; 4-decimal balance, Sartorius, model BP-110S
Wipers, Kimwipes delicate task wipers, Kimtech Science, cat. no. 34120
II.2.2. Equipments in Cloning
Bath (heated water bath, for heat shock when transforming bacteria), Firstek, model B100
Bath (orbital shaking, for the 5-ml cell culture), Firstek, model B701 Incubator (for bacterial culture by plating), Firstek, model I-23 PCR thermal cycler, DNA Engine, Bio-Rad, model PTC-200 Tube (PCR tube, flat cap), 0.2 ml, Basic Life, cat. no. BL 7001
II.2.3. Equipments in Protein Expressions
Cuvette (for measuring bacterial growth by turbidity), standard disposable PMMA cuvette, 1.5 ml, semi-micro, 12.5 × 12.5 × 45 mm, pathlength 10 mm, PLASTIBRAND, cat. no. 7591 15
14
Flask (for 1-L cell culture), 2000 ml, Kimble Kimax Pyrex, cat. no. 25630-2000 Incubator (orbital shaker, for 1-L cell culture), Firstek, model S300R
II.2.4. Equipments in Protein Purification by Affinity Chromatography
Affinity column amylose resin, 100 ml, New England BioLabs, cat. no. E8021L Column (PD-10, empty and disposable), GE Healthcare, cat. no. 17-0435-01 Sonicator (for cell lysis), Sonics, model Vibra-Cell VCX130
II.2.5. Equipments in Protein Purification by Gel-Filtration
Aspirator (for use with the vacuum bottle top filter), Tokyo Rikakikai, model A-3S Fast protein liquid chromatography (FPLC), AKTApurifier 10, GE Healthcare, cat. no.
28-4062-64, with its accompanying software Unicorn ver. 5.11
Filter (pore size 0.22 μm, for preparing solutions in FPLC), 150-ml vacuum bottle top filter with 45-mm neck, Corning, cat. no. 431161
Gel filtration column, with prepacked Superdex 75 (10 × 300-310 mm, bed volume approximately 24 ml), GE Healthcare, cat. no. 17-5174-01
15
II.2.6. Equipments in MS
Concentrator (for drying peptide or protein samples before sample submission for MS service), SpeedVac concentrator, Thermo Scientific, model SPD111V
Mass spectrometer, Waters, Synapt G2 HDMS
Sample vials (for the solutions needed in ZipTip), 4-ml glass sample vials with PTFE-lined solid storage caps, Thermo Scientific, cat. no. 03-391-7B
ZipTip (tip size P10), Millipore, ZipTipC4 Pipette Tip (for protein sample desalting), cat.
no. ZTC04S096; ZipTipC18 Pipette Tip (for peptide sample desalting), cat. no.
ZTC18S096
II.2.7. Equipments in Circular Dichroism
Cell (cylindrical), pathlength 1 mm or 5 mm, Starna Scientific, type 31B Spectropolarimeter, JASCO, model J-715
16
II.3. Reagent Setup
II.3.1. General Reagent
Laemmli buffer (4x, for protein sample loading in SDS-PAGE) contains 8% SDS, 40%
glycerol, 20% β-mercaptoethanol, 0.008% Bromophenol Blue, 0.25 M Tris, pH 6.8.
II.3.2. Reagents for Protein Expressions
Carbenicillin solution, 1000x stock: dissolve the carbenicillin powder at 50 mg ml−1 in deionized water; aliquot in 1-ml portions. This solution can be stored at -20°C indefinitely. Caution: it should be freshly diluted 1000x into the medium or the agar right before use.
Chloramphenicol solution, 1000x stock: dissolve the chloramphenicol powder at 35
mg ml−1 in pure ethanol; aliquot in 1-ml portions. This solution can be stored at -20 °C indefinitely. Caution: it should be freshly diluted 1000x into the medium right before use.
LB broth: dissolve 25 g Miller’s LB broth powder with 1 liter ddH2O in a 2000-ml cell culture flask, autoclaved at 121°C, 20 min, then cooled at room temperature. It could be kept at 4°C for 2-3 days.
17
II.3.3. Reagents for Affinity Chromatography
Amylose resin column buffer contains 20 mM Tris, 200 mM NaCl, and 1 mM EDTA,
pH 7.4.
Factor Xa reaction buffer contains 100 mM NaCl, 50 mM Tris, and 5 mM CaCl2; the pH is adjusted with 6 M HCl to 8.0.
Note: for each dialysis using the SnakeSkin tube, the exchanged buffer is recommended to have 5 liters or more, for the overnight dialysis at 4°C.
PMSF solution, 500x stock: dissolved in DMSO to make 500 mM; 1000-μl aliquots
can be stored at -20°C for months.
II.3.4. Reagent for Gel-Filtration
FPLC working buffer contains 50 mM Tris/100 mM NaCl, pH 8.0. Note: prepare 500
ml the working buffer and filter it by the 0.22-μm, 150-ml vacuum bottle top filter before use in machine; it could be kept at 4°C for weeks.
18
II.3.5. Reagents for MS Preparation
The following solutions are used in sample desalting with the ZipTip. All solutions are freshly prepared before use.
1% TFA (10x): to acidify the sample for binding onto ZipTip. It could be prepared by
mixing 990 μl ddH2O and 10 μl 100% TFA.
Wetting solution: 100% acetonitrile (ACN), distributed in the 4-ml glass sample vials.
Equilibration solution: 0.1% TFA in ddH2O, could be prepared by mixing 180 μl ddH2O and 20 μl 1% TFA (see above for its preparation).
Wash solution: 0.1% TFA in ddH2O, could be prepared by mixing 450 μl ddH2O and 50 μl 1% TFA (see above for its preparation).
Elution solution: 1% formic acid (FA)/50% methanol (MeOH), it could be prepared by
mixing 49 μl ddH2O, 50 μl MeOH, and 1 μl FA.
19
II.3.6. Reagents for Circular Dichroism
Phosphate buffer 5 L (50 mM NaH2PO4/Na2HPO4, 10 mM NaCl, pH 7.1): dissolve
15 g NaH2PO4, 17.7 g Na2HPO4 and 2.9 g NaCl in ~4.9 L ddH2O with stir bar, and adjust the pH with 5 M NaOH using a dropper. Caution: fine tune the pH with a pipette when it is near 7, and add ddH2O to a final volume of 5 L.
LC3 protein solution in the phosphate buffer or in the denaturant (the urea or the
GuHCl): to prepare the protein solution in the phosphate buffer, simply dialyze it using dialysis tube; to prepare the LC3 solution in the 8 M urea/50 mM phosphate/10 mM NaCl or in the 6 M GuHCl/50 mM phosphate/10 mM NaCl, dialyze the LC3 solution with the denaturant using the SnakeSkin tube 7K MWCO. Note: to prepare the protein solution in the 8 M urea or in the 6 M GuHCl, dialysis using the centrifugation filter device could be reliable and more efficient. Caution: do not dialyze the protein in the urea (or the GuHCl) solution with the denaturant-free buffer by centrifugation, since this might cause massive protein aggregation on the filter membrane, leading to significant loss.
20
8 M urea in 50 mM sodium phosphate/10 mM NaCl buffer, pH 7.1, 45 ml: note
since the urea powder needed to make a 8 M solution takes a significant volume in the final solution (e.g., 21.6 g urea powder to make 45 ml 8 M urea), the phosphate/NaCl buffer to be included in the urea solution is prepared as the 10x stock (500 mM sodium phosphate/100 mM NaCl) in advanced. For a final volume of 45 ml, 21.6 g urea powder could first be measured in a 50-ml tube, followed by adding 4.5 ml the 10x phosphate/NaCl buffer and some distilled water to volume ~44 ml. After pH adjustment to 7.1 with 5 M NaOH, replenish the solution volume to 45 ml with distilled water. Note:
urea dissolving in water is an exothermic reaction, which could be promoted by shaking at room temperature. Caution: urea is not very stable in water, and is thus recommended freshly made before use. An alternative is to prepare a 100-ml stock, distributing it into 5-6 aliquots, and it can be stored in -20°C for a month.
6 M GuHCl in 50 mM sodium phosphate/10 mM NaCl buffer, pH 7.1, 45 ml: note
since the GuHCl powder needed to make a 6 M solution takes a significant volume in the final solution (e.g., 25.8 g GuHCl powder to make 45 ml 6 M GuHCl), the phosphate/NaCl buffer to be included in the GuHCl solution is prepared as the 10x stock (500 mM sodium phosphate/100 mM NaCl) in advanced. For a final volume of 45 ml, 25.8 g GuHCl powder could first be measured in a 50-ml tube, followed by adding
21
4.5 ml the 10x phosphate/NaCl buffer and some distilled water to volume ~44 ml. After pH adjustment to 7.1 with 5 M NaOH, replenish the solution volume to 45 ml with distilled water. 6 M GuHCl can be stored at 4°C for weeks. Caution: the purity of GuHCl powder used should exceed 99.9%, since the impurities in the lower grade GuHCl might have high absorbance in the CD that could generate large noise in signals.
II.3.7. Reagents for PKA Reaction
ATP solution: 0.25 mM ATP is prepared by diluting 0.1 M ATP with 25 mM Mg(OAc)2, pH 7.0. Note: ATP could be stored at -20°C for months.
Kemptide: prepare 300 μM stock by dissolving the purchased Kemptide 1 mg with the
PKA reaction buffer 4.318 ml, stored at -20 °C in 500 μl aliquots. Note: snap freezing the peptide with liquid nitrogen is recommended before storage.
PKA reaction buffer (5x): 40 mM MOPS, 1 mM EDTA, pH 7.0.
PKA stock: 10x serially dilute the purchased PKA (0.432 μg/μl) with the buffer
containing 20 mM MOPS, pH 7.0, 1 mM EDTA, 0.01% Brij-35, 5% glycerol, 0.1%
β-mercaptoethanol, and 1 mg/ml BSA, to obtain 4.32 ng/μl PKA aliquots, which could be stored at -20°C for months. Caution: this buffer should prevent light exposure and snap freezing the enzyme with liquid nitrogen is recommended before storage.
22
III. Procedures
III.1. Mutageneses of the Expression Vector pHM MBP-LC3
Principle: the primer pair is designed flanking the amino acid codon to be mutated.
The new codon is incorporated at the 5’-end of the forward primer, whereas the reverse primer is the reverse complement directly upstream from the mutated codon. PCR makes copies of linear DNA going through the full length of template plasmid, with the new replacing codon located at one of their blunt ends. For subsequent blunt end ligation with DNA ligase, each pair of the primers needs to be 5’-phosphorylated by polynucleotide kinase (PNK) before PCR.
1. Added a phosphate group to each primer designed for mutagenesis: the reaction mixture contained 6 μM the primer, 1 μl T4 PNK in the 1x DNA ligase reaction buffer, totally 50 μl, and was incubated at 37°C for 30 min. Then inactivated the reaction at 65°C on a plate-heater for 20 min.
2. Prepared the PCR mixture containing 0.2 ng/μl the template (pHM MBP-LC3), 0.6 μM for both the forward and reverse primers (for the primers’ sequences, see Table 1), 1 μl DMSO in 50 μl 1x Phusion Master Mix. Note: the enzyme kit used for constructing T6D, T12D, T6D/T12D was “Phusion HF Master Mix”; for T6A, T12A, and the fluorescent mutageneses (i.e., D106W, F108W, and Y110W),
“Phusion Flash High-Fidelity PCR Master Mix” was used instead, since using the
23
former kit did not show acceptable product yields when doing the PCR for the later ones (e.g., T6A). Also note that the mutagenesis of T6D/T12D was performed after pHM T6D MBP-LC3 had been constructed and used as the new template. This applied as well when constructing the phosphomimetic-fluorescent double mutants (e.g., T6D/D106W and T12D/D106W, which used the newly-constructed plasmids, pHM T6D MBP-LC3 and pHM T12D MBP-LC3 as the templates, respectively).
3. PCR thermal cycling, principle: different mutations use different primers, which have discrete annealing temperature depending on the Tm of them; the extension time at 72°C depends on both the buffer conditions and the length of the plasmid (i.e., template). Refer to Table 2 for the time settings in the different constructs.
4. Checked the PCR product (about 7 kb) by agarose gel electrophoresis (Figs 5 & 6).
Note in this study, the typical condition was running a 0.8% agarose gel with constant 100 V, 20-25 min.
5. Removed the template DNA with the enzyme DpnI: mixed total PCR product (50 μl) with 5.6 μl 10x NEBuffer 1 and 1 μl DpnI, and held the mixture for 90 min at 37°C.
6. Purified the PCR product with the PCR purification kit, following the manufacturer’s instruction except using 30-50 μl the DNase/RNase-free distilled water in the final elution. The purified product could be stored at -20°C for weeks.
7. Blunt-end ligation of the PCR product: drew about 25 μl the cleaned PCR product
24
from the last step (the remaining could serve as the ligation control without adding the ligase), mixed it with 1 μl T4 DNA ligase in the 1x DNA ligase reaction buffer, and sit the mixture at room temperature for 90 min.
8. Transformation of the competent cells: added each ligation product to the 100 μl competent cells DH5 alpha High Efficiency in the 1.7-ml tube (which had been thawed on ice for 20 min); heat shocked the cells at 42°C for 45 sec; immediately sit the cells on ice for 20 min; then added 500 μl LB broth for propagating the transformants, shaken at 37°C for 1 hr.
9. Spun down the small culture at 15,000 g, 1 min; discarded most of the supernatant and resuspended the pellet with the residual liquid; applied the resuspension onto a Carb+-LB agar plate uniformly, and incubated it at 37°C overnight.
10. Inoculated the 5-ml Carb+ LB broth with a single colony from the selected two or three colonies grown on the plate, shaken at 37°C overnight.
11. Extracted or purified the plasmid DNA from the 5-ml culture from the single colony by the DNA plasmid purification kit following the manufacturer’s instruction except using 30-50 μl the DNase/RNase-free distilled water in the final elution.
12. Drew 10 μl the purified plasmid (the concentration should be > 80 ng/μl) into a 1.7-ml tube for the sequencing service provided by the company Genomics BioSci
& Tech; specified the standard primer for sequencing the DNA region of interest.
25
(The primer M13F (-20) for screening T6D, T12D, and T6D/T12D; M13F (-40) for T6A, T12A, and all other fluorescent mutations. See Table 1 for the primers’
sequences.)
26
III.2. Preparations of the Proteins LC3 Wild Type, T6D, T12D, and ULD
III.2.1. Expressions of the Fusion Proteins Wild Type, T6D, and T12D
1. Transformed 100 μl competent cells BL21-CodonPlus-RIL with 100-160 ng the expression vector of the fusion proteins, and others followed the procedures just described (steps 8-9, p. 24). Note: the plates could be kept at 4°C for one week.
2. Inoculated 5-ml LB medium containing 50 μg ml−1 carbenicillin and 35 μg ml−1 chloramphenicol with a single colony selected from the plate, grown to saturation overnight at 37°C with shaking. Note that a 5-ml saturated culture is suitable for the efficient propagation in 1 liter medium during the expression; if more than 1 liter of the cell culture for protein expression were wanted, more 5-ml small cultures should be prepared (e.g., two 5-ml small cultures to expand into two 1-L cultures).
3. Inoculated each liter of the Carb+ & Chlor+ LB broth in a 2000-ml cell culture flask with each 5-ml of the saturated culture.
4. Grew the cells at 37°C with shaking at 250 r.p.m. to OD600 approximately 0.5 (Note:
this usually took about 5 hr), added 100 mg IPTG (the final concentration 0.42 mM), lowered the temperature to 22°C, and continued shaking overnight. Note: lowering the temperature may improve the solubility of the MBP-fusion protein inside the cells.
27
III.2.2. Purifications of the Fusion Proteins MBP-LC3BG120 Wild Type, T6D, T12D, and ULD
1. Harvested the cells by centrifugation for 30 min at 12,000 g, 4°C; resuspended the cell pellet with 15-35 ml the amylose resin column buffer. Note: the cell resuspension could be snap frozen with liquid nitrogen, and stored at -20 °C for months.
2. Added 1 mM PMSF (from 500x stock, 500 mM) and trace DNase I before cell lysis;
lysed the cell in the resuspension on ice by the sonicator for 1 min, repeating 4 times, with 1-min cooling between each repeat; then centrifuged the disrupted cells for at least 30 min at 5,000 g, 4°C.
3. Applied the supernatant from 1-L cell culture to a column containing the amylose resin equilibrated with the column buffer. Note: 3 ml resin is sufficient to capture the tagged protein of the cell lysate from 1-L culture, and the volume of the resin used could be scaled up with the volume of the cell cultured (e.g., 6 ml resin to capture the proteins from 2-L cell culture).
4. Washed the column with 20-35 ml the column buffer; then eluted the bound fusion protein (e.g., MBP-LC3) with 4 successive 3.5-10 ml deionized water washes. Note:
the volumes of the column buffer for wash depended on the protein variants, and they could also be scaled up with the volumes of the cell lysate.
28
Caution: for good reuse of the amylose resin, the procedure to regenerate (to clean)
it should be taken immediately after the chromatography (see p. 97 in Appendices for the procedure).
5. Identified the fractions containing the fusion protein by SDS-PAGE (see Figs 7-10).
Note in this study, the typical condition for SDS-PAGE was running a 15% gel with constant 120 V, 90 min.
6. Pooled the fractions containing the fusion protein, dialyzed and concentrated the sample approximately twofold with the Factor Xa reaction buffer, using the Amicon Ultra-15, 10 kDa by centrifugation at 5,000 g, 4°C.
III.2.3. MBP Removal from the Purified Fusion Proteins
1. Added the Factor Xa protease, 0.27 U per nmole of the substrate (i.e., the fusion protein) at 4°C. Note: the lower temperature could reduce non-specific substrate cleavages. Caution: the time appropriate for this reaction depended on the protein variants: it took one week for LC3 wild type and T6D, but for LC3 T12D it should be less than 3 days otherwise the unwanted protein fragments from over-digestion could significantly appear; by contrast, for MBP-ULD the reaction could be
29
undergone at room temperature for 3 days while most of the ULD seemed to remain intact (based on the MS result, Fig. 24) although many unknown bands were seen on the SDS-PAGE gel (Fig. 14).
2. Dialyzed the digest again with 5 L the amylose resin column buffer using the SnakeSkin tube 7K MWCO overnight at 4°C.
3. Applied the digest to the amylose resin column equilibrated with the column buffer;
generally it took about 3 ml amylose resin for the effective capture of any MBPs (i.e., the free MBP & the remaining fusion protein) from 1-L cell culture.
4. Collected the flow-through containing the MBP-free LC3, and further eluted the residual free LC3 in column with 10-14 ml the column buffer. Note: for eluting the LC3 from more than one liter culture, additional repeats of the buffer wash could be done for “N-1” times (N: volume of cell culture in liters); afterward, the bound tag (MBP) or the remaining intact fusion protein might be washed out by 10 ml deionized water and checked with the following SDS-PAGE.
5. Ran SDS-PAGE to check the purity and the abundance of the obtained free LC3 (Figs 11-14). Note: if the LC3 eluted still showed visible MBP band on the gel, simply repeated the steps 3-5 using the regenerated amylose resin (Fig. 15).
6. Pooled the purified free LC3 for the further gel-filtration. Caution: the pool could be snap frozen with liquid nitrogen and kept at -20 °C for months, but not suitable
30
for long-term storage in the liquid solution form due to the presence of the residual Factor Xa activity.
III.2.4. Further Purification of the LC3 with FPLC
Since the samples were prepared for CD spectropolarimetry, any impurities (e.g., trace tag MBP or other proteins from cell lysate) should be thoroughly removed through gel-filtration (i.e., fast protein liquid chromatography, FPLC) after the affinity chromatography.
1. Concentrated the LC3 through the affinity column with the Amicon Ultra-15, 7 (or 10) kDa by centrifugation at 5,000 g, 4°C. Note: typically, the free LC3 per liter of the cell culture could be finally concentrated to about 500 μl at this step, but this must be done at the lower temperature (i.e., 4°C) to avoid massive protein aggregation, and immediately followed by the gel-filtration to prevent the protein concentrate from the residual Factor Xa activity.
2. For injection, the concentrated samples needed to be high-speed centrifuged at 20,000 g, 5 min, and drew only the supernatant by syringe. Caution: the step 2 was recommended to perform at 4°C since the higher temperature (e.g., room temperature) could induce massive protein aggregation, which is not suitable for
31
injection, and this was particularly the case when preparing the ULD.
3. Injected about 100 μl of the concentrated LC3 to a prepacked Superdex 75 (10 × 300-310 mm, bed volume approximately 24 ml) pre-equilibrated with the working buffer, and then collected effluent fractions (0.3 ml per fraction) at a flow rate 0.5-0.75 ml min-1 by the FPLC controller, AKTApurifier 10. Note: performed the whole gel-filtration at 4°C.
4. Pooled multiple fractions showing the right peak (known empirically, from the previous identifications by mass spectrometry) of high absorbance at 280 nm, as measured by the built-in spectrophotometer (around the 39th-46th fractions, see Figs 16-19). Note: the pooled, collected fractions could be kept at 4°C for a week or stored at -20°C for months.
32
III.2.5. Protein Identity and Purity Check by MS
1. Concentrated the purified LC3 with Amicon Ultra-0.5 3 kDa by centrifugation to about 50 μM.
2. Drawing 50 μl of the protein concentrate for desalting using ZipTipC4: first acidified the sample with 5.6 μl 1% TFA, then following the manufacturer’s instruction using the solutions all described at p. 18 in the Reagent Setup.
3. Drying the desalted protein sample using the concentrator SpeedVac SPD111V: set at 35°C and spun 2 hr.
4. Sent the sample for molecular determination using G2 HDMS by the operator of MS Facility in Institute of Biological Chemistry, Academia Sinica.
Note: all protein molecular weights were estimated by their average molecular weights using the online calculator at http://www.expasy.org/; with the estimated values specified on the MS results (Figs 21-24).
33
III.3. Observations of the LC3s Using CD Spectropolarimetry
III.3.1. Measurements of CD Spectra of the LC3s
1. Sample preparation: CD measurements was performed in a 1-mm cell, the volume of the 50 μM LC3 solution needed was 500 μl. For protein concentration determination, the absorbance at 280 nm was measured and corrected with the baseline extrapolated by the absorbance at 300 nm and 400 nm (as demonstrated in Fig. 25).
2. Equipment preparation. Caution: turned on the nitrogen, and flushed the optics compartment for at least 20 min before starting the machine for the nitrogen gas to displace the lens-damaging oxygen.30 Caution: turned on the lamp before turning on the computer, since electronic boards or computers could be destroyed by the voltage surge due to lamp firing if they were turned on prior to the lamp.31
3. Started the CD collection program: set the data path of the program for data storage;
the bandwidth 2.0 nm; the wavenlength range: from 250-200 nm; the wavelength interval (data pitch) 0.05 nm; the response time for 0.25 sec. Principle: most CD machines maintain constant current by raising the photomultiplier tube (PMT) voltage (on a Jasco it is called HT voltage) as the light intensity decreases, which is often the case when scanning at lower wavelengths; once the PMT voltage exceeds 500 V, the signal-to-noise ratio will greatly lower, rendering the data unreliable.31
34
4. Cleaned the cell with distilled water by flushing for at least 5 times, filled with the protein sample and collected the CD spectrum at room temperature. Collected the data three times to make sure that the signals were not changing as a function of time, and then averaged the data sets. Saved the raw data on the hardware, and saved the data of each sample in separate text files with ellipticity values, [θ] (y-axis) as a function of wavelength (x-axis) so that it could be plotted to estimate protein conformations. Note: since the binary files can only be accessed by the corresponding CD machine and cannot be edited or imported into other editor (e.g., Microsoft Excel) or analysis program, the data in text format (.txt) must also be saved separately.31
III.3.2. Urea Denaturation Curves of the LC3 Wild Type, T6D, T12D, and ULD
1. Separate solutions were used to determine each point in the urea denaturation curves.
Experimental solutions were prepared volumetrically from replacing incremental amount of the original protein solution with the denaturant stock solution having the same volume. See Fig. 30 for the conceptual illustration and Table 3 for the practical setting.
2. Started the CD collection program, and entered Data Monitor mode: set the
35
bandwidth 5.0 nm, the wavenlength 222 nm, the response time 16 sec, and at room temperature. Manually recorded the steady ellipticity values (solution in equilibrium) for each increase of the denaturant.
3. Plotted the ellipticity values (y-axis) against urea concentrations (x-axis) with Microsoft Excel.
III.3.3. GuHCl Denaturation Curves of the LC3 Wild Type, T12D, and ULD
1. Separate solutions were used to determine each point in the GuHCl denaturation curves. Experimental solutions were prepared volumetrically from replacing incremental amount of the original protein solution with the denaturant stock solution having the same volume as in measuring the urea denaturation curves. See Fig. 30 for the conceptual illustration (taking measuring the urea denaturation curve for example) and Table 4 for the practical setting.
2. Started the CD collection program, and entered Data Monitor mode: set the bandwidth 5.0 nm, the wavenlength 222 nm, the response time 16 sec, and at room temperature. Manually recorded the steady ellipticity values (solution in equilibrium) for each increase of the denaturant.
3. Plotted the ellipticity values (y-axis) against urea concentrations (x-axis) with Microsoft Excel.
36
III.4. PKA Assay of the LC3 Wild Type
III.4.1. Phosphorylation Assay of Kemptide by PKA
PKA’s standard substrate, Kemptide (Leu-Arg-Arg-Ala-Ser-Leu-Gly), was utilized as the positive control for the later PKA phosphorylation assay on human LC3.
1. Added 10 μl the 5x reaction buffer into a 1.5-ml brown tube.
2. Added 5 μl 300 μM the Kemptide.
3. Added 1 μl 4.32 ng/μl the PKA. (In control this was replaced by 1 μl the PKA stock buffer.)
4. Added 14 μl distilled water and 20 μl the 0.25 mM ATP/25mM Mg(OAc)2 to make a total volume of 50 μl.
5. Gently mixed the reaction sample with a pipette and incubated it at 30°C for 30 min.
Note: the reaction could be paused by snap freezing with liquid nitrogen, then stored at -20°C for days; when thawed, it should be on ice.
6. Added 5.6 μl 1% TFA to acidify the sample for further desalting by ZipTipC18
following the manufacturer’s instruction using the solutions all described at p. 18 in the Reagent Setup.
7. Drying the desalted peptide sample using the concentrator SpeedVac SPD111V: set at 35°C and spun 2 hr.
8. Sent the sample for molecular determination using G2 HDMS by the operator of
37
MS Facility in Institute of Biological Chemistry, Academia Sinica.
Note: the peptide molecular weight was estimated by its average molecular weight using the online calculator at http://www.expasy.org/; with the estimated values specified on the MS result (Fig. 34).
III.4.2. Phosphorylation Assay of the LC3 Wild Type by PKA
The procedure was the same as that in Kemptide phosphorylation, except the enzeme (PKA)/substrate (human LC3) was raised.
1. Prepared 40 μM LC3 wild type in the 2x reaction buffer by dialysis with centrifugation, and drew 30 μl into a 1.5-ml brown tube. Note that the control in this assay was the LC3 without the dialysis, which was 30 μM in the FPLC working buffer, and 40 μl was used directly without the steps 1-4.
2. Added 3 μl 4.32 ng/μl the PKA.
3. Added 3 μl distilled water and 24 μl 0.25 mM ATP/25mM Mg(OAc)2 to make a total volume of 60 μl.
4. Gently mixed the reaction sample with a pipette and incubated it at 30°C for 2 hr.
Note: the reaction could be paused by snap freezing with liquid nitrogen, then stored at -20°C for days; when thawed, it should be on ice.
5. Added 6.67 μl 1% TFA to acidify the sample (4.44 μl 1% TFA to acidify the control)
38
for further desalting by ZipTipC4 following the manufacturer’s instruction using the solutions all described at p. 18 in the Reagent Setup.
6. Drying the desalted protein sample using the concentrator SpeedVac SPD111V: set at 35°C and spun 2 hr.
7. Sent the sample for molecular determination using G2 HDMS by the operator of MS Facility in Institute of Biological Chemistry, Academia Sinica.
39
IV. Results
IV.1. Point Mutageneses of pHM MBP-LC3
In Fig. 5a, the PCR products of T6D and T12D mutageneses were shown on the
agarose gel; Fig. 5b showed the PCR products of T6A and T12A mutageneses; the PCR check for the fluorescent or their phosphomimetic double mutants was at Fig. 6. All PCR products were polymerized along the entire template plasmid except one mismatched codon for each point mutation, thus all having sizes approximately 7 kb.
Note again that the double mutations (e.g., T6D/T12D and T6D/D106W) were constructed on the singly mutated template plasmids (e.g., pHM T6D MBP-LC3).
Before the DpnI digestion of the PCR products for the Y110W mutageneses, the DNA of interest should be separated from the smaller byproducts shown on the gel (Fig.
6), to avoid any interference or false positive in the later transformations. This was done by slicing the gel containing the DNA approximately 7 kb long and re-dissolving it by the DNA purification kit.
After sequencing, the phosphomimetic constructs (i.e., pHM T6D MBP-LC3, T12D MBP-LC3, and T6D/T12D MBP-LC3; the PCR check for the last not shown), the controls T6A & T12A, the three fluorescent (e.g., D106W) and the six phosphomimetic-fluorescent double mutants (e.g., T6D/D106W) were all successfully cloned (totally 14 new constructs).
40
IV.2. Preparations of the Recombinant Proteins LC3 Wild Type, T6D, T12D, and ULD
IV.2.1. Expressions and Affinity Chromatography to Pull Down the Fusion Proteins MBP-LC3 Wild Type, T6D, T12D, and MBP-ULD
The SDS-PAGE checks for the pull-down of these fusion proteins were shown at Figs 7-10.
IV.2.2. Removal of the Tag MBP from the Fusion Proteins MBP-LC3 Wild Type, T6D, T12D, and MBP-ULD by Affinity Chromatography
The SDS-PAGE examinations of the Factor Xa-treated fusion proteins under different conditions were shown at Figs 11-14. Note that the conditions in the Factor Xa treatment significantly varied, that of the MBP-ULD could be at room temperature for 3 days; in contrast, for the MBP-LC3 T12D it should not be longer than 3 days at 4°C.
IV.2.3. Further Purifications of the MBP-Free LC3 Wild Type, T6D, T12D, and ULD by Gel-Filtration
In Figs 16-19, the monitoring of the FPLC for the final purification were indicated.
As mentioned earlier (p. 30-31), the high-speed centrifugation right before the injections was recommended at 4°C, especially when purifying the ULD.
41
The sample of the ULD in the syringe awaiting the successive injections seemed still changing probably in the “apparent” molecular sizes due to continual aggregation under high concentration, even at 4°C (compare Figs 19 & 20).
IV.2.4. Identiy and Purity Check of the Gel-Filtrated LC3 Wild Type, T6D, T12D, and ULD by Mass Spectrometry
All MS results for these proteins showed relatively sharp single mass peak having the expected molecular weights (Figs 21-24).
42
IV.3. CD Spectra of the LC3s
The determinations of the protein concentrations were described in the Procedure (p. 33) and Fig. 25. The CD spectra of the four LC3 variants were shown in Fig. 26.
LC3 wild type seemed to have strongest signals on full spectrum; the pohosphomimetic T6D displayed a slightly higher curve showing a small shift upward, whereas that of the pohosphomimetic T12D seemed even higher; but these curves might be still considered similar. In contrast, the spectrum of ULD lacking the first 26 amino acid residues had a large signal gap around λ222.
All LC3 variants except the ULD showed strong decrease in CD signals between 215-230 nm both under the 8 M urea and the 6 M GuHCl conditions, whereas the ULD showed significant denaturation only in the 6 M GuHCl (Figs 27 & 28, note the spectra in the 6 M GuHCl had relatively higher noise than in the 8 M urea).
43
IV.4. Urea and GuHCl Denaturation Curves of the LC3s
IV.4.1. Urea Denaturation Curves (Fig. 31)
The signals of LC3 wild type began to diminish linearly when the urea challenge was increased to 5 M. Both CD222 of the phosphomimetic LC3 T6D and T12D showed decrease from 2 M urea treatment. Around the 4 M urea condition, the curves of the T6D entered a small plateau-like region; when the urea concentration rose to about 5 M, its signals began to decrease more linearly. Compared with T6D, the LC3 T12D showed the stronger signal decrease which began earlier (from 2 M urea). The CD222 of the ULD did not seem to be decreasing until the urea concentration had reached 7 M.
IV.4.2. GuHCl Denaturation Curves (Fig. 32)
Compared with the urea denaturaiton curve, the signals of both the LC3 wild type and T12D began to decrease when the GuHCl concentration just exceeded 1 M, with the decrease of the T12D’s signals more drastic. Both curves then trended upward while the signals of the wild type stayed stronger than those of the T12D throughout the curve.
44
IV.4.3. CD Spectra and Denaturation Curves of the LC3 T12D Under Different pH Conditions
The examination of pH dependence on the phosphomimetic T12D was shown on Figs 29 & 33. In Fig. 29 the CD spectra of the LC3 T12D did not show significant difference between pH 7.1 and 7.9; the urea denaturation curves of the T12D were also taken under these pH conditions (Fig. 33), and they were similar in shape and magnitude.
45
IV.5. Phosphorylation Assay of the LC3 Wild Type by PKA
The PKA activity assay using the Kemptide (average MW 771.92) showed positive result that in the presence of PKA, ATP, and magnesium ion, a significant portion of the Kemptide could be phosphorylated, showing an appearance of the mass peak 852.4 (Fig.
34).
The PKA activity assay on the LC3 wild type did not show a mass peak corresponding to its phosphorylation (about 14209 Da), but only the mass peak 14129 Da (Fig. 35b), which arose from the substrate LC3 wild type and was also observed in the spectrum of the control (Fig. 35a).
46
V. Discussion
V.1. Stability and Aggregation Distinctness among LC3 Variants
The fusion MBP-ULD could be treated with the Factor Xa at room temperature for 3 days without showing the significant appearance of the over-digested ULD as examined by the mass spectrometry (Fig. 24). This observation, together with the denaturation curves of the ULD (Figs 31 & 32) showing the notably delayed denaturations in these denaturants, suggests that the ULD itself should be a compact entity.
By contrast, in the Factor Xa treatment of the MBP-LC3 T12D, the time for the reaction at 4°C (i.e., 3 days) should not be longer than a half for that in the wild type or in the T6D (i.e., 7 days, also at 4°C), otherwise the LC3 T12D could be over-digested into smaller peptides or proteins which had been observed in the final check by MS showing a mass peak 11734 Da, corresponding to the T12D losing the first 19 amino acid residues on the NHD (data not shown). This suggests that the phosphomimetic aspartate, or probably phosphorylated Thr12, could render the NHD more accessible to the surrounding proteolytic agents, and implies that the NHD might bind less compactly with the ULD in the LC3 T12D. This idea is also supported in the denatuaration curves (Figs 31 & 32), which showed the much earlier or larger decrease of CD222 in T12D than in the wild type, suggesting lower structural stability in the phosphomimetic
47
mutant. Taking the ULD denaturation curve as reference, if this drastic decease of the CD222 could be accounted mostly by the denaturation of the α-helices, the lower stability on the T12D mutation might suggest changed dynamics on the NHD.
In this study, the ULD was more prone to aggregation than any other LC3 variants under high concentrations at the higher temperature (e.g., the high-speed centrifugation before the FPLC injection at room temperature, p. 30-31), and this might be related to the proposed function of the ULD in the LC3 multimerization;5 thus the NHDs on the LC3s are suggested to be regulatory in the play.
The pH change was reported during the progress of some autophagic activities (e.g., starvation-induced autophagy) and could range between 7.1-7.7.32 Thus the CD spectrum and the denaturation curve of the LC3 T12D, which showed the higher susceptibilities to the denaturant perturbations (Figs 31 & 32), were also taken at pH 7.9.
The results did not show significant difference both in the CD spectra (Fig. 29) and the urea denaturation curves (Fig. 33), and they thus far could not tell possible effects of the changing pH on the LC3 phosphorylation.