國立臺灣大學企業管理碩士專班 碩士論文
Global MBA College of Management National Taiwan University
Master Thesis
全球科技產業併購決策之探索研究
An Exploratory Study on Global Technology Merger & Acquisition Decisions
林敏慈 Min-Tzu Lin
指導教授:李吉仁 博士 Advisor: Ji-Ren Lee, Ph.D.
中華民國 107 年 6 月
June, 2018
Acknowledgement
I would like to thank my advisor, Professor Ji-Ren Lee, for leading me to discover
the beauty of strategy studies. His insightful guidance transforms me from a novice into
a person who can think bigger and broader. I have been greatly benefited from the
brainstorming discussions with him. His valuable comments stimulate me to think more
thoroughly.
Professor Ming-Je Tang established my fundamental concepts and principal
knowledge about industry analysis and business competition. Via his “Strategic Management” and “Industrial Economics” classes, I learned valuable ideas and
perceived his great passion for case-oriented managerial education. I really appreciate
his generosity in sharing his abundant experiences and unique observations.
I would also like to thank my lifelong partner, Kuo-Wei, for his fully support. I can’t achieve all of these and go so far without his honest criticism and inspiring
encouragement.
Abstract
The explosive global population and the unprecedented growth of urbanization challenge cities’ sustainability and efficiency. Technology is recognized as an essential
element to resolve the issues for future inhabitation. While technology is highly leveraged to improve citizens’ daily life, a city is transformed into a smart city. This
digital transformation has been disrupting several related industries across the board
and changing their competitive dynamics. This thesis is to discuss how the concept and
vision of smart city drive major global players to aggressively reconfigure their
business portfolios, especially through merging or acquiring target firms in the
information and communications technology (ICT) sector. To facilitate research
exploration, three cases (Qualcomm-NXP acquisition, Broadcom-Qualcomm proposal,
and SoftBank-ARM acquisition) are purposely identified for detailed examination on
the strategic motivations of engaging merger and acquisition (M&A) and the
consequent influences on competitive landscape. After analyzing public information,
this research discovers that the acquiring firms are faced with mature core businesses,
so they are attracted by the target firms’ growth potential for the emerging smart city
market. In addition to growth, the acquiring firms also seek for value creation. By
eliminating boundaries between firms and consolidating resources, the shared vision of
smart city can be realized more efficiently. As for the influences on competitive
landscape, these M&A measures disturb the original equilibrium of competition, more
M&As might be induced until new equilibrium is achieved. Higher market power of
the combined companies will cause redistribution of the profit pools and threaten
operations of foundries and other IC design firms. To respond to the dramatic changes
of competition, foundries have to search for breakthroughs on nanometer fabrication
technologies. Other IC design firms should fortify intellectual property portfolios,
deliver low-cost and low-power products, or reposition themselves as total solution
integrators for the surging smart city industry.
Keywords: Smart City, Merger & Acquisition, Synergy, Competitive Landscape, Internet of Things, 5G
Table of Contents
Chapter 1 Introduction ... 1
1.1 Background ... 1
1.2 Research Questions ... 2
1.3 Research Purpose ... 3
1.4 Research Methodology ... 4
1.5 Research Limitations ... 5
Chapter 2 Literature Review ... 7
2.1 Urbanization ... 7
2.2 Smart City ... 8
2.3 Strategy ... 11
2.4 Merger and Acquisition ... 14
2.5 Moving Forward ... 17
Chapter 3 Case Analysis ... 19
3.1 The Semiconductor Industry ... 19
3.2 The Qualcomm-NXP Acquisition... 26
3.3 The Broadcom-Qualcomm Takeover Attempt ... 43
3.4 The Softbank-ARM Acquisition ... 53
Chapter 4 ICT Infrastructure of Smart City ... 67
4.1 Architecture... 67
4.2 Data Acquisition ... 68
4.3 Data Communication ... 73
4.4 Data Management ... 79
4.5 Application ... 83
4.6 Technological Merger & Acquisition Deals ... 85
4.7 Strategic Fit ... 89
Chapter 5 Conclusions ... 104
5.1 Strategic Motivation... 104
5.2 Influences on Competitive Landscape ... 108
5.3 The First Milestone ... 115
5.4 Future Research Suggestions ... 117
Reference ... 121
Table of Figures
FIGURE 1:MULTIPLE CASE STUDY PROCEDURE ... 5
FIGURE 2:1988-2017WORLDWIDE SEMICONDUCTOR REVENUES ... 20
FIGURE 3:VALUE CHAIN AND OPERATING MODELS OF THE SEMICONDUCTOR INDUSTRY ... 22
FIGURE 4:QUALCOMM’S 2011-2017REVENUES AND YEAR-OVER-YEAR GROWTH RATES ... 37
FIGURE 5:QUALCOMM’S 2011-2017PROFITABILITY ... 39
FIGURE 6:NXP’S 2011-2017REVENUES AND YEAR-OVER-YEAR GROWTH RATES 41 FIGURE 7:NXP’S 2011-2017HPMSREVENUES ... 42
FIGURE 8:BROADCOM’S 2011-2017REVENUES AND YEAR-OVER-YEAR GROWTH RATES ... 50
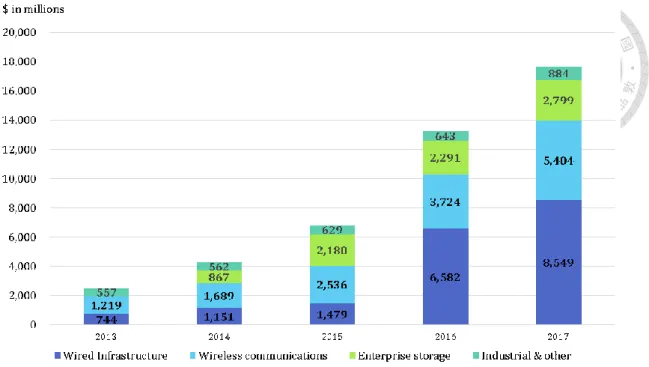
FIGURE 9:BROADCOM OPERATING SEGMENTS’REVENUES FROM 2013 TO 2017 ... 52
FIGURE 10:BROADCOM LIMITED’S 2011-2017PROFITABILITY ... 52
FIGURE 11:SOFTBANK GROUP’S 2010-2016REVENUES AND YEAR-OVER-YEAR GROWTH RATES ... 62
FIGURE 12:SOFTBANK GROUP’S 2010-2016PROFITABILITY ... 63
FIGURE 13:ARMHOLDINGS’2010-2015REVENUES AND YEAR-OVER-YEAR GROWTH RATES ... 66
FIGURE 14:ARMHOLDINGS’2010-2015PROFITABILITY ... 66
FIGURE 15:BLOCK DIAGRAM OF SMART CITY ... 67
FIGURE 16:BLOCK DIAGRAMS OF TRANSDUCER AND SENSOR ... 69
FIGURE 17:DATA COMMUNICATION BETWEEN INTERNET OF THINGS,INTERNET AND CELLULAR MOBILE NETWORK ... 75
FIGURE 18:BANDWIDTH AND LATENCY REQUIREMENTS OF POTENTIAL 5GUSE CASES ... 93
FIGURE 19:STRATEGIC MOTIVATION ... 104
FIGURE 20:INFLUENCED ON COMPETITIVE LANDSCAPE ... 114
Chapter 1 Introduction
1.1 Background
By 2030, the world’s population is estimated to grow from current 7.6 billion to 8.6 billion. 60% of global people are projected to live in cities (United Nations, 2017).
The number of megacities, cities with more than 10-million habitants, will increase
from 31 to 41 (United Nations, 2016). Such a fast-growing trend of urbanization not only implies cities’ dominance in economic development, but also indicates resource
redistribution. As cities are accommodating more residents, concerns about sustainability, safety and efficiency of cities start to surface. Cities’ infrastructures are
concluded to be vulnerable to disasters and emergencies. In 2008, IBM (International Business Machines Corporation) unveiled the concept of “Smarter Planet” which lighted up feasibility of exploiting cutting-edge technologies to resolve challenges of
future inhabitation. Since then, “Smart City” has gradually become a popular goal of cities’ transformation.
Anticipating the potential demand pull of smart city, numerous industries and
organizations are also challenged by the disruptive technology push. In a smart city, innovations from the technology industry will be highly integrated into people’s daily life. Changes of consumers’ behavioral patterns will significantly overturn companies’
existing business models. Therefore, both the demand pull and the technology push trigger companies from the tech sector and non-tech sectors to strategically expand their business portfolios to obtain the essential technologies. Special expertise makes it difficult to cultivate the technologies internally. To overcome the formidable technology barriers and catch transient market opportunities, Merger and acquisition (M&A) is a must-have means for development.
1.2 Research Questions
During the past few years, the global M&A market has rejuvenated from the financial crisis in 2008. Technology constitutes a strong growing momentum of M&A activities. In 2016, deals for technology contributed to around 30% of the global M&A market and their values reached to $700 billion (Boston Consulting Group, 2017).
Among these deals, a lot of acquiring companies originate from the non-tech sectors.
They utilize M&A as an instrument to narrow technology gap, streamline operations, improve customer experiences, pursue growth, etc. The other acquiring companies are incumbents of the high-tech industry. Instead of organic growth, they implement M&A to become bigger and more comprehensive. This phenomenon contradicts to the practice greatly appreciated by investors in the past, especially for the high-tech
industry—economy of specialization.
Based on these facts, this thesis will discuss how the vision of smart city drives global technology mergers and acquisitions. Besides, this thesis will focus on strategy analysis of recent technology M&A deals and further address the following two
questions:
Research Question 1:
What is the strategic motivation that triggers recent M&As in the information and communications technology (ICT) industry?
Research Question 2:
How will the technology M&As affect competitive landscape of the information and communications technology industry?
1.3 Research Purpose
Smart city is an emerging market that progressively attracts attention from academia and from industries because of its potential to create gigantic economic values.
As the world starts to experience the vast digital transformation toward smart city, this thesis intends to explore how firms’ intellectual properties influence the global M&A
market and identify the rationales for acquirers to seek M&A in the technology sector.
In addition, this thesis attempts to derive causal relations between technical breakthroughs and companies’ corporate strategies. After analyzing the competition and cooperation between companies, the thesis will summarize the key factors for IC design companies to succeed in the ambiguous smart city market. The discoveries are anticipated to be references for companies’ corporate strategy development and an introductive literature for academic studies of smart city.
1.4 Research Methodology
The research started with analyzing information and communications technology architecture of a smart city and then focused on recent M&A activities of the industry.
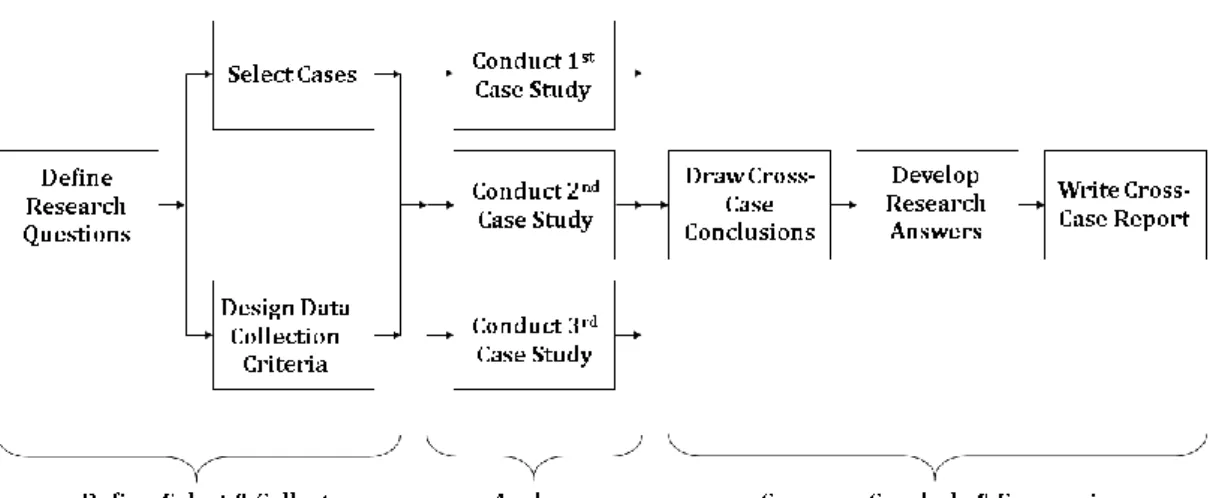
To analyze why M&A is chosen as the corporate strategy and how M&A will change the competitive dynamics, a qualitative research was conducted with the procedure as shown in Figure 1. To obtain more objective discoveries, the research adopted the qualitative, holistic and multiple-case designs described by Yin (2003) for case study to characterize three recent M&A activities of the semiconductor industry: the Qualcomm-NXP acquisition, the Broadcom-Qualcomm proposal and the Softbank-
ARM Holdings acquisition. The three deals were selected because of their
representative of technology and influence on industry structure. Data were collected
from public sources like U.S. Securities and Exchange Commission, companies’
websites, industry analyst reports, news, accounting and consulting firms’ reports, etc.
By analyzing each firm’s status quo and comparing characteristics of the three cases, the research drew cross-case conclusions and finally provided suggestions to the research questions.
Figure 1: Multiple Case Study Procedure
1.5 Research Limitations
Analysis of this thesis is purely based on public information, so it might lack insiders’ unique vision of evaluating strategic moves. Besides, the thesis focuses on
case studies of three megadeals in the information and communications technology
industry. This might constraints the findings on generalizability for small-sized
companies. Conducting interviews and surveys on the involved management teams might be beneficial to realize companies’ concerns and motivations in depth. Collecting
and comparing more detailed data of various-sized deals would improve thoroughness of the discoveries.
Chapter 2 Literature Review
2.1 Urbanization
Smith (1776) stated that the division of labor is not originally the effect of human
wisdom, but the necessary consequence of human nature. Based on this proposition, O’Sullivan (2000) explained why a city exists from an economic point of view. Because an individual can’t be self-sufficient, humans need to exchange their labor for the needs.
When more and more people aggregate in physical proximity, opportunities to satisfy the needs and exchange labor become much more abundant. The proximity gradually evolves into a city. In addition, comparative advantages between different regions lead to the development of market cities. Internal scale economics triggers the formation of industrial cities. Agglomerative economics stimulates the growth of urbanization.
The National Research Council (2003) of the United States described the process of urbanization as a population shift from agriculture-centric settlements toward industry-and-service-centric settlements. Levels of urbanization are usually classified according to numbers of population, population density, percentage of urban to overall population, economic activities, etc. Intervals of levels are adjusted over time to reflect changing patterns of settlement. The World Bank (2009) analyzed the global urbanization trend from the 3-D aspects—density, distance and division. The United
Nations (2015) indicated the global urban population exceeded the rural in 2007 for the first time in history and expected the trend to continue.
Coming with the unprecedented growth of global urbanization, demands from cities for natural resources and public services also increase dramatically. Cities are under substantial stress to search for the optimal balance between the economic and environmental trade-off. On one hand, cities are assumed to be the hubs boosting economic development by utilizing limited resources efficiently, so the residents can enjoy a prosperous life with great quality. On the other hand, while cities only occupy less than 5% of the global land, they constitute more than 66% of energy consumption and produce over 70% carbon emissions (Global Environment Facility, 2014). Cities are recognized to be responsible for pursuing sustainability, especially after the Paris Agreement ratified by 173 parties of the United Nations in 2016. How to achieve both the economic and environmental goals simultaneously under numerous constraints?
Technology might be the key.
2.2 Smart City
Technology used to be viewed in several futuristic studies as the outcome of cities’
civilization development that will eventually depress the growth of cities. Toffler (1980)
predicted advanced telecommunications technologies will enable people to move back to the rural areas and work in electronic cottages instead of cities. People might migrate less because of business, but travel more for leisure. Gaspar & Glaeser (1998) disapproved this kind of opinions by investigating if improvement in information technology will decline face-to-face interactions and obsolete cities. Their study indicates telecommunications might be more a complement to rather than a strong substitute for face-to-face interactions and cities. Graham (1997) clarified transport and telecommunications flows incline to reinforce each other in reality.
Telecommunications technology further creates the demand for physical co-presence from distant interactions. Actually, technology shapes cities to become more aggregate centers of human activities.
As the global urbanization trend becomes stronger, technology is considered as an essential element of cities’ growth, especially to close the gap between economic
development and environmental sustainability. Technological breakthroughs over periods turn imaginative ideas into “smarter” and feasible solutions. When technologies are highly correlated with and leveraged into citizens’ daily life, cities’ core operational
systems can be advanced to provide customized services, reduce safety threats, eliminate traffic congestion, speed up communications connectivity, enhance business efficiency, lower water waste and smooth energy consumption (IBM, 2009). At this
moment, a city transforms to a smart city.
The definition of smart city evolves rapidly. Albino et al. (2015) summarized various definitions of smart city and mentioned scopes of smart city have been extended from technology to including people and community needs. Ramaprasad et al. (2017) used an otology to characterize the logic of smart city’s definitions. They revealed the social science field further exploits smart city to address social and human concerns and ecological issues. The United Nations adopts the following comprehensive definition established by The International Telecommunication Union to describe smart
city (United Nations Human Settlements Programme, 2016):
“A smart sustainable city is an innovative city that uses information and communication technologies (ICTs) and other means to improve quality of life,
efficiency of urban operation and services, and competitiveness, while ensuring that it
meets the needs of present and future generations with respect to economic, social, environmental as well as cultural aspects”.
Among various definitions, the consistency is that technology is a necessary component to construct a smart city. To create the values of smart city, technology is greatly utilized to overcome sociological, economical, psychological and ecological challenges resulting from urbanization.
2.3 Strategy
As cities are transforming to be smarter, technology is changing people’s behavioral patterns. Meanwhile, technology is disrupting industries and reshuffling business competition. To respond to the structural conversion, companies have to review market dynamics, scrutinize operations and redesign business models.
Inevitably, companies must formulate new strategies.
Strategy analyses always start with understanding the external environment—the competitive landscape. Martin (2005) depicted history of the Structure-Conduct- Performance (S-C-P) Paradigm developed by industrial economists. The S-C-P
framework argues that basic conditions of an industry affect industry structure, industry structure determines firms’ behaviors, and firms’ behaviors eventually determine
profitability of the industry. The S-C-P approach provides companies a complicated tool to analyze imperfections of the market. Porter (1979) simplified the S-C-P Paradigm to his prestigious Five-Forces Framework. This new framework assists companies in systematically identifying the five major participants of business competition. Brandenburger & Nalebuff (1995) applied game theoretic concept to analyze dynamics of industries. They established the Value Net Framework and introduced complementors as a new player in business games. The Value Net Framework encourages companies to think about both cooperative and competitive
approaches to change the games, not just to play the games.
After realizing external factors, strategy analyses continue with positioning and aligning activities. In the article “What is strategy?” Porter (1996) clarified the
differences between operational effectiveness and strategic positioning. The former represents performing similar activities better than rivals do. The latter is performing similar activities in different approaches or even performing different activities. In short, strategy is about being different to deliver unique values. Besides, trade-offs are vital to strategy. Strategy is to make hard decisions on trade-offs, so companies can acquire sustainable advantages by creating consistent, reinforcing and optimizing fits among their activities.
Strategy formulation should correspond with companies’ organizations. Vancil &
Lorange (1975) decomposed strategy implementation for a diversified corporation into three levels—corporate strategy, business strategy and functional strategy. Planning processes of strategy in complex organizations require formal interactions across different levels of the organizational hierarchy. Salimian et al. (2012) summarized literature of the three strategy levels. Corporate strategy is designed for multi-business corporations to create values, configure organizations, coordinate businesses and allocate resources among different business units. Corporate strategy focuses on where to battle and involves decisions in diversification, merger and acquisition, divestiture
and internationalization. Business strategy is also recognized as competitive strategy.
It focuses on how to contest and relates to strategic positioning, competitive advantage and business model for competition. Functional strategy focuses on how to implement practices of each functional team like marketing, manufacturing, finance, supply chain, human resource, etc., so the overall activities are aligned to support business strategy.
In other words, corporate strategy governs business strategy and the latter sequentially regulates functional strategy in diversified companies. Once the battlefields are locked down by corporate strategy, companies strive to win the competition via business strategy which is achieved by implementing functional strategy.
Porter (1987) illustrated corporate strategy is to make the value of a company as a whole greater than the sum of its business units. This indicates corporate strategy is to create synergy. Only when interrelationships between different businesses are
meaningful for producing synergy, corporate strategy is successful in adding shareholders’ values. Otherwise, corporate strategy might just purely perform as
portfolio management that shareholders can also achieve by themselves through properly diversifying capital in an efficient financial market.
2.4 Merger and Acquisition
Merger and acquisition is one of the tactics used by companies for corporate strategy. Gomez et al. (2011) explained the differences between merger and acquisition.
Merger is that two companies combine into a single entity rather than remain owned separately and operate independently. The single entity comprises activities of the two combined firms. Acquisition is that one company takes over another company. By establishing the ownership, the acquiring company can control and dominate the acquired firm.
Gaughan (2007) elaborated some popular strategic motivations of companies to
execute merger and acquisition. When timing is a very sensitive factor to achieve companies’ strategic goals, M&A will be implemented instead of relying on organic
growth. M&A is also a preferred choice for expansion into an unfamiliar geographic region, elevation in market share and enhancement of market power. M&A provides companies an opportunity to diversify into another fast-growing or more profitable business. M&A can be an instrument to secure key resources like raw materials,
channels, patents, talents and research and development, so companies can gain long- term competitive advantages. Furthermore, M&A might increase shareholders’ values
by creating synergy. Synergy can be constituted from operations and corporate finance via M&A. By merging and acquiring another firm, a company might be able to increase
revenue and reduce cost rather than two organizations operate irrelevantly. Besides, if cash flows of two companies are not perfectly correlated, M&A might benefit the
combined entity with lower cost of capital because of reduced risks. Another financial synergy can be tax saving, though it’s not a very popular motivation stimulating
companies to employ M&A.
Gaughan also categorized M&A activities into three types based on their integrating direction on industry value chain. When two companies competing in the same business agree to combine together, this M&A is horizontal merger because it represents horizontal integration of the industry. When two companies with upstream- downstream relationship in an industry, their combination is vertical merger which results in vertical integration of the industry. If a company intends to combine another firm which is neither in competition nor in upstream-downstream relationship, it’s practicing conglomerate merger via M&A. Under this scenario, the company is doing unrelated diversification from one industry to another different industry.
M&A for horizontal integration, vertical integration and unrelated diversification
might correspond to stages of an industry life cycle. Carlton & Perloff (2005) illustrated how development of an industry can affect companies’ decisions on vertical integration
or specialization. Deans et al. (2002) depicted how industry concentration varies with stages of industry consolidation and predicted an industry will go through all four stages
even quicker in the future. In summary, when a young industry is small, specializing in an activity does not pay for a firm, so all firms in the industry are vertically integrated to handle the entire production process. As an industry grows, firms are vertically disintegrated because transaction costs of each unit falls. Specialization in an activity starts to make business sense. If economy of scale significantly influences production costs, different firms will be more willing to combine together to obtain synergy in operational efficiency. M&A for horizontal integration might occur. As an industry matures or declines, its size shrinks. Firms will return back to be vertically integrated or look for opportunities of unrelated diversification to keep growth momentum.
Historically, M&As tend to occurs in cyclic waves. The Boston Consulting Group (2007) summarized six M&A waves from 1897 to 2006 and identified the major factors promoting each wave. The 6th wave ended suddenly because of the global financial crisis in 2008. Harford (2005) identified economic, regulatory and technological shocks drive M&A waves when sufficient overall capital liquidity is available. However, if macro-level liquidity does not exist, these shocks won’t cause M&A activities aggregate in time. Therefore, capital liquidity is the necessary component for economic, regulatory and technological shocks to drive M&A waves. Harford’s research provides hints to explain why M&As rebounded in the past few years. As central banks keep quantitative easing measures to recover the global economy from the financial crisis,
the 7th M&A wave starts. Meanwhile, technological breakthroughs disrupt various
industries. Companies abruptly acknowledge they have been unconsciously losing their foundations. It’s time to reconsider their corporate strategies. M&A seems to be a
feasible and efficient shortcut for long-term value creation.
2.5 Moving Forward
While macroeconomic conditions spur the 7th wave, technology M&As flourish.
Technology not only carries formidable threats but also highlights vast opportunities.
Urbanization is enlarging cities. The demand for smart city is emerging. Technology building smart city is advancing. Corporate strategy is changing. Under this atmosphere, companies are eagerly participating in technology M&A, no matter they belong to the tech sector or the non-tech sectors.
In a young and small industry, firms are prone to be vertically integrated. To grasp opportunities of smart city, empirical cases of recent technology M&A activities show that except for vertical integration, companies are also aggressively handling horizontal integration and unrelated diversification. These M&As will eventually alter orders of industries and sway competitive landscapes. This thesis will focus on the information and communications technology industry and try to clarify strategic motivations and
competitive consequences of the technology M&As for forming smart city.
Chapter 3 Case Analysis
3.1 The Semiconductor Industry
Motivated by the vigorous demand of personal computers, the semiconductor industry burgeoned with a compound annual growth rate greater than 15% during the 1980s and 1990s (U.S. Department of Commerce, 2016). Popularity of communications devices and consumer electronics further stimulated the market expansion. However,
based on the larger market foundation and restrained by the burst of Dot-com Bubble and the 2008 financial crisis, the industry’s 5-year compound annual growth rates on
average approached to 5% in the past two decades.
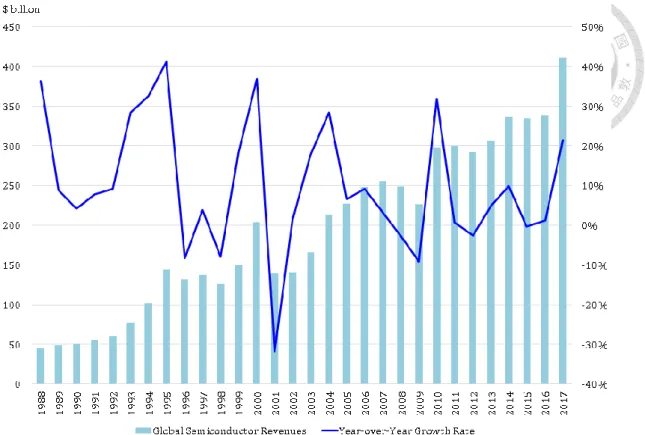
Roughly speaking, the global semiconductor revenues grew quite stably, from $45
billion in 1988 to $412 billion in 2017 as shown in Figure 2. However, if viewed with a finer scope, the industry’s year-over-year growth rates fluctuate dramatically. The
volatility gets amplified by the global economic booms and recessions. Severe cyclicality of revenues affects operating models chosen by semiconductor companies.
Figure 2: 1988-2017 Worldwide Semiconductor Revenues
Source: McKinsey & Company (2015b) and Semiconductor Industry Association (2016a, 2018)
Integrated Circuits (ICs), the finished products of the semiconductor industry, can be categorized into two types: standard chips and specialized chips. Standard chips usually are common components used in various electrical systems, such as Dynamic Random Access Memory (DRAM) and Flash Memory. Different manufacturers can produce identical standard chips with almost no differentiation in functionality.
Moreover, standard chips can be designed to be totally footprint-compatible, so they can be easily replaced by other brands without causing any issue of systems’ operations.
The homogeneous characteristic makes standard chips traded like commodities in the
market. They are demanded in large volumes, but constitute lower profit margins due to the competition over price. Specialized chips are proprietary products of companies.
Their performances, functionalities and footprints differ significantly. Once specialized chips are locked down by electrical system designers, signal routings of the whole circuitry on the Printed Circuit Boards (PCBs) are uniquely optimized to match characteristics of the selected chips. No identical substitution exists to make the same system work properly without any modification. Normally specialized chips require more research and development resources and they are what companies can differentiate themselves from others. Demands for specialized chips can be high or low in volumes, which is up to demands of the electrical systems. Specialized chips are usually purchased directly from IC suppliers via individual case-sensitive contracts.
ICs are non-perishable products with high ratios of economic value to weight.
Transportation costs are relatively insignificant, so the semiconductor industry is a global market where companies located in diverse geographic zones compete or collaborate jointly. Companies in the industry require talented scientists and engineers to highly engage in research and development for patent creation, technology advancement, and product development. With appropriate designs, ICs are durable goods that can work reliably for years. However, rapid breakthroughs in technologies and expectation on improved customers’ experiences result in frequent replacements of
system devices, which in turn causes ICs being obsoleted much earlier than they start to malfunction. Therefore, prices of ICs decline quickly over time. Besides, severe
cyclicality of demands promotes disequilibrium between demand and supply, which consequently leads to prominent fluctuations on IC’s prices.
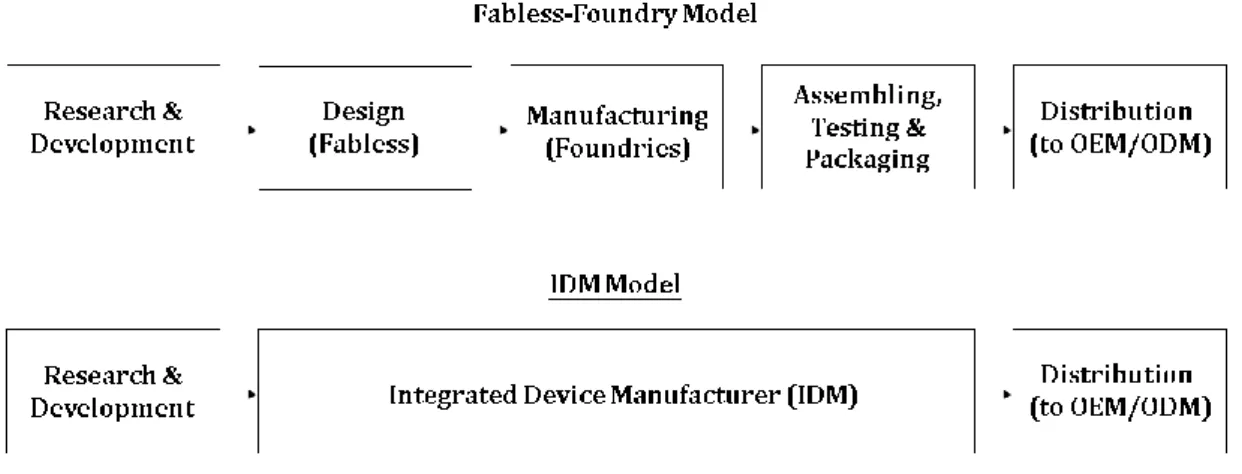
Figure 3: Value Chain and Operating Models of the Semiconductor Industry
Source: Semiconductor Industry Association (2016b)
As Figure 3 indicates, value chain of the semiconductor industry can be briefly categorized into five activities: research & development, design, manufacturing, assembling, testing & packaging, and distribution. Advanced fundamental research &
development studies are usually conducted by non-profit institutions, like CEA-Lti from France, IMEC from Belgium, ITRI from Taiwan, and two U.S.-based organizations, SEMATECH, and Semiconductor Research Corporation. Based on innovations discovered by the research and development institutions, ICs are designed
to optimize cooperation of electronics components and routings of circuits, so the whole circuitries can perform desired functionalities. Manufacturing realizes circuit designs.
This step creates circuit traces and sculptures electronics components on silicon wafers.
After complex circuities are miniatured on chips, the integrated circuits are assembled, tested, and packaged to ensure performances meeting electrical, mechanical and thermal specifications. Finally, finished ICs are distributed to Original Equipment Manufacturers (OEMs) and Original Design Manufacturers (ODMs) to be integrated into electrical systems for miscellaneous applications.
Each activity of the value chain requests specialized skills and technologies.
Besides, required capital investments differ significantly along the entire value chain.
Fundamental research & development is usually supported by governments, academia and dominant companies due to uncertainties of commercializing pioneering
innovations with decent returns. IC design requires talented engineers to create proprietary designs which outperform competitors’. IC design also highly relies on
engineers to acquire patents for protecting and differentiating companies. As for manufacturing, it consumes tremendous financial resources for capital reinvestments to establish competitive advantages and prevent from potential entrants. Besides, engineers have to expertize in fine tuning all kinds of manufacturing parameters to boost yield rates and attain leadership of learning curves. The step of assembling,
testing and packaging used to be a relatively labor-intensive activity. However, as packaging technologies improve, the task appears to be skill-intensive as well.
Distribution of finished integrated circuits closely collaborates with supply chain procurement of OEMs and ODMs. Logistic efficiency, intelligence collection and demand forecasts are crucial for being responsive to market dynamics.
Differences in specialization and capital requirements impact companies’
operational models under the cyclical characteristic of revenues. The fabless-foundry model represents vertical specialization. Companies focus on a particular activity of the semiconductor value chain. Fabless IC design houses recruit talented professionals to optimize circuitries and research technological breakthroughs. By outsourcing fabrication to foundries, IC design houses employ little capital investments and remain more operational flexibility. Because of lower entry barrier for capital, IC design easily attracts startups with innovative ideas to join the industry. By serving numerous fabless IC design houses, foundries can achieve higher capacity utilization rates, spread out formidable overheads, and obtain advancement on learning curves. The same operational logic also applies to companies devoting to assembling, testing and packaging. Focus strategy usually benefits managerial simplicity. Therefore, the fabless-foundry model is widely accepted by most companies of the industry. For example, Qualcomm, AMD and MediaTek are the representative fabless IC design
companies; Taiwan Semiconductor Manufacturing Company (TSMC) is by far the largest foundry company of the world; Advanced Semiconductor Engineering (ASE), Amkor Technology and JCET are the major outsourced semiconductor assembly and test (OSAT) companies.
The other operational approach is the integrated device manufacturer (IDM) model.
Companies operating at this model participate in all steps of IC design, fabrication, and assembling, testing & packaging. In other words, the IDM model exercises vertical integration of the value chain. Due to the high capital requirements of manufacturing, companies adopting the IDM model usually are worldwide major players of the industry, such as Intel, Samsung, Micron, Texas Instruments, Infineon and NXP. IDM companies contribute most of the industry revenues. However, they enjoy lower growth
rates than fabless companies do. From 1998 to 2012, the compound annual growth rate for IDMs is 5% while it’s 18% for fabless companies (Qualcomm, 2013). Even though
vertical specialization seems to be a more reasonable measure for operational efficiency, some companies still remain vertical integration as IDMs to avoid transaction costs or pursue strategic effects. However, a trend that IDMs outsource partial of fabrication to foundry suppliers or OSAT companies emerges recently. The mixed operational model is referred as fab-lite. By operating at the fab-lite model, IDMs can avoid costly expenses to regularly upgrade facilities with cutting-edge equipment.
In fact, at dawn of the semiconductor industry in 1950s, companies by nature had to be IDMs covering all activities of the value chain. Since 1985, the industry structure has gradually evolved from vertical integration to vertical specialization because the expanding market size is large enough to pay for specialized firms. Besides, technological innovations, patent licensing and intellectual property transfers between firms and across borders further facilitate the shift to specialization and globalization (Macher & Mowery, 2004). Nevertheless, as the industry’s compound annual growth rate converges to 5%, people begin to wonder if the semiconductor industry reaches the maturity plateau of an industry life cycle. If the industry does mature, the decline phase might follow on the heels. Recent M&A activities of the industry seem to alter the trend of specialization. Are these M&As intended to preempt other players in a deteriorating game? Or, in contrast, they are aimed to ambitiously pioneer in another emerging growth potential—the era of smart city?
3.2 The Qualcomm-NXP Acquisition
On October 27, 2016, Qualcomm Incorporated (NASDAQ: QCOM) and NXP
Semiconductors N.V. (NASDAQ: NXPI) announced Qualcomm will acquire NXP with cash on hand and new debt. The acquisition had been unanimously approved by both
companies’ boards of directors. The agreement was based on a tender offer provided by a subsidiary of Qualcomm to acquire all NXP’s issued and outstanding shares for
$110.00 per share in cash. This deal represented NXP’s enterprise value was almost
equivalent to $47 billion (Qualcomm, 2016a). After the announcement, the U.S. stock market encountered a strong bull year in 2017. NXP’s stock price increased by 19.2%, from $98.21 to $117.09 per share, but Qualcomm’s stock prices decreased slightly from
$65.53 to $64.02 per share during the same period regardless of the exuberant atmosphere. In that year, NXP’s non-GAAP operating income grew by 20%, compared with the results of 2016. Excellent earnings performances bolstered NXP’s investors to argue that Qualcomm’s original $110.00 per share offer was too low. To cease the
objection, on February 20, 2018, Qualcomm announced an amended agreement to
increase the acquisition price to $127.50 per share for nine NXP stockholders who collectively own more than 28% NXP’s outstanding shares. The nine stockholders
include hedge funds Elliott Advisors (UK) Limited and Soroban Capital Partners LP.
Besides, the agreement also lowers the minimum tender condition of NXP’s
outstanding shares from 80% to 70% (Qualcomm, 2018).
Since the acquisition was announced, Qualcomm has been actively trying to obtain antitrust clearance from nine regulatory authorities across the globe. By the end of February 2018, Qualcomm has received approvals from eight of the authorities. The
only pending clearance from the Ministry of Commerce (MOFCOM) in China is in final review stage, and Qualcomm is optimistic the transaction will be approved by MOFCOM pretty soon.
Qualcomm Incorporated
Qualcomm is a semiconductor company based in San Diego, California, U.S.A.
The company was founded in 1985 to build “Quality Communications” for the world.
Qualcomm concentrates on telecommunications products and is a pioneer in commercializing the Code Division Multiple Access (CDMA) technology for business applications. CDMA is a digital wireless communications technology previously used by the U.S. military. Messages that senders want to transmit are mixed with pseudo- random codes of higher frequency. Intended or unintended users may catch the transmitted signals over the air, but only users with the identical pseudo-random codes can recognize the messages. Comparing to other wireless technologies available in the market during 1980s and 1990s, CDMA is superior in providing secure communications, allowing more flexible use of bandwidth, and accommodating more users to communicate simultaneously. Except for the fundamental CDMA technology, Qualcomm develops several critical accompanying technologies to enhance performances of the CDMA communications systems. Qualcomm highly integrates all
the technologies into single integrated circuits and builds up a comprehensive patent portfolio to firmly secure its CDMA dominance. Therefore, when CDMA becomes the basic standards of the 3rd Generation (3G) cellular communications systems, Qualcomm gains gigantic profits by monetizing the CDMA patents.
Technological evolution never stops, so does Qualcomm. To elevate data rates and spectral efficiency, the 4G mobile communications standards define Orthogonal Frequency Division Multiple Access (OFDMA) as the wireless transmission technology. The basic concept of OFDMA is to divide a whole available bandwidth into a large number of smaller bandwidths whose center frequencies are orthogonal to each other mathematically. A series of data packets are separated into different streams and then transmitted at the orthogonal center frequencies concurrently. Besides higher data rates, parallel processing and transmission of signals enable OFDMA to work together with the Multiple Input Multiple Output (MIMO) antenna technology to cancel out signal distortions occurred during wireless transmission. Experiences and leadership in the 3G systems nourish Qualcomm to stride early in the development of OFMDA wireless technologies. Just like what it does in the 3G CDMA systems, Qualcomm again pioneers in OFDMA-related patents and dominates the 4G mobile market. As for the 5G cellular mobile network to realize smart city, OFDMA is assumed to be the foundation of a unified air interface to support extreme variations of wireless
connectivity services. Therefore, Qualcomm’s heritage in the OFDMA technologies for
4G solidifies its current leadership in 5G technological development.
As for operational model, Qualcomm concentrates on fabless IC design and employs around 33,800 employees across the globe. It outsourced IC fabrication to TSMC, Samsung Electronics Co. Ltd., Global Foundries Inc., United Microelectronics Corporation, and Semiconductor Manufacturing International Corporation. IC assembling, testing and packaging activity has been assigned to suppliers like ASE, Amkor, Siliconware Precision Industries Co., Ltd. (SPIL) and STATS ChipPAC Ltd.
(Qualcomm, 2017).
NXP Semiconductors N.V.
Because of the attempt to shift away from the cyclical semiconductor market and the intention to focus on healthcare and lifestyle products, Royal Philips Electronics sold its semiconductor business, Philips Semiconductors, to a consortium of private equity firms in 2006. The consortium includes Kohlberg Kravis Robert & Co. (KKR),
Bain Capital, Silver Lake Partners, Apax Partners, and Alplnvest Partners. 80.1% of Philips Semiconductors’ shares were acquired by the consortium and Royal Philips
Electronics retained the remaining 19.9%. At the same time, the company’s name was changed to NXP Semiconductors N.V., which represents “Next eXPerience”. NXP
keeps its Dutch nationality and headquarters in Eindhoven, Netherlands.
It seemed the independence from Royal Philips Electronics could allow the semiconductor business to realize its full potential for more opportunities. However, under Philips, the business mainly served internal customers from other divisions. The products were not developed to best match market opportunities. Privatization burdened NXP with $6 billion debts. What made situations even worse was the global financial crisis in 2008. The firm was on the brink of collapse due to cash shortage (Volberda et al., 2018). In 2008, NXP sold its Mobile and Personal business to get more than 1 billion euros to save the company. At the same time, NXP shrunk its size by reducing 32% of employees. Through a series of practices to decrease involvement in fundamental R&D, focus on applied engineering, avoid highly cyclical businesses dominated by very few global buyers, and target emerging niche markets, the company finally turned around and went public in 2010.
NXP announced its $40 billion merger with Freescale Semiconductor, Ltd. in 2015.
NXP used to compete with U.S.-based Freescale in several businesses. Through this horizontal integration, NXP establishes itself as the top 1 leader in both the automotive semiconductor market and the general-purpose microcontroller products. Furthermore, the merged company becomes the powerhouse of High Performance Mixed Signal
(HPMS) ICs and the 5th largest non-memory semiconductor in the world. A microcontroller (MCU) is a compact IC including processing units, memory, and input
& output peripheral interfaces. Microcontrollers perform like small computers to automatically govern operations and storage of digital signals. Capabilities of implementing computations at low costs stimulate microcontrollers to be widely used in automobile electronics systems like Anti-lock Braking System. High Performance
Mixed Signal ICs contain microcontrollers and circuitries handling analog signals from power units, radio waves, sensors, etc. By combining microcontrollers’ digital
processing capabilities with analog circuitries, High Performance Mixed Signal ICs can be designed as smart sensors for all kinds of data acquisition. Therefore, NXP’s merger
with Freescale greatly accelerates its strategy for smart city—to provide “Secure Connections for a Smarter World.”
NXP hires around 31,000 employees in more than 33 countries. Except for IC design, NXP also participates in manufacturing activities and owns 5 wafer fabrication sites and 4 assembling & testing facilities. In other words, NXP is an integrated device manufacturer. Meanwhile, NXP also outsources some tasks to foundry suppliers and OSAT. Therefore, NXP operates at the mixture of fabless-foundry and IDM models.
Operating Segments
Qualcomm has three operating segments: QCT (Qualcomm CDMA Technologies), QTL (Qualcomm Technology Licensing) and QSI (Qualcomm Strategic Initiatives).
QCT is the IC chipset business which sells integrated circuit products of CDMA,
OFDMA and other technologies. QCT also licenses system software to manufacturers who use Qualcomm’s IC solutions in their system products. QTL basically is the
licensing business which grants official rights to use portions of Qualcomm’s intellectual property portfolio. Operating revenues of QTL include license fees and royalties. Unlike license fees to be paid in fixed amounts, royalties are generally charged as a percentage of the wholesale selling prices of manufacturers’ finished products with deductible allowance for costs in transportation, insurance, packaging, and other Qualcomm-permitted items. QSI focuses on strategic investments for new market and technology opportunities. Most of QSI’s investments are non-marketable equities and convertible debts of startup companies in digital media, e-commerce, healthcare and wearable devices.
Among the three operating segments, QCT and QTL conduct major operating activities of Qualcomm. QCT on average constitutes around two thirds of revenues and QTL brings in almost the remaining one third. QCT mainly serves markets for mobile
computing, networking, automotive, healthcare, and Internet of Things. The IC chipset product portfolio includes mobile processors, cellular modems, server processors,
platforms, embedded platforms, Bluetooth products, Wi-Fi products, and radio frequency products. Qualcomm’s strengths in wireless communications make QCT’s
IC chipsets widely utilized as core components of smartphones, 3G and 4G cellular network systems and mobile personal computers. QCT competes aggressively with several international suppliers such as Broadcom Limited, Intel, Marvell Technology, Maxim Integrated Products, MediaTek, Nvidia, Realtek Semiconductor, Renesas Electronics Corporations, Samsung Electronics, etc. in several markets. For markets
dominated by few large customers, like the smartphone market, QCT is also seriously challenged by customers’ intentions to internally develop their own chipsets.
Qualcomm’s comprehensive intellectual property portfolio in digital wireless communications technologies equips the QTL licensing business with incomparable
market power. The monopoly status in CDMA-based and OFDMA-based patents even allows Qualcomm to request royalties from its competitors’ customers. Therefore, even though QTL’s operating revenues are relatively small in size comparing to QCT, the
licensing business possess much higher profit margins than the IC chipset business.
Around 80% of QTL’s operating revenues remain as earnings before taxes, while the ratio is about 17% for QCT. Hence, QTL contributes more than 70% of the company’s
profits. In other words, the licensing business is the company’s bonanza.
NXP used to be organized into two operating segments: Standard Products and High Performance Mixed Signals (HPMS). The Standard Products business sells standard chips that are demanded in large volumes. Due to the homogeneous
characteristic of standard chips, the Standard Products business competes with others over prices and stringent levels of quality. The business accounted for 13% of NXP’s
revenues in 2016. On June 14, 2016, NXP announced the decision to divest the Standard Products business to a consortium of Chinese investors including Beijing Jianguang Asset Management Co., Ltd (JAC Capital) and Wise Road Capital LTD for $2.75 billion. The divestment was quickly completed on February 7, 2017. This transaction enables NXP to fully concentrate on the HPMS business which has growth outperforming the overall semiconductor market, high entry barriers, loyal customers, stable prices and lower long-term capital requirements.
In contrast to the Standard Products chipsets, NXP’s HPMS products specialize in niche opportunities and are highly differentiated by application-specific features. The HPMS business serves more than 25,000 customers across the globe in fragmented markets of four scopes: automotive, secure identification solutions, secure connected devices and secure interfaces and infrastructure. For the automotive sector, the HPMS
chipsets can support applications such as keyless car access, immobilizers, car infotainment, Advanced Driver Assistance System (ADAS), telematics, Anti-lock Braking System (ABS), transmission and throttle control, battery management, sensors,
etc. The HPMS products are embedded in passports and banking cards for security and identification management. NXP’s microcontrollers deliver secure features in
connected devices like cellular phones, tablets, personal computers, televisions, and industrial equipment. Besides, the HPMS chipsets are integrated in infrastructures of
wireless base stations and satellite & cable television networks for security control.
NXP’s HPMS business is actively engaged in the four diverse areas as the dominant leader. Especially in the automotive market which contributes to 41% of the company’s
revenues in the 4th quarter of 2017, NXP is the top one automotive semiconductor supplier in the world. Furthermore, the broad product portfolio of secure connected
devices combining microcontrollers, short-range radio frequency technologies, security and sensors sets up NXP’s solid foundation to expand into the emerging Internet of
Things market.
Financial Performance
Figure 4: Qualcomm’s 2011-2017 Revenues and Year-over-Year Growth Rates
Source: Qualcomm Incorporated Annual Reports Form 10-K
Figure 4 illustrates Qualcomm’s sales during 2011 and 2017. After reaching the peak in 2014, Qualcomm’s annual revenues have been declining for three straight years.
Year-over-year growth rates plummet significantly. Qualcomm’s businesses highly rely on a few big customers in the smartphone market. Apple Inc. and Samsung Electronics individually comprise more than 10% of the revenues. The two Chinese manufacturers, GuangDong OPPO Mobile Telecommunications Corp. Ltd. and vivo Communication Technology Co., Ltd., collectively comprise more than 10% of the
revenues. These four customers compose 51% of revenues in 2017. Slowdown of the smartphone market suppresses QCT’s IC sales. The volumes of shipped Mobile Station
Modem (MSM) ICs, which perform voice and data communications, multimedia
applications and global positioning functions for wireless devices, drop from 932 million for 2015 to 804 million for 2017. Following weak IC sales, the QTL’s licensing business retrogrades accordingly. This further ceases the company’s growth momentum and remarkably deteriorates the company’s profitability.
Except for disappointing business performances, Qualcomm’s monopoly power in the licensing business induced resistance around the world. In 2015, Qualcomm agreed to pay a $975 million fine imposed by the National Development and Reform Commission (NDRC) of China to end the 14-month government investigation into antitrust violations. In 2017, the Korea Fair Trade Commission (KFTC) decided to fine Qualcomm approximately $927 million. The Taiwan Fair Trade Commission (TFTC) also imposed a $778 million fine due to violation of the Taiwan Fair Trade Act. More than the regulatory issues, lawsuits with customers also happened. In 2017, Qualcomm
awarded BlackBerry with $940 million in the arbitration for BlackBerry Limited’s royalty overpayment. Apple Inc., one of Qualcomm’s largest customers, filed a patent
infringement dispute with Qualcomm and decided to underpay the requested royalties.
This dispute also made Apple’s suppliers, like Hon Hai Precision Industry Co.,
Ltd./Foxconn, follow the same underpay actions against Qualcomm. These litigations further negatively impacted Qualcomm’s financial results in 2017.
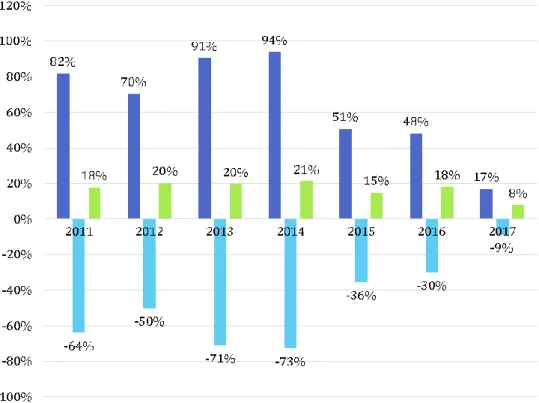
Figure 5: Qualcomm’s 2011-2017 Profitability 1
Source: Qualcomm Incorporated Annual Reports Form 10-K
Impotent sales and antitrust pressure trouble Qualcomm’s financial performance.
Return on equity (ROE) dramatically reduces to 8% in 2017 as shown in Figure 5. ROE
1 In this thesis, calculations of RNOA, nonoperating return and ROE follow the definitions specified by Easton et al. (2017).
can be decomposed into operating return and nonoperating return. Many high-tech
companies prefer to hold large amounts of cash and marketable securities, so they can gain flexibility to promptly react to market opportunities and competitors’ measures.
Because of the excessive liquidity, high-tech companies usually maintain negative nonoperating returns that penalize ROE performance. Qualcomm adopts the same approach and keeps its nonoperating returns at the negative level from 2011 to 2017.
However, starting from 2015, Qualcomm has been greatly increasing its financial leverage by incurring both short-term and long-term debts. This stimulates the nonoperating returns to increase from -36% to -9% in spite of Qualcomm’s cash on hand approaching an extraordinary high level in 2017. The negative impacts on ROE from nonoperating returns have been limited to smaller scales. Therefore, the major factor for the shrinking ROE is not the growing nonoperating return, but the
disappointing operating return in reality. Operating return is measured as return on net operating assets (RNOA). 2015 is the year that Qualcomm’s RNOA plunged almost by one half of the previous year’s level. The situation became even more serious in 2017.
RNOA hit the record low 17%. The dissatisfactory operating results correspond to the sluggish smartphone market and the litigation issues.
Figure 6: NXP’s 2011-2017 Revenues and Year-over-Year Growth Rates
Source: NXP’s Official Website for Investor Relations, NXP Historic Financial Model.
Figure 6 depicts NXP’s sales during 2011 and 2017. NXP’s revenues increased stably from 2011 to 2014. The robust growth was mainly driven by the HPMS business.
In 2015, the HPMS growth was partially offset by decreases in the Standard Products business and manufacturing operations. Besides, the divestment of the RF Power business to Jianguang Asset Management Co. Ltd (JAC Capital) on December 7, 2015 also restrained overall revenue performance in the 2015 and 2016 fiscal years. The acquisition of Freescale greatly boosted NXP’s growth in 2016, especially for the HPMS business, which enjoyed a 71% increase in operating revenues. The combined
HPMS business from NXP and Freescale delivered an 8% revenue increase from the larger base in 2017. However, the divestment of the Standard Products business ended up the overall revenues with a decrease by 3%.
Figure 7: NXP’s 2011-2017 HPMS Revenues
Source: NXP’s Official Website for Investor Relations, NXP Historic Financial Model.
NXP’s HPMS has been driving the company’s growth momentum for years.
Except for the secure identification solutions business line, all the other three business lines exhibit sturdy expansions as shown in Figure 7. In 2017, the automotive business
The secure interface & infrastructure business line grew by 3%.
3.3 The Broadcom-Qualcomm Takeover Attempt
On November 6, 2017, Broadcom Limited (NASDAQ: AVGO) unveiled a
proposal to acquire Qualcomm for $103 billion, which was made up of $60 per share in cash and $10 per share in Broadcom stocks. If debts were included, Qualcomm’s
enterprise value approximately reached to $130 billion. The proposal was quickly rejected by Qualcomm because of its belief in that the enterprise value was underestimated. To resolve the impasse, on December 4, 2017, Broadcom and its
supporting private equity firm, Silver Lake Partners, nominated 11 candidates to replace Qualcomm’s board of directors and pursued Qualcomm shareholders’ votes at Qualcomm’s 2018 Annual Meeting of Stockholders. On February 5, 2018, Broadcom made a $121 billion “best and final” offer to Qualcomm. This updated offer was
composed by $60 per share in cash and $22 per share in Broadcom stocks. The second offer was again dismissed by Qualcomm. On February 13, 2018, Broadcom conceded and proposed to reduce its slate of board nominees from 11 members to 6. On February 20, 2018, Qualcomm announced an amended agreement to increase the acquisition price for particular NXP stockholders. This decision disappointed Broadcom, and the
acquirer responded with an offer reduced to $57 per share in cash and $22 per share in
stocks. On February 27, 2018, Qualcomm changed its attitude and stated it would drop the objection if Broadcom’s offer was above $90 per share. On March 4, 2018, two days before the scheduled Qualcomm’s 2018 Annual Meeting of Stockholders, the
Committee on Foreign Investment in the United States (CFIUS) responded to Qualcomm’s secret and unilateral notice filed on January 29, 2018, which sought review of Broadcom’s attempt. The CFIUS stated it has identified potential national
security concerns and ordered Qualcomm to delay the meeting for at least 30 days.
Broadcom tried to re-domicile back to the United States to address the concerns. On
March 9, 2018, Qualcomm abruptly announced Paul E. Jacobs, the son of one Qualcomm’s founder Irwin M. Jacobs, will no longer serve as Executive Chairman of Qualcomm’s board of directors and will no longer serve in an executive management
capacity. The board also eliminated the role of Executive Chairman established since 2014 and believed an independent Chairman is more suitable for Qualcomm’s current situations. However, on March 12, 2018, President Trump signed an executive order to halt the proposed merger on the basis that the deal would threaten national security of the United States. Two days later, Broadcom announced it has terminated the offer to acquire Qualcomm and withdrawn its slate of independent director nominees for the election of Qualcomm’s board.
Broadcom Limited
Broadcom Limited is the successor to Avago Technologies Limited after the $37
billion merger between Avago and Broadcom Corporation, which was completed on February 1, 2016. Avago’s history can be traced back to the semiconductor division of
Hewlett Packard founded in 1961. In 1999, Hewlett Packard spun off all businesses not related to computers, storage, and imaging and these businesses became Agilent Technologies. In 2005, private equity firms Kohlberg Kravis Robert & Co. (KKR) and Silver Lake Partners acquired the semiconductor business of Agilent Technologies for
$2.6 billion and named the new company as Avago Technologies. The company went public in 2009 and didn’t stop its acquiring progress. In 2014, Avago acquired LSI
Corporation whose history could be dated back to LSI Logic and AT&T Bell Laboratories. After the acquisition of Broadcom Corporation, Avago changed its name to Broadcom Limited. In 2017, Broadcom Limited again acquired Brocade
Communications Systems. Therefore, the company has been gradually formed by a series of acquisitions. It’s a lineage of several U.S.-based companies.
Inheriting technologies from its diverse origins, Broadcom Limited delivers discrete devices, IC chipsets, and firmware for various applications such as communications, storage, automation, display & lighting, capacitive sensors, etc. It is a leading company in the networking infrastructure market and provides solutions for