Association between Long-term Exposure to PM
2.5and Incidence of Type 2 Diabetes in Taiwan
Chia-Ying Li, National Cheng Kung University, Tainan, Taiwan Huey-Jen Su, National Cheng Kung University, Tainan, Taiwan Chih-Da Wu, National Chiayi University, Chiayi, Taiwan Wen-Chi Pan, National Yang-Ming University, Taipei, Taiwan Yi-Chen Chen, National Cheng Kung University, Tainan, Taiwan;
Introduction
With the advance of science and technology, people nowadays has greatly enjoyed the convenience life. Meanwhile, humanity also faces a multitude of critical environmental, socio-cultural, and medical issues such as severe air pollution, inequality, and disease prevention (Brunekreef and Holgate 2002a;
WHO 2015a). In the report published by World Health Organization (WHO), Noncommunicable Diseases Country Profiles 2011, 63% of all deaths worldwide currently stem from noncommunicable diseases (NCDs) including cardiovascular diseases, cancers, chronic respiratory diseases and diabetes (Alwan et al. 2011). Beyond the scope of communicable diseases, chronic diseases are becoming an alarming medical issue recently. Asia is the major area of a rapidly emerging diabetes epidemic (Ramachandran et al. 2014; Wild et al. 2004). The diabetes epidemic is in large part attributable to genetic factors and established causes related to modern lifestyle including diet, obesity, and physical activity (Guariguata et al. 2014; van et al. 2010; Willett 2002). Recently, increasing research suggests that environmental exposures such as air pollution may also contribute to the development of type 2 diabetes (Thiering and Heinrich 2015).
The adverse effects of air pollution on human health have been established in a series of epidemiologic and observational studies (Brunekreef and Holgate 2002b; Dockery et al. 1993).
Specifically, particulate matter is associated with cardiovascular, cancer and respiratory disease.
Several animal experiments and epidemiological studies suggested that long-term exposure to particulate matter with aerodynamic diameter ⩽2.5μm (PM2.5) contributed to the development of type
2 diabetes (Hajat et al. 2015; Liu et al. 2013; Pearson et al. 2010). However, although positive associations were reported (Park and Wang 2014; Pearson et al. 2010), the results were not always significant because of different population characteristics and methods of exposure assessment (Coogan et al. 2012; Puett et al. 2011). Some studies suggested the mechanisms by which particulate matter may lead to diabetes. After PM2.5 exposure, several animal experiments and human body reactions displayed of endothelial dysfunction, inflammation of visceral adipose tissue, metabolic abnormalities and so on (Laing et al. 2010; Rajagopalan and Brook 2012; Schneider et al. 2008). These adverse reactions showed the associations of PM2.5 with systemic inflammatory responses such as increased inflammation markers, C-reactive protein (CRP) and Interleukin-6 (IL-6), and cardiac autonomic dysfunction, which might lead to insulin resistance (Balti et al. 2014).
Populations of Asia exposed to high levels of ambient air pollution such asparticulate matter. The analyses in the World Health Organization (WHO) Global Burden of Disease Comparative Risk Assessment is based estimate that ambient air pollution, in terms of fine particulate air pollution (PM2.5), caused about 0.8 million (1.2%) premature deaths and 6.4 million (0.5%) years of life lost ( YLL). This burden occurs predominantly in developing countries and 65% in Asia alone. On the other hand, a sharp increase in the incidence and prevalence of type 2 diabetes has been observed in the Asia region (Ramachandran et al. 2010; Ramachandran et al. 2014). Furthermore, empirical research evidence relating PM2.5 and diabetes still lack in Asian countries. For the reasons above mentioned, it is important to clarify the issue of PM2.5 exposure and type 2 diabetes.
On the other side, air quality, for example PM2.5, depends on a number of regional environmental variables such as greenness surrounding the residential addresses. It may have effects on also PM2.5
concentration and incidence of type 2 diabetes. Crucially, though, there is no research examine the effects of exposures to PM2.5 on type 2 diabetes with adjustment of these potential environmental factors. This study is to investigate the impacts of PM2.5 on type 2 diabetes, utilizing retrospective cohort design and also consider individual, socioeconomic and greenness to understand clearly about the effect of PM2.5 exposure. These findings may add to the growing evidence whether PM2.5 is a
potential risk factor for type 2 diabetes.
Materials and methods
Study population Database
Since March 1, 1995, Taiwan has launched a single-payer National Health Insurance program. Up to 99.9% of total Taiwan’s population of 23.74 million were enrolled in the program ending the year 2014 (NHI 2014). The National Health Insurance Research Database (NHIRD) collects data from the National Health Insurance program, including comprehensive information on demographic characteristics, inpatient and ambulatory care, diagnostic codes, medical expenditure, catastrophic illness patients, drug prescriptions, medical services, medical facilities, hospital level (NHI 2014). In order to control the quality of medical services and coding for NHIRD, the National Health Insurance Bureau (NHIB) has established a uniform system (NHI 2014). For research purposes, the Taiwan NHIRD releases sets of sampling files, called the Longitudinal Health Insurance Database (LHID).
LHID 2000 contains the entire original claims data for 1,000,000 beneficiaries randomly sampled from the entire population of NHIRD beneficiaries in the year 2000. The source population was the entire Taiwan insured population covered by NHIRD (23,753,407 individuals) in the year 2000. The LHID 2000 and the original NHI database are not significantly different in terms of gender, age distribution or mean insured payroll-related amount between the patients. Before releasing the data for research use, the NHRI scrambled the identification data to protect the privacy of its beneficiaries and confidentiality assurances were addressed by observing the data regulations of the NHIB (NHIRD, 2016).
Definition of study population and type 2 diabetes
In this study, we used Longitudinal Health Insurance Database 2000 (LHID 2000) as the primary source of population data. We conducted a retrospective cohort study using LHID 2000 from 1st
January, 2001 through 31st December, 2012. Health information of participants was retrieved from the LHID 2000 of the National Health Insurance Research Database (NHIRD), provided by the Taiwan National Health Research Institute (NHRI). The eligible criteria included (a) age at least 20 years at 2001 and (b) the absence of diabetes before the year 2001. All other information about study population also collected from LHID 2000.
As described before, we recruited LHID 2000 participants from 350 townships in Main Taiwan Island between 2001 and 2012. Starting with the study population collection, to make sure we collect the new cases of most type 2 diabetes rather than type 1 diabetes and focus on adult population in Taiwan as mentioned. Thus, the study excluded people whose age under 20 at the beginning year 2001 (n=248,646) and adopted “three years” as a wash out period from 1997 to 2000, people who diagnosed as diabetes before 2001 (n=22,833) were excluded from the further analysis. A total of 58 participants were excluded because of missing gender information. Because our study area is Main Taiwan Island, we further excluded participants who went to the hospital located on the Penghu, Kinmen and Matsu Islets (n=4,095). There were 505,151 participants remaining for the main analysis.
Type 2 diabetes cases were identified based on the International Classification of Disease, Ninth revision (ICD-9). ICD is the standard diagnostic tool for epidemiology, health management and clinical purpose. ICD is used to classify disease and other health problems recorded on many types of health and vital records, including death certificates and health records (WHO, 2016). Incidence of type 2 diabetes was defined as participants who were diagnosed as diabetes (ICD-9 code: 250) more than 3 times in a year and concurrent use of antihyperglycemic medications between 2001 and 2012.
To define new cases in the study period, people who was defined as diabetic patient with medical claim data from 1997 to 2000 were excluded from the beginning.
Assessment of exposure to air pollution
Hourly ambient PM2.5 exposure data from the Taiwan Air Quality Monitoring Network (Taiwan AQMN) from January, 1, 2006 to December, 1, 2012 were estimated to assess average long-term
exposure to PM2.5. The study used automatic monitoring data, which was available from 71 stationary sites located around the Main Taiwan Island. There are four principles for setting sampler: (a) the sampler should not influence directly by pollutions of flue and exhausting port; (b) avoiding the obstacles nearby the sampler to disturb airflow and pollutant concentration; (c) avoiding the surface of buildings and obstacles nearby sampler to disturb the pollutant concentration; (d) determine the height of the sampler base on the vertical distribution of pollutant concentration (Taiwan AQMN, 2015). To cover all counties in Main Taiwan Island, a 6-year (2006-2012) exposure to PM2.5 was estimated using Ordinary Kriging and zonal statistics through ArcGIS (version 10.2; Environmental Systems Research Institute Inc., Redlands, CA) to approximate participants’ long-term exposure to particle pollutants.
Estimates of mean ambient concentration of PM2.5 were available for the addresses of the hospital in the year 2001, the year when the study began. The spherical spatial models with weighted least-squared methods were utilized to estimate patients’ individual PM2.5 levels.
Potential confounding variables
We extracted information on different type of potential confounding variables, including individual- level variables, contextual variables, participants’ comorbidities and environmental variables.
Individual-level variables such as participants' age, sex (male, female), occupational type (8 types;
including official staff and teacher, soldier, goods-producing industries, agriculture, forestry, fishing,
& animal husbandry, services-producing industries, nonprofit organization, living support, and others) were obtained from Longitudinal Health Insurance Database 2000 (LHID 2000). County-level income (New Taiwan Dollar/year) and township urbanization level (level 1 to level 7 as high to law urbanization) were adjusted for contextual socioeconomic variables. We also extracted information on participants’ comorbidities (hypertension and hyperlipidemia) from LHID 2000. The global Moderate Resolution Imaging Spectroradiometer (MODIS) Normalized Difference Vegetation Index (NDVI), a component of National Aeronautics and Space Administration’s (NASA) Earth Observing System data, was used to be the exposure greenness level.
Statistical analysis
The study used Cox proportional hazards models to estimate the associations between PM2.5
exposure and type 2 diabetes incidence with adjusting for potential confounders, comorbidities and environmental variables. This model, proposed by Sir David Cox, is used to estimate the survival effect from the covariates, explanatory variables, and risk factors; especially, also can predict the survival opportunity in specific time (Cox 1972). The final model from a Cox regression analysis will provide an equation for the hazard as a function of several explanatory variables. A continuous variable of the seven-year average PM2.5 level (2006–2012) was applied throughout the analyses. Time at risk for type 2 diabetes was calculated the duration from the enrollment year to the year of type 2 diabetes diagnosis, the date of death, or the last date of follow-up from the LHID 2000, whichever came first. Follow-up period (years) was selected as the time variable in the cox analyses. All adjusted models were reported to estimate hazard ratios (HRs) and 95% confidence intervals (CIs) for every 10‑μg/m3 and per IQR increment of PM2.5.
λ(T=t|X=x)= λ0(t)exp(β1X1+ β2TX2+ β3X3+ β4TX4) (1)
Where, T is the time variable; X is the vector of co-variables including the X1, X2, X3, X4. X1 is the state of type 2 diabetes. X2 is the vector of demographic factors, including age and sex. X3 is the vector of socioeconomic variables, including insurance amount, occupation, county-level income and city urbanization level. X4 is the vector of metrological variables, including temperature and precipitation. β1 toβ4 are the coefficients for the parameters of X1 to X4, respectively. λ is the hazard function when the parameter of follow-up time (T) is t, and the variable vector of (X) is x. λ0 is the Baseline Hazards function when the parameter of follow-up time (T) is t, and all variable vector are 0.
Results
Descriptive data
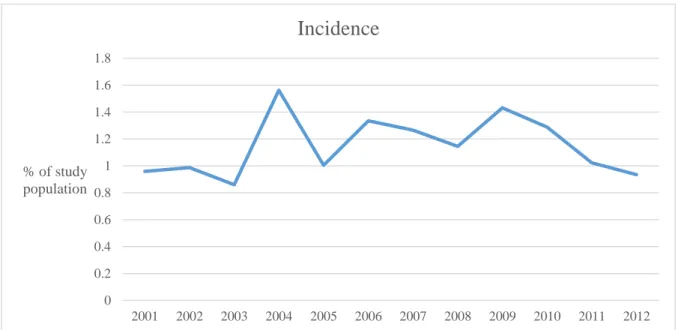
The study excluded subjects from LHID 2000 with diagnosed diabetes before 2001 and subjects who were less than 20 years old. Of the 505,151 eligible participants enrolled in the study, a total of 48,611 newly developed diabetes cases were identified during a median follow-up time of 12 years., and the 12-year average incidence was 1.14% (incidence for each year is showed in Figure 1). Using the median levels of PM2.5 (34 μg/m3) as cutoff values, participants who were exposed to higher PM2.5
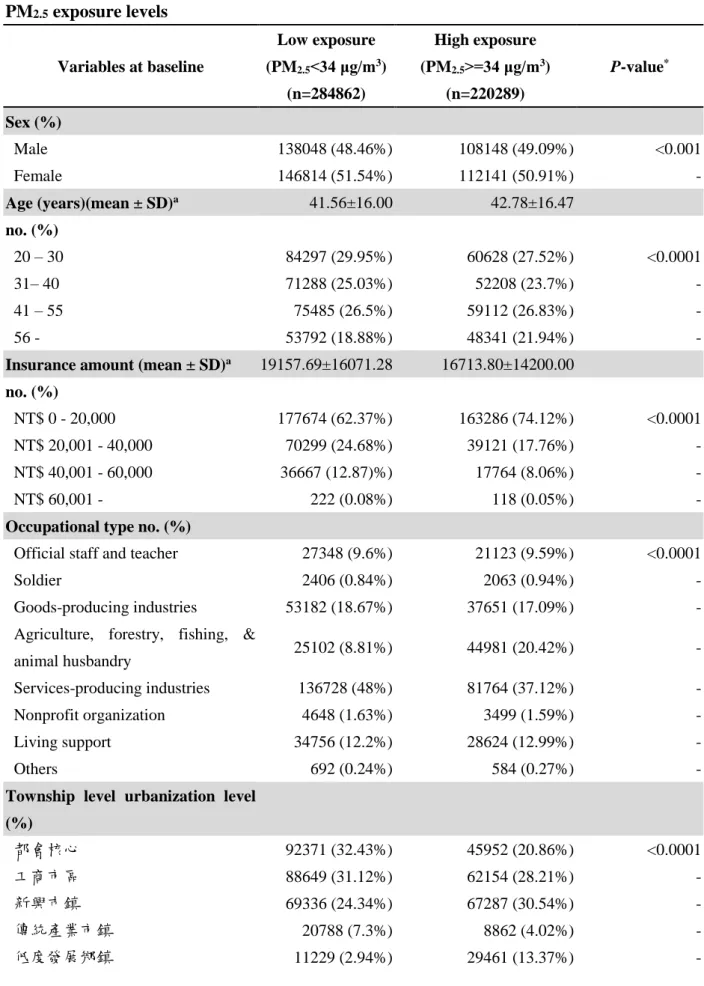
levels were older, and had lower insurance amount as well as township urbanization during study period. As for their type 2 diabetes status, the percent of type 2 diabetes in higher PM2.5 group is lower than that in lower group (0.46% < 0.53%). The reason potentially is the social-economic status since there are much more people paid lower insurance amount in the higher PM2.5 group. (Table 1).
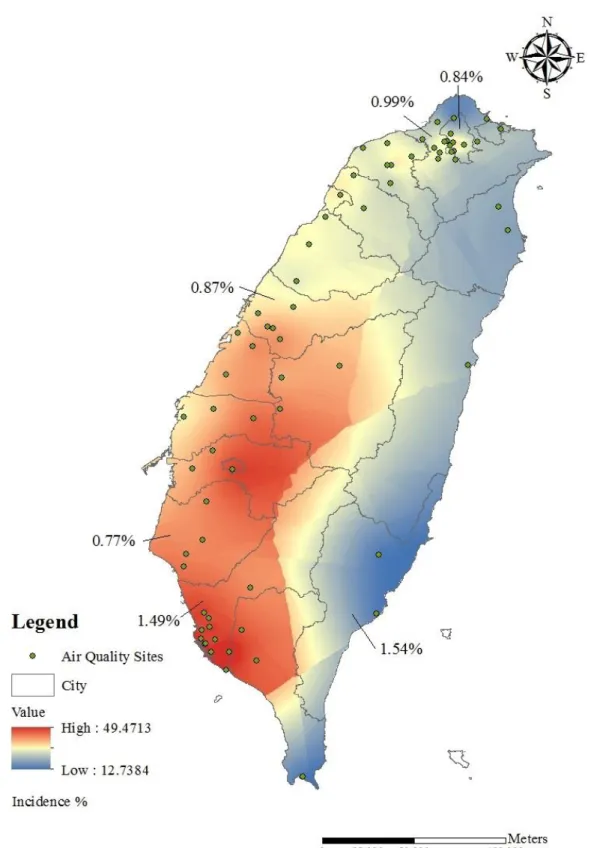
The averaged 7-year exposure to PM2.5 (2006-2012) was 32.6 μg/m3 (range, 13.3 to 47.2 μg/m3);
the 25th, 50th, and 75th percentiles were 27.0, 34.2, and 39.0 μg/m3. Figure 2 presents a map of PM2.5
level by county and also indicates the incidence of type 2 diabetes for special municipality in Taiwan, which are Taipei, New Taipei, Taichung, Tainan and Kaohsiung, as well as the eastern county Taitung.
Model Analysis and Sensitivity Test
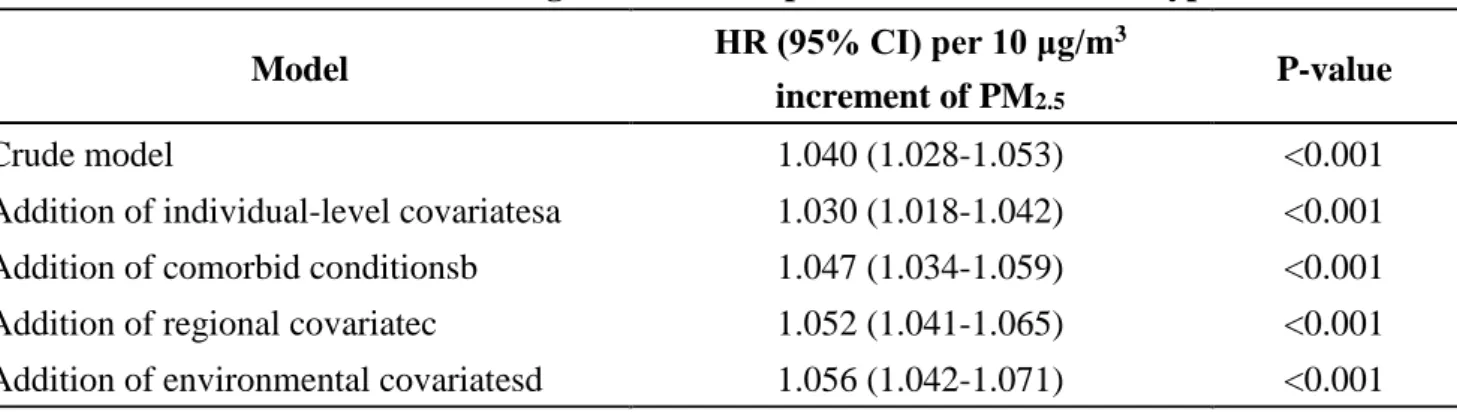
All crude the adjusted HRs for the association between PM2.5 exposure and incidence of type 2 diabetes were positive and were statistically significant. As shown in Table 2, for every 10 μg/m3 increase of PM2.5, the hazard ratio (HR) for incident diabetes was 1.057 (95% confidence interval [CI]
= 1.042 to 1.072) in model adjusted for individual-level covariates, comorbidity, regional social covariates and NDVI. The adjusted HR (95% CI) per IQR increment of PM2.5 was 1.069 (95%
CI=1.051 to 1.087). To verify the model whether it is certainly steady and reliable or not, the study performed a stratified Cox regression with the quartile of PM2.5 exposure for the sensitivity analysis.
The estimated effects with all quartiles level were nearly unchanged from the estimates for the every 10 μg/m3 or IQR increment except second quartile.
Stratified analysis
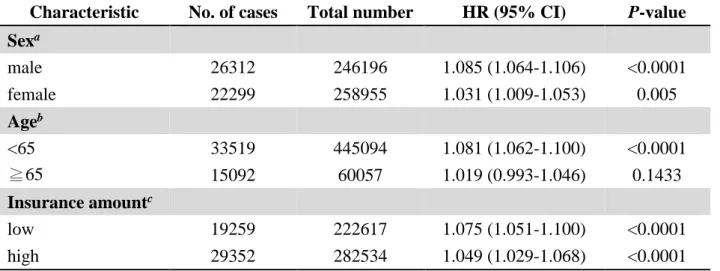
In further analyses, we did three stratified Cox regressions according to sex, age and insurance
amount (Table 3.). The adjusted hazard ratios (HRs) of developing type 2 diabetes were 1.085 (95%
CI=1.064 to 1.106) for men and 1.031 (95% CI=1.009 to 1.053) for women in the study population.
Compared with the people who were older than 65 years, the hazard ratio (HR) was higher in younger population. There was slight higher hazard ratio in lower insurance amount population.
Conclusion
This study focused on the association between PM2.5 exposure and type 2 diabetes. We demonstrated a significant association between PM2.5 exposure and type 2 diabetes incidence, expressing that ambient air pollution may contribute to the increased incidence of diabetes in the adult population in Taiwan. Furthermore, the study observed higher hazard ratios (HRs) between type 2 diabetes and PM2.5
among participants <65 years of age, and among men, and participants with lower insurance amount.
Figure 1. Type 2 diabetes incidence of each year during the study period
0 0.2 0.4 0.6 0.8 1 1.2 1.4 1.6 1.8
2001 2002 2003 2004 2005 2006 2007 2008 2009 2010 2011 2012
% of study population
Incidence
Figure 2. Distribution of average concentration of PM2.5 from 2006 to 2012. PM2.5
concentration was estimated using Ordinary Kriging by ArcGIS. Green points show the location of air quality sites based on the latitude and longitude (WGS 84).
Table 1. Baseline characteristics and number of newly type 2 diabetes cases according to PM2.5 exposure levels
Variables at baseline
Low exposure (PM2.5<34 μg/m3)
(n=284862)
High exposure (PM2.5>=34 μg/m3)
(n=220289)
P-value*
Sex (%)
Male 138048 (48.46%) 108148 (49.09%) <0.001
Female 146814 (51.54%) 112141 (50.91%) -
Age (years)(mean ± SD)a 41.56±16.00 42.78±16.47
no. (%)
20 – 30 84297 (29.95%) 60628 (27.52%) <0.0001
31– 40 71288 (25.03%) 52208 (23.7%) -
41 – 55 75485 (26.5%) 59112 (26.83%) -
56 - 53792 (18.88%) 48341 (21.94%) -
Insurance amount (mean ± SD)a 19157.69±16071.28 16713.80±14200.00 no. (%)
NT$ 0 - 20,000 177674 (62.37%) 163286 (74.12%) <0.0001
NT$ 20,001 - 40,000 70299 (24.68%) 39121 (17.76%) -
NT$ 40,001 - 60,000 36667 (12.87)%) 17764 (8.06%) -
NT$ 60,001 - 222 (0.08%) 118 (0.05%) -
Occupational type no. (%)
Official staff and teacher 27348 (9.6%) 21123 (9.59%) <0.0001
Soldier 2406 (0.84%) 2063 (0.94%) -
Goods-producing industries 53182 (18.67%) 37651 (17.09%) -
Agriculture, forestry, fishing, &
animal husbandry 25102 (8.81%) 44981 (20.42%) -
Services-producing industries 136728 (48%) 81764 (37.12%) -
Nonprofit organization 4648 (1.63%) 3499 (1.59%) -
Living support 34756 (12.2%) 28624 (12.99%) -
Others 692 (0.24%) 584 (0.27%) -
Township level urbanization level (%)
都會核心 92371 (32.43%) 45952 (20.86%) <0.0001
工商市區 88649 (31.12%) 62154 (28.21%) -
新興巿鎮 69336 (24.34%) 67287 (30.54%) -
傳統產業市鎮 20788 (7.3%) 8862 (4.02%) -
低度發展鄉鎮 11229 (2.94%) 29461 (13.37%) -
高齡化鄉鎮 1258 (0.44%) 5864 (2.66%) -
偏遠鄉鎮 1231 (0.43%) 709 (0.32%) -
County level income (mean ± SD) 77245.77±48801.26 57302.13±30266.84 <0.0001 Incident cases of type 2 diabetes 26088 (53.67%) 22523 (46.33%) <0.0001
*P-values were based on the students t-test for county level income, Fisher’s exact test for sex and type 2 diabetes status, or chi-squared test for age, insurance amount, occupational type, and urbanization level. All statistical tests were two-sided.
Table 2. Association between long-term PM2.5 exposure and incidence of type 2 diabetes
Model HR (95% CI) per 10 μg/m3
increment of PM2.5
P-value
Crude model 1.040 (1.028-1.053) <0.001
Addition of individual-level covariatesa 1.030 (1.018-1.042) <0.001 Addition of comorbid conditionsb 1.047 (1.034-1.059) <0.001 Addition of regional covariatec 1.052 (1.041-1.065) <0.001 Addition of environmental covariatesd 1.056 (1.042-1.071) <0.001
aAdjusted for age group, sex, level of insurance amount and occupational type.
bAlso adjusted for hypertension and hyperlipidemia.
cAlso adjusted for county level income and township level urbanization.
dAlso adjusted for NDVI.
Model HR (95% CI) per IQR increment of PM2.5§
P-value
Crude model 1.048 (1.033-1.064) <0.001
Addition of individual-level covariatesa 1.036 (1.021-1.051) <0.001 Addition of comorbid conditionsb 1.056 (1.041-1.071) <0.001 Addition of regional covariatec 1.063 (1.048-1.079) <0.001 Addition of environmental covariatesd 1.068 (1.050-1.086) <0.001
§The IQR were 12.03 μg/m3.
aAdjusted for age group, sex, level of insurance amount and occupational type.
bAlso adjusted for hypertension and hyperlipidemia.
cAlso adjusted for county level income and township level urbanization.
dAlso adjusted for NDVI.
Table 2. Sensitivity analysis for the associations of incident diabetes with quartile of PM2.5
Model Adjusted HR (95% CI)a P-value
Quartile of PM2.5
First 1
Second 0.898 (0.868-0.928) <0.0001
Third 1.040 (1.002-1.080) 0.0367
Forth 1.064 (1.031-1.099) 0.0001
aModel was adjusted for age group, sex, level of insurance amount, occupational type, hypertension, hyperlipidemia, county level income, and township urbanization.
Table 3. Stratified analysis for the hazard ratio of incident diabetes and per IQR increment of PM2.5
Characteristic No. of cases Total number HR (95% CI) P-value Sexa
male 26312 246196 1.085 (1.064-1.106) <0.0001
female 22299 258955 1.031 (1.009-1.053) 0.005
Ageb
<65 33519 445094 1.081 (1.062-1.100) <0.0001
≧65 15092 60057 1.019 (0.993-1.046) 0.1433
Insurance amountc
low 19259 222617 1.075 (1.051-1.100) <0.0001
high 29352 282534 1.049 (1.029-1.068) <0.0001
aModel was adjusted for age group, level of insurance amount, occupational type, hypertension, hyperlipidemia, county level income, and township urbanization.
bModel was adjusted for sex, level of insurance amount, occupational type, hypertension, hyperlipidemia, county level income, and township urbanization.
cModel used the median amount of the insurance (19200 NTD) as cutoff value and adjusted for age group, sex, occupational type, hypertension, hyperlipidemia, county level income, and township urbanization.
Reference
Alwan A, Armstrong T, Cowan M, Riley L. 2011. Noncommunicable diseases country profiles 2011.World Health Organization.
Balti EV, Echouffo-Tcheugui JB, Yako YY, Kengne AP. 2014. Air pollution and risk of type 2 diabetes mellitus:
A systematic review and meta-analysis. Diabetes research and clinical practice 106:161-172.
Brunekreef B, Holgate ST. 2002a. Air pollution and health. Lancet 360:1233-1242.
Brunekreef B, Holgate ST. 2002b. Air pollution and health. THE LANCET 360:1233-1242.
Coogan PF, White LF, Jerrett M, Brook RD, Su JG, Seto E, et al. 2012. Air pollution and incidence of hypertension and diabetes mellitus in black women living in los angeles. Circulation 125:767-772.
Dockery DW, Pope A, Xu X, Spengler JD, Ware JH, Fay ME, et al. 1993. An association between air pollution and mortality in six u.S. Cities. The New England Journal of Medicine 329.
Guariguata L, Whiting DR, Hambleton I, Beagley J, Linnenkamp U, Shaw JE. 2014. Global estimates of diabetes prevalence for 2013 and projections for 2035. Diabetes research and clinical practice 103:137-149.
Hajat A, Allison M, Diez-Roux AV, Jenny NS, Jorgensen NW, Szpiro AA, et al. 2015. Long-term exposure to air pollution and markers of inflammation, coagulation, and endothelial activation: A repeat-measures analysis in the multi-ethnic study of atherosclerosis (mesa). Epidemiology 26:310-320.
King H, Aubert RE, Herman WH. 1998. Global burden of diabetes, 1995–2025. Diabetes Care 21:1414-1431.
Laing S, Wang G, Briazova T, Zhang C, Wang A, Zheng Z, et al. 2010. Airborne particulate matter selectively activates endoplasmic reticulum stress response in the lung and liver tissues. Am J Physiol Cell Physiol 299:C736-C749.
Liu C, Ying Z, Harkema J, Sun Q, Rajagopalan S. 2013. Epidemiological and experimental links between air pollution and type 2 diabetes. Toxicologic pathology 41:361-373.
Mathers CD, Loncar D. 2002. Projections of global mortality and burden of disease from 2002 to 2030. PLoS Medicine 3:2011-2030.
NHI. 2014. National health insurance annual report 2014-2015. Taiwan, R.O.C. :National Health Insurance Administration, Ministry of Health and Welfare.
Park SK, Wang W. 2014. Ambient air pollution and type 2 diabetes: A systematic review of epidemiologic research. Current environmental health reports 1:275-286.
Pearson JF, Bachireddy C, Shyamprasad S, Goldfine AB, Brownstein JS. 2010. Association between fine particulate matter and diabetes prevalence in the u.S. Diabetes Care 33:2196-2201.
Puett RC, Hart JE, Schwartz J, Hu FB, Liese AD, Laden F. 2011. Are particulate matter exposures associated with risk of type 2 diabetes? Environmental health perspectives 119:384-389.
Rajagopalan S, Brook RD. 2012. Air pollution and type 2 diabetes: Mechanistic insights. Diabetes 61:3037- 3045.
Ramachandran A, Ma RCW, Snehalatha C. 2010. Diabetes in asia. Lancet 375:408-418.
Ramachandran A, Snehalatha C, Ma RC. 2014. Diabetes in south-east asia: An update. Diabetes research and clinical practice 103:231-237.
Schneider A, Neas L, Herbst MC, Case M, Williams RW, Cascio W, et al. 2008. Endothelial dysfunction:
Associations with exposure to ambient fine particles in diabetic individuals. Environmental health perspectives 116:1666-1674.
Thiering E, Heinrich J. 2015. Epidemiology of air pollution and diabetes. Trends in endocrinology and metabolism: TEM 26:384-394.
van DS, Beulens JWJ, der SYTv, Grobbee DE, Nealb B. 2010. The global burden of diabetes and its complications: An emerging pandemic. European Journal of Preventive Cardiology 17.
WHO. 2015a. State of inequality: Reproductive, maternal, newborn and child health:World Health Organization.
WHO. 2015b. World health statistics.World Health Organization.
Wild S, Roglic G, Green A, Sicree R. 2004. Global prevalence of diabetes-estimates for the year 2000 and projections for 2030. DIABETES CARE 27:1047-1053.
Willett WC. 2002. Balancing life-style and genomics research for disease prevention. SCIENCE 296.