58
Chapter Four Results and Discussion
This chapter is composed of two major parts – the statistical analysis of results is
reported in section 4.1 and further discussions and findings of the present research is
addressed in section 4.2. Section 4.1 encompasses four subsections which are
dedicated to the presentation of results for the three research questions mentioned in
chapter one: section 4.1.1 for the effects of topic familiarity on the participants’
vocabulary gain and retention, section 4.1.2 for the relationship between learners’
reading proficiency and their target lexical development, section 4.1.3 for the
influence of subjects’ text comprehension on their learning of selected twenty target
words, and section 4.1.4 for the demonstration of the correlation among all the
variables shown from section 4.1.1 to 4.1.3. Section 4.2 is divided into four
corresponding subsections for more detailed analysis and elucidation of the collected
data.
4.1 Overall Results
The participants’ general reading proficiency, their text comprehension for each
test along with their performance on the lexical development of twenty selected target
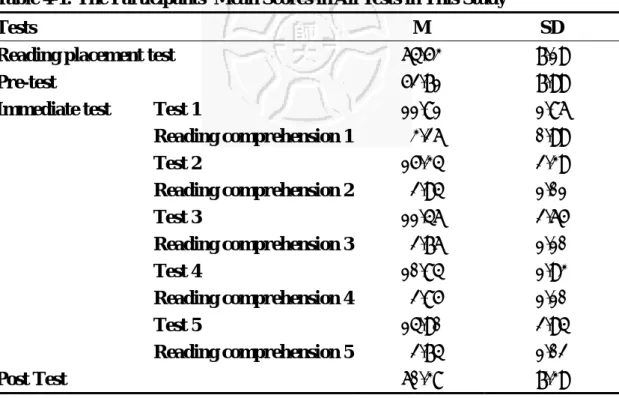
words in the pretest, immediate tests and the posttest are summarized in Table 4-1.
59
Table 4-1: The Participants’ Mean Scores in All Tests in This Study
Tests M SD
Reading placement test 64.53 7.19
Pre-test 52.71 7.99
Immediate test Test 1 11.81 1.86
Reading comprehension 1 3.26 0.99
Test 2 15.34 2.39
Reading comprehension 2 2.94 1.01
Test 3 11.46 2.65
Reading comprehension 3 2.76 1.10
Test 4 10.84 1.93
Reading comprehension 4 2.85 1.10
Test 5 14.90 2.94
Reading comprehension 5 2.74 1.02
Post Test 60.38 7.39
Note. N = 34.
Table 4-2 showed the participants’ mean scores in pretests and immediate tests in
this subject pool, their vocabulary gain was also calculated and presented here.
Table 4-2: The Participants’ Vocabulary Gain
Pretest Immediate test
M SD M SD VG t
TW1-4 10.13 2.61 11.81 1.86 1.68 4.50**
TW5-8 12.71 2.40 15.34 2.39 2.63 5.76**
TW9-12 8.69 2.03 11.46 2.65 2.76 5.82**
TW13-16 8.78 1.78 10.84 1.93 2.06 6.12**
TW17-20 12.40 2.79 14.90 2.94 2.50 5.80**
TW1-20 52.71 7.99 64.34 7.60 11.63 11.94**
Note. 1. N = 34. 2. TW means target word. 3. VG means vocabulary gain.
As shown in Table 4-2, the participants obtained higher scores in each immediate
test of the target words after reading each assigned passage than those in the pretest.
60
The differences between their performance of target word knowledge in these two
types of tests reached significance. Similar phenomenon was also observed when the
sum of the scores of the five immediate tests (mean = 64.34) was compared with that
of the pretest (mean = 52.71), t (33) = 11.94, p < .01. In conclusion, the students could
significantly learn target words in these five texts with the aid of such incidental
reading.
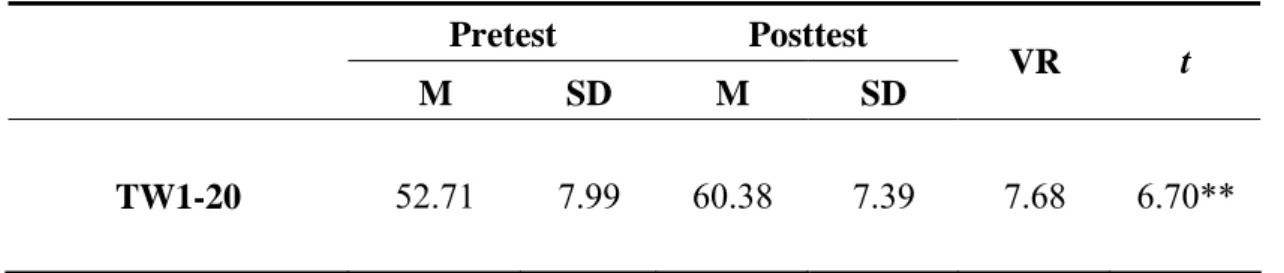
Table 4-3 presented the participants’ mean scores of those twenty selected lexical
items in pretests and posttests, their vocabulary retention was also included.
Table 4-3: The Participants’ Vocabulary Retention
Pretest Posttest
M SD M SD VR t
TW1-20 52.71 7.99 60.38 7.39 7.68 6.70**
Note. 1. N = 34. 2. TW1-20 means target words 1-20. 3. VR means vocabulary retention.
Table 4-3 revealed that the participants performed better in the posttest (mean =
60.38) than in the pretest (mean = 52.71). The differences between the scores in these
two tests also showed significance, t (33) = 6.70, p < .01. However, the score of
vocabulary retention (VR = 7.68) was weaker than that of vocabulary gain (VG =
11.63) due to the attrition in memory over time.
61
4.1.1 Vocabulary Gain and Retention among Texts of Different Topic Familiarity
The data would be analyzed statistically by means of the participants’ cultural
familiarity ratings and rankings for the five topics to explore whether less cultural
familiarity in planned reading would yield significantly better results in the
participants’ vocabulary gain and retention of selected twenty target words when they
were required to read assigned passages mainly for the purpose of global
comprehension and the gist. The use of cultural familiarity rankings for each topic
was explained in detail in section 3.3.2. Because the participants’ rankings for each
topic could not be processed by statistical analysis for distinguishing the discrepancy
in cultural familiarity among five texts, and such distinction made in this way would
involve some subjective observation and judgment, the cultural familiarity of each
assigned text in Table 4-4 was surveyed by Likert scale (see Appendix E) as a back-up
for the data analysis and decided by means of accumulating ratings from all the
participants’ questionnaires and calculating in terms of the mean score.
The following section would be discussed based on the participants’ cultural
familiarity rankings and ratings for each topic in the following ways. First, the
participants’ performance in incidental vocabulary learning in all the five tests would
be compared together according to their cultural familiarity ratings of each topic.
Then the effects of the participants’ perception of cultural familiarity on their lexical
62
development in each text were later investigated by first grouping the participants into
high ranking group (HRk) and low ranking group (LRk) and comparing these two
groups’ scores in vocabulary gain and retention. Next, the participants were divided
into high rating group (HRk) and low rating group (LRk), whose performance in
vocabulary learning were later also analyzed in the same way.
The Comparison of the Participants’ Vocabulary Gain and Retention among All Texts
After the statistical analysis of One –Way ANOVA, the results concerning the
comparison of five tests in terms of cultural familiarity, reading comprehension,
vocabulary gain and retention are presented in Table 4-4. Because the participants’
cultural familiarity rankings for each topic could not be calculated and compared
statistically, the cultural familiarity included in Table 4-4 was measured and obtained
through Likert Scale.
63
Table 4-4: The Participants’ Scores for Topic Familiarity, Reading Comprehension, Vocabulary Gain and Retention of Each Test
Test M SD F
1 2.91 0.87
2 2.97 0.83
3 2.85 0.82
4 3.03 0.83
Topic familiarity
5 3.41 1.10
2.05
1 3.26 0.99
2 2.94 1.01
3 2.76 1.10
4 2.85 1.10
Reading comprehension
5 2.74 1.02
1.40
1 1.68 2.17
2 2.63 2.67
3 2.76 2.77
4 2.06 1.96
Vocabulary gain
5 2.50 2.51
1.16
1 1.69 2.80
2 0.97 2.50
3 1.00 2.33
4 2.25 2.74
Vocabulary retention
5 1.76 2.45
1.54
Note. 1. N = 34. 2. Topic Familiarity of each topic is rated by Likert Scale.
Overall, no significance was observed among these five tests in these four aspects.
In other words, there was no significant difference in topic familiarity among these
five tests, F = 2.05, p > .05. Similar results were also revealed in readers’ performance
in reading comprehension, F = 1.40, p > .05, in their vocabulary gain, F = 1.16, p
> .05; and in the vocabulary retention, F = 1.54, p > .05.
The differences in the degree of topic familiarity among these five texts might be
64
weakened when all these five texts were taken into consideration in the procedure of
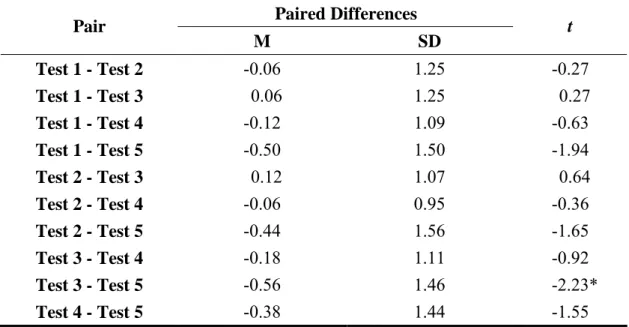
statistical analysis. Therefore, all the five texts were paired up and their cultural
familiarity ratings were compared by means of Paired-Samples T Test. The results
were illustrated in Table 4-5.
Table 4-5: The Comparison in Topic Familiarity among Different Tests by Pairs Sampled T- Test
Paired Differences Pair
M SD t
Test 1 - Test 2 -0.06 1.25 -0.27
Test 1 - Test 3 0.06 1.25 0.27
Test 1 - Test 4 -0.12 1.09 -0.63
Test 1 - Test 5 -0.50 1.50 -1.94
Test 2 - Test 3 0.12 1.07 0.64
Test 2 - Test 4 -0.06 0.95 -0.36
Test 2 - Test 5 -0.44 1.56 -1.65
Test 3 - Test 4 -0.18 1.11 -0.92
Test 3 - Test 5 -0.56 1.46 -2.23*
Test 4 - Test 5 -0.38 1.44 -1.55
Note. N = 34.
As presented in Table 4-5, the significant differences in the participants’ ratings
of topic familiarity were only shown between the reading passages in test 3 and test 5
(t = 2.23, p < .05). Therefore, with a view to seeking the answer to the first research
question, the further comparison of the participants’ mean scores in reading
comprehension, vocabulary gain and retention of test 3 and test 5 was made to
investigate what influence different cultural familiarity might have on these three
aspects. The results were presented in Table 4-6.
65
Table 4-6: The Comparison between Test 3 and Test 5 in Topic Familiarity, Reading Comprehension, Vocabulary Gain and Vocabulary Retention
Test3 Test5
M SD M SD t
TF 2.85 0.82 3.41 1.10 -2.23*
RC 2.76 1.10 2.74 1.02 0.12
VG 2.76 2.77 2.50 2.51 0.40
VR 1.00 2.33 1.76 2.45 -1.39
Note. 1. N = 34. 2. TF means Topic Familiarity, RC means Reading Comprehension, VG means Vocabulary Gain, VR means Vocabulary Retention.
As shown in Table 4-6, the participants’ performance in reading comprehension
(mean = 2.74) and vocabulary gain (mean = 2.50) in test 5 (the more familiar text)
were only slightly lower than those (reading comprehension = 2.76, vocabulary gain =
2.76) in test 3 (the less familiar text), but their mean scores in vocabulary retention
(mean = 1.76) in test 5 was higher than that in test 3 (mean = 1.00). Though some
differences were detected in terms of these three aspects, no significant difference was
found in their reading comprehension scores, t = 0.12, p < .05; vocabulary gain, t =
0.40, p < .05; and vocabulary retention, t = -1.39, p < .05. The participants did not
obtain significantly better scores in reading comprehension, vocabulary gain and
retention in less familiar one (test 3) than in more familiar text (test 5). In other words,
the distinct degree of topic familiarity of texts in test 3 and test 5 did not appear to
affect learners’ performance in passage comprehension, and lexical development of
target words.
66
Because there were no significant differences in incidental vocabulary learning
between texts of discrepant cultural familiarity ratings, I tried to examine whether the
participants who gave different rankings or ratings to the topic in each test would
behave differently in reading comprehension, vocabulary gain and retention to a
significant degree. The results were presented in the following two subsections.
Different Participants’ Rankings of Cultural Familiarity and Their Vocabulary Gain and Retention in Each Text
The participants were first divided into two groups, with the HRk group
comprised of those who gave a high ranking (4 and 5) to a topic while the LRk group
made up of those who gave a low ranking (1 and 2). Their mean scores in vocabulary
gain and retention in each text would be compared. However, this way of grouping
might lead to the solicitation of the uneven number of students in HRk and LRk
groups, which in turn might influence the results to some extent. Consequently, I
randomly chose nine participants from each group and ran the statistical analysis
again. This section would be discussed in these two ways.
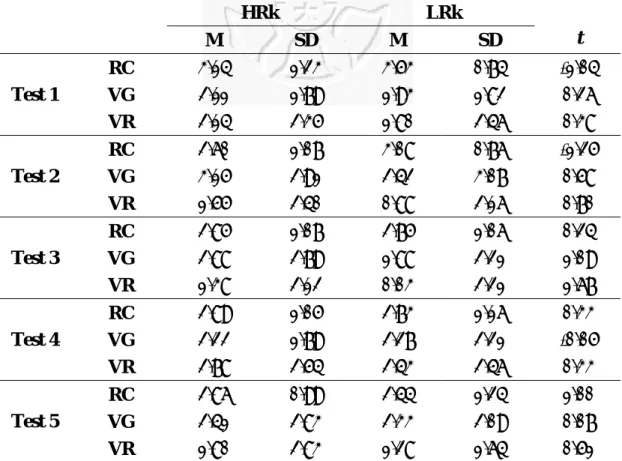
Scores in vocabulary gain and retention along with reading comprehension by
the different numbers of participants in HRk and LRk groups were first computed to
statistical analysis between these two groups and presented in Table 4-7.
67
Table 4-7: The Comparison in Reading Comprehension, Vocabulary Gain and Retention between High-Ranking and Low-Ranking Participants in Each Test HRk LRk
M SD M SD t
RC 3.14 1.23 3.53 0.74 -1.04
VG 2.11 1.79 1.93 1.82 0.26
Test 1
VR 2.14 2.35 1.80 2.46 0.38
RC 2.60 1.07 3.08 0.76 -1.25
VG 3.15 2.91 2.42 3.07 0.58
Test 2
VR 1.55 2.40 0.88 2.16 0.70
RC 2.85 1.07 2.75 1.06 0.24
VG 2.88 2.79 1.88 2.21 1.09
Test 3
VR 1.38 2.12 0.03 2.21 1.67
RC 2.89 1.05 2.73 1.16 0.33
VG 2.22 1.79 2.27 2.21 -0.05
Test 4
VR 2.78 2.54 2.43 2.46 0.33
RC 2.86 0.99 2.44 1.24 1.00
VG 2.41 2.83 2.33 2.09 0.07
Test 5
VR 1.80 2.83 1.28 1.64 0.51
Note. 1. HRk means participants who gave high ranking (4 and 5) to the text of the test, LRk means those who
gave low ranking (1 and 2) to the text of the test. 2. Test 1: HRk (N = 14 ), LRk (N = 15); Test 2: HRk (N = 10), LRk (N = 13); Test 3: HRk (N = 13), LRk (N = 16); Test 4: HRk (N = 9), LRk (N = 15); Test5 : HRk (N = 22), LRk (N = 9). 3. RC means Reading Comprehension, VG means Vocabulary Gain, VR means Vocabulary Retention.
Table 4-7 revealed that the participants who assigned a low ranking performed
consistently worse than those who gave a high ranking in vocabulary gain and
retention in most tests and obtained a higher mean score in vocabulary gain in test 4.
However, no significant differences were detected in terms of these two variables in
every test, which testified that the learners’ perception of topic familiarity for each test
did not significantly affect their understanding of assigned passages and vocabulary
68
learning of the target words.
For the purpose of ridding the results of the possible contamination caused by the
uneven number of students in HRk and LRk groups, nine participants in each group
were randomly chosen and their vocabulary learning was compared again. Table 4-8
showed the mean scores in reading comprehension, vocabulary gain and retention in
each test by nine participants in HRk group and the other nine in LRk group.
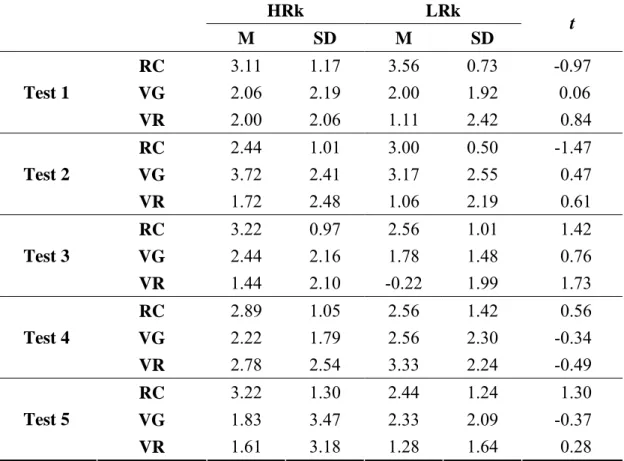
Table 4-8: The Comparison in Reading Comprehension, Vocabulary Gain and Retention by Nine Randomly Selected High-Ranking and Low-Ranking Participants in Each Test
HRk LRk
M SD M SD t
RC 3.11 1.17 3.56 0.73 -0.97
VG 2.06 2.19 2.00 1.92 0.06
Test 1
VR 2.00 2.06 1.11 2.42 0.84
RC 2.44 1.01 3.00 0.50 -1.47
VG 3.72 2.41 3.17 2.55 0.47
Test 2
VR 1.72 2.48 1.06 2.19 0.61
RC 3.22 0.97 2.56 1.01 1.42
VG 2.44 2.16 1.78 1.48 0.76
Test 3
VR 1.44 2.10 -0.22 1.99 1.73
RC 2.89 1.05 2.56 1.42 0.56
VG 2.22 1.79 2.56 2.30 -0.34
Test 4
VR 2.78 2.54 3.33 2.24 -0.49
RC 3.22 1.30 2.44 1.24 1.30
VG 1.83 3.47 2.33 2.09 -0.37
Test 5
VR 1.61 3.18 1.28 1.64 0.28
Note. 1. N = 9 for both HRk and LRk. 2. HRk means nine randomly chosen participants who gave high ranking (4 and 5) to the text of the test, LRk means those who gave low ranking (1 and 2) to the text of the test. 3. RC means Reading Comprehension, VG means Vocabulary Gain, VR means Vocabulary Retention.
69
As indicated in Table 4-8, the low-ranking group attained slightly better mean
scores than the high-ranking group only in vocabulary gain (mean = 2.56 > 2.22) and
retention (mean = 3.33 > 2.78) in test 4 and vocabulary gain (mean = 2.33 > 1.83) in
test 5, but it did worse in vocabulary gain and retention in most tests (test 1 to test 3)
and in vocabulary retention in test 5. Similarly, different ranking in topic familiarity
for each text did not significantly contribute to the difference in their text
comprehension and vocabulary acquisition.
Different Participants’ Ratings of Cultural Familiarity and Their Vocabulary Gain and Retention in Each Text
Apart from using ranking, Likert scale was also utilized to examine the
participants’ perception of cultural familiarity for each passage as they rated each text
and the resulting data were further submitted to statistical analysis. The participants
who gave a higher rating (4 and 5) to the text belonged to the HRt group. Those who
gave a lower rating (1 and 2) were categorized into the LRt group. Their mean scores
in vocabulary gain and retention in each text would be compared. However, the
numbers of the participants in HRt and LRt groups might be asymmetrical due to such
grouping, which might consequently affect the results to a certain degree. As a result,
nine participants from both HRt and LRt groups were randomly singled out and their
vocabulary learning would also be compared. This section would be discussed in
70
these two ways.
The comparison of mean scores in topic familiarity rating, reading
comprehension, vocabulary gain and retention by asymmetrical numbers of the
participants in the HRt and LRt groups in each test was included in Table 4-9.
71
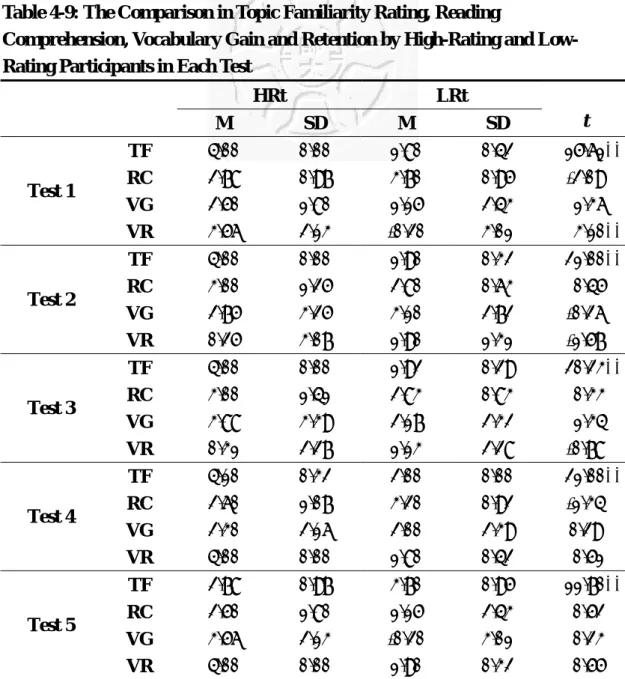
Table 4-9: The Comparison in Topic Familiarity Rating, Reading
Comprehension, Vocabulary Gain and Retention by High-Rating and Low- Rating Participants in Each Test
HRt LRt
M SD M SD t
TF 4.00 0.00 1.80 0.42 15.61**
RC 2.78 0.97 3.70 0.95 -2.09
VG 2.50 1.80 1.15 2.43 1.36
Test 1
VR 3.56 2.13 -0.20 3.01 3.10**
TF 4.00 0.00 1.90 0.32 21.00**
RC 3.00 1.25 2.80 0.63 0.45
VG 2.75 3.25 3.10 2.72 -0.26
Test 2
VR 0.25 3.07 1.90 1.31 -1.57
TF 4.00 0.00 1.92 0.29 20.23**
RC 3.00 1.41 2.83 0.83 0.33
VG 3.88 3.39 2.17 2.32 1.34
Test 3
VR 0.31 2.27 1.13 2.28 -0.78
TF 4.10 0.32 2.00 0.00 21.00**
RC 2.60 1.07 3.20 0.92 -1.34
VG 2.30 2.16 2.00 2.39 0.29
Test 4
VR 4.00 0.00 1.80 0.42 0.51
TF 2.78 0.97 3.70 0.95 11.70**
RC 2.50 1.80 1.15 2.43 0.52
VG 3.56 2.13 -0.20 3.01 0.23
Test 5
VR 4.00 0.00 1.90 0.32 0.55
Note. 1. HRt means participants who gave high rating (4 and 5) to the text of the test, LRt means those who gave
low rating (1 and 2) to the text of the test. 2. Test 1: HRt (N = 9), LRt (N = 10); Test 2: HRt (N = 10), LRt (N = 10);
Test 3: HRt (N = 8), LRt (N = 12); Test 4: HRt (N = 10), LRt (N = 10); Test5 : HRt (N = 17), LRt (N = 5). 3. TF means Topic Familiarity, RC means Reading Comprehension, VG means Vocabulary Gain, VR means Vocabulary Retention.
In general, Table 4-9 indicated that no significant difference were detected
between these two groups in their performance in reading comprehension, vocabulary
gain and retention; that is, the participants’ different ratings of topic familiarity for
72
each text did not significantly influence their scores in reading comprehension and
vocabulary learning of target lexical items. The low-rating group outperformed the
high-rating group in vocabulary gain (mean = 3.10 > 2.75) and retention (mean = 1.90
> 0.25) in test 2 and in vocabulary retention (mean = 1.13 > 0.31) in test 3, and
obtained lower mean scores in vocabulary gain and retention in test 4 and test 5, and
in vocabulary gain in test 1 and test 3, but all the disparity mentioned above was
proved non-significant. However, the only one exception was shown in the
vocabulary retention of test 1, where the HRt group got significantly better mean
score (M = 3.56) than its counterpart (M = -0.20), t = 3.10, p < .01.
To eliminate the possible contamination of the results caused by the solicitation
of the uneven numbers of the participants in HRt and LRt groups, the researcher
investigated whether the results would be different by randomly selecting a
symmetrical number of the participants for each group (N = 9 for HRt and LRt
groups). The performance between the HRt and LRt groups in aforementioned four
aspects were statistically analyzed and presented in Table 4-10.
73
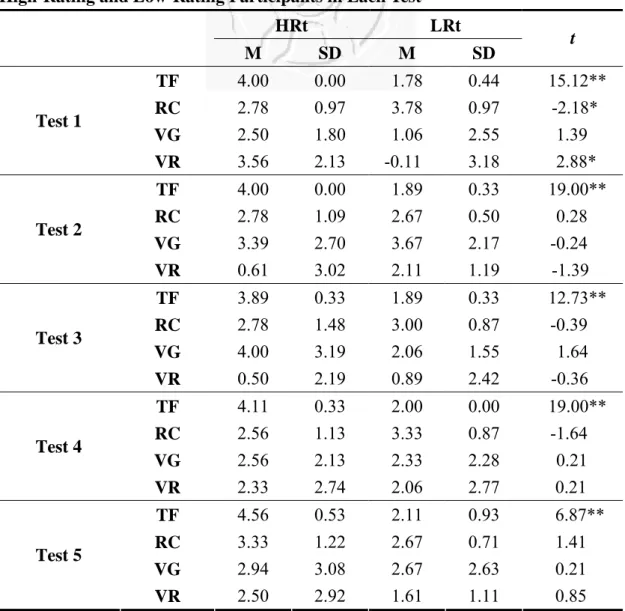
Table 4-10: The Comparison in Topic Familiarity Rating, Reading
Comprehension, Vocabulary Gain and Retention by Nine Randomly Selected High-Rating and Low-Rating Participants in Each Test
HRt LRt
M SD M SD t
TF 4.00 0.00 1.78 0.44 15.12**
RC 2.78 0.97 3.78 0.97 -2.18*
VG 2.50 1.80 1.06 2.55 1.39
Test 1
VR 3.56 2.13 -0.11 3.18 2.88*
TF 4.00 0.00 1.89 0.33 19.00**
RC 2.78 1.09 2.67 0.50 0.28
VG 3.39 2.70 3.67 2.17 -0.24
Test 2
VR 0.61 3.02 2.11 1.19 -1.39
TF 3.89 0.33 1.89 0.33 12.73**
RC 2.78 1.48 3.00 0.87 -0.39
VG 4.00 3.19 2.06 1.55 1.64
Test 3
VR 0.50 2.19 0.89 2.42 -0.36
TF 4.11 0.33 2.00 0.00 19.00**
RC 2.56 1.13 3.33 0.87 -1.64
VG 2.56 2.13 2.33 2.28 0.21
Test 4
VR 2.33 2.74 2.06 2.77 0.21
TF 4.56 0.53 2.11 0.93 6.87**
RC 3.33 1.22 2.67 0.71 1.41
VG 2.94 3.08 2.67 2.63 0.21
Test 5
VR 2.50 2.92 1.61 1.11 0.85
Note. 1. N = 9 for both HRt (high) and LRt (low) groups. 2. HRt means nine randomly selected participants who
gave high rating (4 and 5) to the text of the test, LRt means those who gave low rating (1 and 2) to the text of the test. 3.TF means Topic Familiarity, RC means Reading Comprehension, VG means Vocabulary Gain, VR means Vocabulary Retention.
Table 4-10 revealed that learners’ difference in topic familiarity ratings did not
bring about any significant effects on their text comprehension, vocabulary gain and
retention for there was in general no significant difference between the HRt and LRt
groups. The low-rating group did a better job than the high-rating group in vocabulary
74
gain (mean = 3.67 > 3.39) and retention (mean 2.11 = 0.61) in test 2 and in vocabulary
retention (mean = 0.89 > 0.50) in test 3, and obtained lower mean scores in
vocabulary gain and retention in test 4 and test 5, and in vocabulary gain in test 1 and
test 3, these differences were not proved statistically significant. Nevertheless,
statistical significance was observed in their performance in vocabulary retention (t <
2.88, p < .05) in test 1. In other words, these two groups behaved significantly
different in this aspect.
75
4.1.2 Vocabulary Gain and Retention of Participants at Different Reading Proficiency Levels
To explore whether learners with higher reading proficiency level could attain
better scores than their counterparts with lower reading proficiency level in
vocabulary learning of the twenty target words, the first and last 27% of the
participants were selected based on their scores in the reading placement test; and
their scores in vocabulary gain and retention were later computed for statistical
analysis. The H group was composed of top nine participants with better scores in the
reading placement test and the L group consisted of the other nine participants whose
performance in the same test was at the bottom of the whole subject pool. The mean
scores of both the H and L groups were reported in Table 4-11.
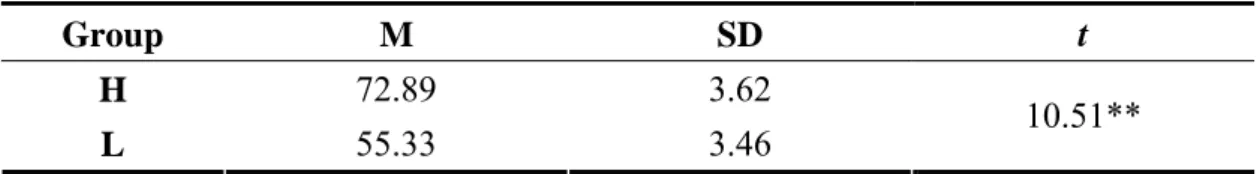
Table 4-11: Scores for the Reading Proficiency Test of High and Low Groups
Group M SD t
H 72.89 3.62
L 55.33 3.46 10.51**
Note. 1. N = 9 for both H (high) and L (low) groups. 2. H means the group of participants with higher reading proficiency level, and L means the group of participants with lower reading proficiency level.
According to Table 4-11, the mean score for the H group was 72.89 while that of
the L group was 55.33. The difference in this score reached significance (t = 10.51, p
<.01), which signified that these two groups were at significantly different reading
proficiency levels.
76
The statistical analysis of vocabulary gain and retention in the H and L groups
was summarized in Table 4-12.
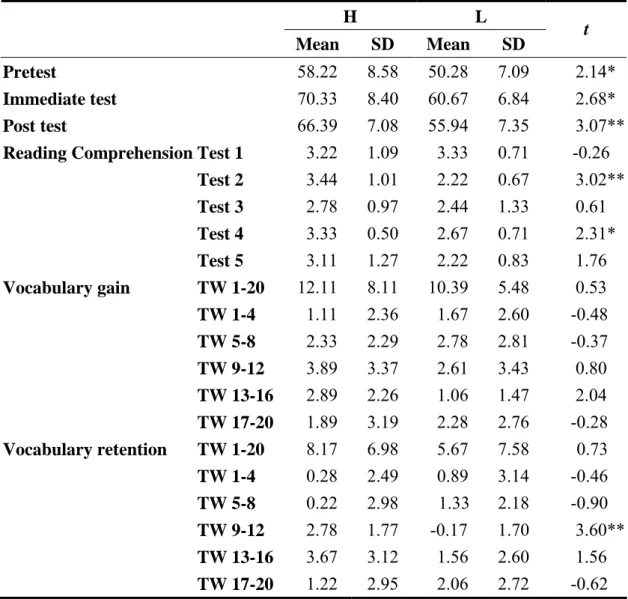
Table 4-12: Scores for Vocabulary Gain and Retention of High and Low Reading Proficiency Groups
H L
Mean SD Mean SD t Pretest 58.22 8.58 50.28 7.09 2.14*
Immediate test 70.33 8.40 60.67 6.84 2.68*
Post test 66.39 7.08 55.94 7.35 3.07**
Reading Comprehension Test 1 3.22 1.09 3.33 0.71 -0.26 Test 2 3.44 1.01 2.22 0.67 3.02**
Test 3 2.78 0.97 2.44 1.33 0.61 Test 4 3.33 0.50 2.67 0.71 2.31*
Test 5 3.11 1.27 2.22 0.83 1.76 Vocabulary gain TW 1-20 12.11 8.11 10.39 5.48 0.53
TW 1-4 1.11 2.36 1.67 2.60 -0.48
TW 5-8 2.33 2.29 2.78 2.81 -0.37
TW 9-12 3.89 3.37 2.61 3.43 0.80 TW 13-16 2.89 2.26 1.06 1.47 2.04 TW 17-20 1.89 3.19 2.28 2.76 -0.28 Vocabulary retention TW 1-20 8.17 6.98 5.67 7.58 0.73
TW 1-4 0.28 2.49 0.89 3.14 -0.46
TW 5-8 0.22 2.98 1.33 2.18 -0.90
TW 9-12 2.78 1.77 -0.17 1.70 3.60**
TW 13-16 3.67 3.12 1.56 2.60 1.56 TW 17-20 1.22 2.95 2.06 2.72 -0.62
Note. 1. N = 9 for both H (high) and L (low) groups. 2. TW stands for Target Word.
With regard to the comparison of these two groups’ scores in vocabulary gain of
twenty target words (see Table 4-12), the mean score was 12.11 for the H group, 10.39
for the L group. Although the H group achieve better vocabulary gain than the L
77
group, no significance was reported, t = 0.53, p < .05. When closely examined in
greater detail in each test, high reading proficiency group attained higher scores in
vocabulary gain than the low reading proficiency group in test 3 (TW9-12 = 3.89 >
2.61), and in test 4 (TW13-16 = 2.89 > 1.06), but the former performed less well than
the latter in test 1(TW1-4 = 1.11 < 1.67), test 2(TW5-8 =2.33 < 2.78) and test
5(TW17-20 = 1.89 < 2.28). However, their disparity in each test did not reveal any
statistical significance. As for their performance in vocabulary retention, the H group
obtained a better mean score (mean = 8.17) than the L group (mean = 5.67). However,
no significance was revealed, t = 0.73, p < .05. When the researcher further compared
the vocabulary retention of the H and L groups in each test, the H group obtained a
significantly higher mean score in test 3 than the L group (TW9-12 = 2.78 > -0.17, t =
3.60**). Except for this comparison in test 3, the difference between these two groups
did not reach significance in other tests. The H group achieved a better result than the
L group in test 4 (TW13-16 = 3.67 > 1.56), lower mean scores in test 1 (TW1-4 =
0.28 < 0.89), test 2 (TW5-8 = 0.22 < 1.33) and test 5 (TW17-20 = 1.22 < 2.72), but
only to a non-significant degree. In general, the H group outperformed the L group in
vocabulary gain and retention of target words 9-12, and target words 13-16, but its
performance was inferior in lexical development of target words 1-4, target words 5-8,
and target words 17-20. Though the H group did not consistently have higher scores
78
in vocabulary gain and retention, it did a better job in terms of the overall score for the
whole twenty target lexical items.
4.1.3 Vocabulary Gain and Retention and Participants’ Reading Comprehension
As mentioned in section 4.1.1 and shown in Table 4-4, there was no significant
difference in the participants’ scores in reading comprehension among these five tests.
In order to explore the relationship between one’s text comprehension and vocabulary
learning, the researcher selected in each test learners who performed well (with a
score from 4 to 5 in the reading comprehension test) and those who did it less well
(with a score from 1 to 2) and compared their performance in their lexical
development of four target words. Table 4-13 is a summary of their mean scores in
vocabulary gain and retention among these five tests.
79
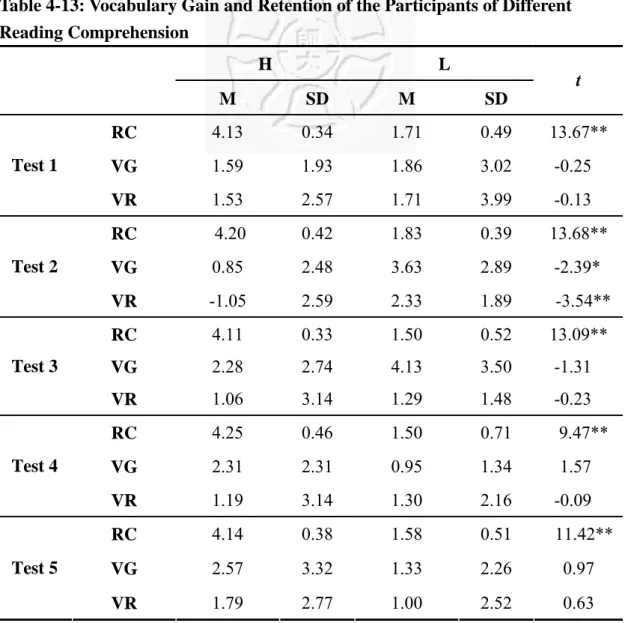
Table 4-13: Vocabulary Gain and Retention of the Participants of Different Reading Comprehension
H L M SD M SD
t
RC 4.13 0.34 1.71 0.49 13.67**
VG 1.59 1.93 1.86 3.02 -0.25
Test 1
VR 1.53 2.57 1.71 3.99 -0.13
RC 4.20 0.42 1.83 0.39 13.68**
VG 0.85 2.48 3.63 2.89 -2.39*
Test 2
VR -1.05 2.59 2.33 1.89 -3.54**
RC 4.11 0.33 1.50 0.52 13.09**
VG 2.28 2.74 4.13 3.50 -1.31
Test 3
VR 1.06 3.14 1.29 1.48 -0.23
RC 4.25 0.46 1.50 0.71 9.47**
VG 2.31 2.31 0.95 1.34 1.57
Test 4
VR 1.19 3.14 1.30 2.16 -0.09
RC 4.14 0.38 1.58 0.51 11.42**
VG 2.57 3.32 1.33 2.26 0.97
Test 5
VR 1.79 2.77 1.00 2.52 0.63
Note. 1. H represents the group of participants who get a higher score (4 and 5) in reading comprehension, L means
those who get a lower score (1 and 2). 2. Test 1: H (N = 16), L (N = 7); Test 2: H (N = 10), L (N = 12); Test 3: H (N = 9), L (N = 12); Test 4: H (N = 8), L (N = 10); Test 5: H (N = 7), L (N = 12). 3. RC = Reading Comprehension, VG = Vocabulary Gain, VR = Vocabulary Retention.
Based on Table 4-13, the participants who obtained higher score in reading
comprehension in each test did not necessarily achieve a significant better result in
vocabulary gain and retention. Readers with better reading comprehension did slightly
better than their counterparts in vocabulary gain and retention only in test 5, and in
vocabulary gain in test 4. However, in most cases, readers with better scores in
80
reading comprehension performed worse than those with lower scores in both
vocabulary gain and retention in test 1, test 2 and test 3; and in vocabulary retention in
test 4. While less proficient readers did consistently better than better readers in
vocabulary gain and retention in most tests (test 1, test 2, and test 3) or worse in test 5,
such consistence was not observed in test 4, in which the H group got a higher score
(mean = 2.31) than the L group (mean = 0.95) in vocabulary gain, but a lower score
(mean = 1.19) than the L group (mean = 1.30) in vocabulary retention. Broadly
speaking, all participants showed positive improvement in their knowledge of target
lexical items as reflected in both vocabulary gain and vocabulary retention.
Nevertheless, the H group manifests a regression in the score of vocabulary retention
(mean = -1.05 ) in test 2. To sum up, the differences between these two groups of
readers in vocabulary learning did not manifested statistical significance in most tests
except those in test 2, in which learners with lower scores in reading comprehension
did significantly better than better readers in vocabulary learning.
To rid the results of the possible influence caused by the uneven number of the
participants and further probe into this issue, the researcher selected the first and last
27% of the participants based on their scores in reading comprehension in each test,
categorized them into H and L groups, with each composed of nine students, and
analyzed their data by means of Independent-Samples T- Test. The lexical
81
development between the H and L groups in the present study was illustrated in Table
4-14.
Table 4-14: Vocabulary Gain and Retention of Nine Randomly Selected Participants for the High and Low Reading Comprehension Groups
H L
M SD M SD t
RC 4.22 0.44 2.00 0.71 8.00**
VG 2.94 1.01 0.94 3.21 1.78
Test 1
VR 2.22 2.39 1.11 3.79 0.74
RC 4.22 0.44 1.78 0.44 11.76**
VG 0.94 2.62 2.67 2.70 -1.37
Test 2
VR -0.72 2.51 2.00 2.02 -2.53*
RC 4.11 0.33 1.33 0.50 13.87**
VG 2.28 2.74 3.28 3.65 -0.66
Test 3
VR 1.06 3.14 1.06 1.01 0.00
RC 4.11 0.60 1.44 0.73 8.49**
VG 2.61 2.34 0.72 1.20 2.15*
Test 4
VR 1.94 3.71 1.11 2.20 0.58
RC 3.89 0.60 1.44 0.53 9.17**
VG 3.28 3.22 0.94 2.51 1.72
Test 5
VR 2.72 3.07 0.89 2.89 1.30
Note. 1. N = 9 for both H (high) and L (low) groups. 2. H represents the group of nine randomly selected
participants who get a higher score (4 and 5) in reading comprehension, L means the other nine participants who get a lower score (1 and 2). 3. RC = Reading Comprehension, VG = Vocabulary Gain, VR = Vocabulary Retention.
Table 4-14 revealed that readers with better text comprehension obtained slightly
higher mean scores than less proficient readers in vocabulary gain and retention in test
1 and test5, vocabulary retention in test 4, and the former group performed even
significantly better than the latter group in vocabulary gain in test 4. On the other
82
hand, better readers did less well than their counterparts in vocabulary gain and
retention in test 2 and vocabulary gain in test 3, but not to a significant degree. When
closely examined, the scores of vocabulary gain and retention in test 3, to my surprise,
did not yield consistent results. The H group attained a lower score (mean = 2.28) than
the L group (mean = 3.28) in vocabulary gain, while there was no difference in
vocabulary retention in test 3 between these two groups (mean = 1.06). Unlike the
phenomenon shown in test 3, the t scores in vocabulary gain and retention in other
tests would tend to be either both positive or both negative. Generally speaking,
readers with better text comprehension did not appear to perform significantly better
or worse in lexical development of target words in most tests here than less proficient
readers did.
4.1.4 Pearson Correlations Analysis on Reading Proficiency, Reading Comprehension, Vocabulary Gain and Vocabulary Retention
To investigate what relationship might exist among the variables in the present
study, the researcher computed the correlations among the participants’ reading
proficiency, reading comprehension, vocabulary gain and vocabulary retention by
Pearson Correlation Analysis, and presented the results in Table 4-15.
83
Table 4-15: Correlations among Reading Proficiency, Reading Comprehension, Vocabulary Gain and Vocabulary Retention
RP RC VG VR
RP ― 0.39* 0.00 0.13
RC ― 0.04 -0.19
VG ― 0.57**
VR ―
Note. 1. N = 34. 2. RP represents Reading Proficiency; RC stands for Reading Comprehension; VG signifies Vocabulary Gain; and VR means Vocabulary Retention.
In Table 4-15, only two pairs of variables displayed significant correlation. The
first pair was between the participants’ reading proficiency and reading
comprehension, which showed a correlation (r = .39). This correlation denoted that
learners’ higher reading proficiency was accompanied by their better performance in
the reading comprehension section of each test. The other pair consisted of vocabulary
gain and vocabulary retention, which manifested a correlation (r = .57) and it meant
that as learners’ scores in vocabulary gain increased, so did their scores in vocabulary
retention. As for other pairs, the correlation between reading proficiency and
vocabulary retention was only .13; the one between reading comprehension and
vocabulary gain hit a lower level of .04; the correlation between reading proficiency
and vocabulary gain did not even appear to exist (r = .00). Unlike those pairs of
variables mentioned above, the correlation between reading comprehension and
vocabulary retention turned out to be negative (r = -0.19). No matter what their
correlations were, none of the four mentioned above showed any significance. This
84
further confirmed the insignificant discrepancy found in the vocabulary learning of
the participants at different proficiency level, with distinct reading comprehension,
and different rankings and ratings toward the topics.
With a view to examining the correlation among these variables in greater detail,
the researcher conducted the statistical analyses in each test and the results were
summarized in Table 4-16.
Table 4-16: Significant Correlations among Reading Proficiency, Topic Familiarity, Reading Comprehension, Vocabulary Gain and Vocabulary Retention in Each Test
RP TF RC VG VR
RP ― T2(r = 0.40*)
T5(r = 0.37*)
T4(r = 0.48**) T3(r = 0.40*) T4(r = 0.41*)
TF ― T1(r = -0.40**) T1(r = 0.46**)
RC ― T2(r = -0.43**)
T4(r = 0.34*)
T2(r = -0.64**)
VG ―
T1(r = 0.64**) T2(r = 0.52**) T3(r = 0.46**) T4(r = 0.49**) T5(r = 0.73**)
VR ―
Note. 1. N = 34. 2. RP means Reading Proficiency, TF means Topic Familiarity, RC means Reading Comprehension, VG means Vocabulary Gain, VR means Vocabulary Retention. 3. T1 mean test 1.
In Table 4-16, low to strong correlations were revealed between vocabulary gain
and retention among all the tests, which echoed the finding that the participants’
scores in vocabulary gain significantly correlated with those in vocabulary retention in
85
these five tests. Though reading proficiency was found to correlate with reading
comprehension in Table 4-15, such phenomenon only occurred in test 2 and test 5.
With regard to the correlations between other pairs of variables, no consistent results
were detected among all the tests. Reading proficiency correlated with vocabulary
gain only in test 4 (r = 0.48), and with vocabulary retention in test 3 (r = 0.40) and test
4 (r = 0.41). The participants’ ratings of topic familiarity positively correlated with
vocabulary retention (r = 0.46), but negatively with reading comprehension (r = -0.40)
in test 1. Reading comprehension was negatively correlated with vocabulary retention
(r = -0.64) and vocabulary gain (r = -0.43) in test 2, but positively with vocabulary
gain (r = 0.34) in test 4. On the whole, positive correlation was shown between
learners’ vocabulary gain and retention among these five tests. Besides, similar
phenomenon was also observed between reading proficiency and other variables such
as reading comprehension, vocabulary gain and retention. Except these two cases, no
other similar consistent pattern was demonstrated in Table 4-16.
4.2 Discussion
This section is comprised of four sub-sections where the data presented earlier are
further analyzed and the findings are utilized to answer three major research questions
listed in section 1.4. The relationships between topic familiarity and the participants’
86
vocabulary gain and retention of twenty target lexical items are discussed in section
4.2.1, the participants’ reading proficiency and their vocabulary learning are addressed
in section 4.2.2, learners’ reading comprehension and their lexical development are
further explored in section 4.2.3, and the correlation among all the variables involved
in this research, namely the participants’ evaluation of topic familiarity for all the
texts, their reading proficiency, text comprehension of assigned passages, and
vocabulary gain and retention of target words are investigated in section 4.2.4.
4.2.1 The Participants’ Vocabulary Gain and Retention among Texts of Different Topic Familiarity
To find out the reasons behind the non-significance in the effects of cultural
familiarity on the participants’ incidental vocabulary learning and answer the first
research question, the researcher analyzes one step further and discusses the data
presented in section 4.1.1 from different dimensions here. The first research question
is restated as follows.
(1) When the participants’ are required to read assigned passages mainly for the
purpose of global comprehension and the gist, does less cultural familiarity in
planned reading yield significantly better results in learners’ vocabulary gain and
retention of selected twenty target words?
To start with, the participants’ lexical development among all five texts of
diverse degree of cultural familiarity ratings will be compared together. Furthermore,
87
the influence of the participants’ discrepant perception toward the cultural familiarity
of the same text in each test on their incidental vocabulary learning will be explored
by comparing the scores in vocabulary gain and retention first between the
participants who assign high rankings and those who give low rankings, and then
between those who rate the text high (4 and 5) in the Likert scale and those who rate
low (1 and 2).
The Comparison of the Participants’ Vocabulary Gain and Retention among All Texts
The non-significant differences (see Table 4-4) in vocabulary gain and retention
of five texts of different cultural familiarity ratings might be attributed to the similar
cultural familiarity ratings received by all the five texts. Students consider these five
texts to be of similar cultural familiarity because no significance is found among the
average scores of these cultural familiarity ratings measured by Likert Scale. Due to
this reason, the vocabulary gain and retention of each test (see Table 4-4) is not
significantly distinct from one another in spite of the slightly differences in ratings of
cultural familiarity. This finding is in keeping with the results shown in the translation
production task in Pulido’s study (2004). The data from translation recognition task
(Pulido, 2004) reveal slightly more gain from the more familiar text. The findings in
Pulido’s (2004) study concerning cultural familiarity and those in Hong’s study (2005)
88
reveal that subjects obtain more gains from texts with greater cultural and topic
familiarity. However, such pattern is not consistently supported in the present study
where the vocabulary learning in more culturally familiar texts can be more or less
than that in less culturally familiar texts.
Because no significant difference is detected in the participants’ ratings of
cultural familiarity among the selected five texts (see Table 4-4), the influence of
diverse extent of cultural familiarity on the participants’ lexical development could
not be readily observed and explored. Therefore, the comparison of test 3 (Puppet
Theater: less culturally familiar) and test 5 (Math Anxiety: more culturally familiar)
whose cultural familiarity ratings exhibit statistical significance (see Table 4-5) is
made to find out the answers to the first research question. According to Table 4-6, the
participants obtain a slightly higher mean score for vocabulary gain but a lower mean
score for vocabulary retention in less familiar test (test 3). Some previous researchers
(Graesser & Nakamura, 1982; Graesser, Woll, Kowalski, & Smith, 1980; Rizzella &
O’Brien, 2002; Yekovich & Walker, 1986) maintain that the lower lexical gain in the
culturally familiar text might be attributed to high level of source confusion which is
triggered by the competition between activation from background knowledge and that
from episodic memory gleaned from text messages. In other words, they might have a
hard time distinguishing between words actually embedded within the passage and
89
those closely concerned with the theme but never explicitly presented. This in turn
thwarted the participants’ attempt to notice the outward manifestation of the target
words, let alone learning their meanings from the context. To understand why the
participants’ mean scores in vocabulary gain and retention in less culturally familiar
text (test 3) were not consistently higher than those in more culturally familiar text
(test 5), the researcher further examined their performance in terms of pretest and
immediate test between test 3 and test 5, as shown in Table 4-17.
Table 4-17: The Participants' Performance in Pretest, Immediate Test, and Posttest between Test 3 and Test 5
Test3 Test5 Test
M SD M SD t
Pretest 8.69 2.03 12.40 2.79 -7.38**
Immediate test 11.46 2.65 14.90 2.94 -5.69**
Post test 9.69 2.48 14.16 3.19 -8.03**
Note. N = 34.
From Table 4-17, the researcher found that they consistently got significantly
higher scores in the pretest, immediate test, and posttest in test 5 than in test 3, which
revealed that they knew target words better in the text of higher cultural familiarity
and they thus had less room for improvement for those target words in test 5 and
achieved less vocabulary gain. On the other hand, the participants’ higher vocabulary
retention in the more familiar test could be ascribed to their superior ability to learn
90
unknown lexical items and the assistance of the text which could help them recall the
contextual meanings of target lexical items better. This echoes Nation and Coady’s
contention (1988) that the background knowledge could be capitalized on by the good
readers to help anticipate the occurrence of certain words, which in turn assists the
participants in inferring word meanings from the context. Consequently, their scores
in the immediate test and the posttest were quite close to each other, which testified
that they still retained a similar degree of word knowledge for those target words in
test 5 after reading the text and they thus obtained higher scores in vocabulary
retention. On the contrary, the less cultural familiarity of test 3 did not help students’
retention of target words as efficiently as that of test 5. As a result, the participants’
learning of target words in the immediate test could not remain at the same level in
the posttest and faded away over time there, which rendered a lower mean score in
vocabulary retention.
Based on the results in these two tests (test 3 and test 5), different cultural
familiarity might not leave any significant impact on learners’ vocabulary gain and
retention. However, the participants may recall the target words in more familiar text
better for they could more readily and quickly associate them with the content and
thus performed better in vocabulary retention. The aforementioned discrepancy in
vocabulary acquisition in culturally familiar and unfamiliar texts principally did not
91
reveal statistical significance, which showed that the participants’ performance was
basically similar regardless of the cultural familiarity of the texts. Besides, higher
familiarity in test 5 did not really significantly facilitate their general understanding of
the main ideas, which was verified by the participants’ mean scores in the reading
comprehension section presented in Table 4-6. As a result, they did not necessarily
allot more or less attention to the target words, which in turn brought about
insignificant vocabulary learning. This was in contrast with previous researchers’
assumptions (Haastrup, 1989; Hulstijn et al. 1996; Jiang, 2000; Parry, 1997) that
higher cultural or topic familiarity would increase the ease of attaining the global
picture of the assigned passage, which made readers focus less efforts on unknown
words and consequently fail to notice them. When the researcher compares the
participants’ vocabulary gain with their vocabulary retention, the mean scores of the
latter were lower due to attrition over time, which echoes previous researchers’
findings (Pulido, 2004; Hong, 2005). Though there might be some subtle differences
between the scores of these two tests in vocabulary gain and retention, no significance
was shown, which indicated that topic familiarity did not significantly influence
learners’ performance in vocabulary learning of target words.
The researcher further explores whether those who regard the text as less
culturally familiar would get higher scores than others who perceive the text as more
92
culturally familiar in vocabulary gain and retention in each test. From the data in some
tables (Table 4-7 to Table 4-8), low-ranking givers generally obtain lower mean scores
than high-ranking learners in vocabulary gain and retention, the same phenomenon
also appears in the comparison between low-rating and high-rating the participants
(see Table 4-9 to Table 4-10). This further supports Adam’s assertion (1982) that
learners could infer the words more successfully if they are more aware of the topics.
However, the disparity is not statistically significant. This might stem from the similar
perception the participants hold toward all the five texts in terms of cultural familiarity.
In the beginning, the researcher asks them to give rankings instead of evaluating these
five texts measured by means of Likert scale. Although these texts are ranked
differently, their distinction in cultural familiarity might not be noticeable enough,
which suggests that these five texts might originally be considered culturally familiar
to a similar extent. This assumption is later confirmed by the insignificance in the
topic familiarity ratings of five texts by Likert scale in Table 4-4. In brief, these five
texts are subsumed under the issue “Taiwanese Culture” and are consequently
regarded not very different in terms of cultural familiarity. As a result, the effect of
cultural or topic familiarity might not be significantly salient. With regard to why the
vocabulary learning of the participants who perceive the text more culturally familiar
is inferior to that of their counterparts with less culturally-familiar perception, some
93
major reasons are found as follows. First, the participants who consider the text more
culturally familiar might gain less in lexical development due to their less extent of
progress, their definition which is originally appropriate in the pretest but
incompatible in the context of the assigned texts, the ceiling effect caused by their
superior prior knowledge of the target words. Besides, their incidental vocabulary
learning might be eclipsed by their counterparts because those who regard the text as
culturally unfamiliar might improve from total innocence to the impression of having
seen the word in Vocabulary Knowledge Scale (from 1 point to 2 points), while the
former group do not show any improvement (from 2 points to 2 points). These
possible explanatory comments are induced and attained from the following
discussion.
94
Different Participants’ Rankings of Cultural Familiarity and Their Vocabulary Gain and Retention in Each Text
Among the mean scores in vocabulary learning between high-ranking and
low-ranking groups, the former only performed less well than the latter in vocabulary
gain in test 4 (see Table 4-7). To clarify the cause of such phenomenon, the researcher
examined these two groups’ mean scores in pretest and immediate test presented in
Table 4-18, and their performance in each target word along with vocabulary gain in
Table 4-19.
Table 4-18: The Participants' Performance in Pretest and Immediate Test in Test 4
HRk LRk Tests
M SD M SD t Pretest 9.11 1.90 8.57 2.01 0.66 Test 4
Immediate Test 11.30 1.50 10.80 2.49 0.54
Note. HRk means participants who gave high ranking (4 and 5) to the text in test 4, and LRk means those who gave low ranking (1 and 2).
95
Table 4-19: The Participants' Vocabulary Learning for Each Target Word in Test 4
HRk LRk TW
Mean SD Mean SD t
TW13
(ancestral) 1.78 0.67 1.67 0.82 0.34
TW14
(clan) 1.67 0.71 1.20 0.41 2.05*
TW15
(compound) 2.11 0.93 2.13 1.06 -0.05
Pretest
TW16
(extend) 3.56 0.88 3.57 0.82 -0.03
TW13
(ancestral) 3.67 1.00 3.40 1.23 0.55
TW14
(clan) 2.50 1.00 2.27 0.86 0.60
TW15
(compound) 2.00 0.00 2.33 0.88 -1.13
Immediate test
TW16
(extend) 3.17 0.75 2.83 0.56 1.25
TW13
(ancestral) 1.89 0.86 1.73 1.40 0.30
TW14
(clan) 0.83 0.71 1.07 0.82 -0.71
TW15
(compound) -0.11 0.93 0.20 1.31 -0.62
Vocabulary gain
TW16
(extend) -0.39 1.08 -0.73 0.68 0.96
Note. 1. HRt means participants who gave high ranking (4 and 5) to the text in test 4, and LRt means those who gave low ranking (1 and 2). 2. HRt (N = 9), LRt (N = 15). 3. TW represents Target Word.
In Table 4-18, the mean scores in pretest and posttest for HRk group were higher
than those for LRk group. The vocabulary gain of the HRk group was lower than that
96
of the LRk group due to less lexical improvement. When examined in more detail in
Table 4-19, though the HRk group obtained better vocabulary gain in TW 13 and TW
16 but worse scores in TW 14 and TW 15 than LRk. Regardless of the differences in
the vocabulary gain of each target word, no significance is found.
The data are further analyzed by randomly selecting nine participants
respectively from the high-ranking and low-ranking groups mentioned above.
Likewise, those who consider topics to be more culturally familiar tend to perform
better in most tests, but not to a significant degree. The performance of the
high-ranking and low-ranking groups in vocabulary gain and retention in test 4, and in
the vocabulary gain in test 5 is illustrated in Table 4-20. The former group obtain
lower mean scores than the latter group in these aspects.
Table 4-20: The Participants' Vocabulary Learning in Test 4 and Test 5
HRk LRk
Tests M SD M SD t
Pretest 9.11 1.90 8.22 2.11 0.94*
Immediate Test 11.33 1.50 10.78 2.95 0.50 Test 4 Posttest 11.89 2.42 11.56 2.65 0.28 Pretest 14.06 2.53 11.33 3.20 2.00 Immediate Test 15.89 2.91 13.67 3.30 1.52 Test 5 Posttest 15.67 3.00 12.61 3.16 2.10
Note. 1. N = 9 for both H (high) and L (low) groups. 2. HRk means the group which gave higher rankings to texts (4 and 5), LRk is the group which assigned lower rankings to texts (1 and 2).
97
With regard to test 4, the high-ranking group’s performance in pretest, immediate
test and posttest is better than that of the low-ranking group, and its mean score in the
pretest is even significantly higher than its counterpart. Nevertheless, its vocabulary
gain and retention are inferior to those of the latter group due to less improvement in
lexical knowledge. To be more specific, the LRk group achieves higher vocabulary
gain mainly in TW15 (compound) and TW16 (extend). As for the TW15 (compound),
some participants of the LRk group made progress in their self-evaluation of
knowledge for the target word “compound” from 1 (never seen this word) to 2
(having seen this word but do not know its meaning) or from 2 to 3 (having seen the
word and probably know it meaning in the right semantic field), while the HRk group
know other definitions of this word (e.g. “compound” sentences) and could get a
higher score (3 or 4) in pretest, but such definition is infelicitous in the context of the
assigned passage (e.g. an area that contains a group of buildings and is surrounded by
a fence or wall) in test 4 and it thus gets lower grades in the immediate test. For TW16
(extend), the better vocabulary gain of the LRk group lies in the fact that some of the
participants’ scores move from 1 to 2 and thus obtaine some scores, while most HRk
group participants fail to use the word correctly in terms of the part of speech and thus
attained less scores in the immediate test.
Concerning the vocabulary retention in test 4, the differences between the HRk
98
and the LRk group consist primarily in their performance in TW15 (compound) and
TW16 (extend). In TW15, the LRk group obtains more vocabulary retention because
most HRk group learners report that they have seen this word in the pretest but do not
make any progress in posttest but three participants in the L group improves from one
point to two points, and another one who originally does not know the word is even
able to use the word semantically and syntactically appropriate in a sentence. In
TW16, the HRk group performs better because two to three participants could retain
this word better and make more improvement.
Speaking of vocabulary gain in test 5, the HRk group slightly falls behind the
LRk group. As shown in Table 4-20, though it has higher mean score than the LRk
group in pretest and immediate test, its vocabulary gain does not surpass the LRk
group due to its less amount of progress. This phenomenon arises mainly from the
differences between these two groups in TW17 (abstract) and TW18 (anxiety). In
TW17, the HRk group does better because some of the participants learn more about
the target word (from 2 or 3 to 5), while some learners in the LRk group only gets one
point higher than their scores in the pretest. In TW18, the LRk group performs better
because almost all the members show increase in their scores and could use the target
word felicitously. However, some learners in the HRk group who originally knew
more about the target word does not use it properly and one of them even forgets what
99
it means in the immediate test. That widens the gap in the vocabulary gain between
these two groups in TW18.
Different Participants’ Ratings of Cultural Familiarity and Their Vocabulary Gain and Retention in Each Text
The participants’ incidental vocabulary learning is further probed into by
examining the data collected when the cultural familiarity of each text is determined
by Likert Scale. Those who give higher ratings to topics tend to, though not
significantly, perform better in most tests. However, as shown in Table 4-9, the
high-rating group obtains lower mean scores in vocabulary gain and retention in test 2,
and in the vocabulary gain in test 3. The reasons behind such phenomena were
analyzed and discussed in the following section.
For more detailed analysis of the participants’ lexical development in test 2 and
test3, the results of their mean scores in the pretest, immediate test and posttest were
shown in Table 4-21.
Table 4-21: The Participants' Vocabulary Learning in Test 2 and Test 3
HRt LRt
Tests M SD M SD t
Pretest 13.20 2.15 12.35 2.63 0.79 Immediate Test 15.95 2.42 15.45 1.01 0.60 Test 2 Posttest 13.45 1.67 14.25 2.04 -0.96 Pretest 8.81 2.14 8.25 1.42 0.71 Immediate Test 12.69 2.87 10.42 2.69 1.80 Test 3 Posttest 9.13 3.01 9.38 2.14 -0.22
Note. 1. HRt means the group which gave higher ratings to texts (4 and 5), LRt is the group which assigned lower ratings to texts (1 and 2). 2. Test 2: HRt (N = 10), LRt (N = 10); Test 3: HRt (N = 8), LRt (N = 12)