國立臺灣大學土木工程學系 碩士論文
Department of Civil Engineering College of Engineering National Taiwan University
Master Thesis
評估 BIM 模型複雜度的方法
A Method to Measure the Complexity of Building Information Models
金祥安
Ariel Antonio Quintero Collado
指導教授:康仕仲 教授 共同指導:紀宏霖 教授 Advisor: Prof. Shih-Chung Kang Co-advisor: Prof. Hung-Lin Chi
中華民國 107 年 6 月 June 2018
Acknowledgments
I need to express my sincere thanks to all the persons who contributed on my way until during these two-year process of adaptation, acceptation, and self-improvement.
First of all, I wish to thank Prof. Shih-Chung Kang, my advisor, for all the effort, support, and advice during my research process. Without his guide, the path to complete this thesis would be a significant difficulty or impossible for me. I feel privileged for having had the opportunity and being part of his research students team. I also want to thanks to my defense committee, Prof. Hung-Lin Chi, Prof. Yu-Cheng Lin, and Prof. Hung-Ming Chen, to participate in my oral defense and help to improve my research with their valuable suggestions. From my oral defense committee members, I want to express special thanks to the Prof. Hung-Lin Chi, my co-advisor, for the effort, dedication, attention, and motivation provided unconditionally to me. His efforts are essential in the process to develop, shape and complete my research topic.
Other people also contributed during the development of my research, most of them are part of the National Taiwan University Computer Aided-Engineering group. From here I would like to especially thank Yao-Yu Yang, Chin-Chun Chou, Wei-Liang Kuo, Tzong- Hann Wu, Yin-Yu Zhang, Liang-Ting Cai, Hao-Wei Xu and all the other CAE members who helped me by giving suggestions and support regarding developing problems, coding problems, logic, implementation and methodology problems.
Also, I would like to thank the Institute for the Formation and Use of Human Resources in Panama (IFHARU), for believing and providing the sufficient economic support which allowed me to finish the entire master program at the National Taiwan University.
Finally, I would like to sincerely thank my family. Their love, support, and sacrifices made me had the courage to complete this thesis. They have been supporting me during
all my accomplishments while I have been away from home. This thesis is and efforts are dedicated to all of them.
Abstract
The research paths regarding complexity in the architecture, engineering and construction industry (AEC) are the complexity of the project, the complexity of the design and the building complexity. These research paths agreed that the current design tools allow the creation of more complex designs, which are related to direct construction problems and indirect problems such as visualization or communication. This research developed a method to characterize factors to determine the complexity of a building from two points of view. One point of view is the construction complexity, where the factors are dedicated to determining how hard the design make the construction (Buildability, Multidisciplinarity, Size); and the geometric complexity, where factors are used to determine how hard is to describe the geometry of the building main part (General Geometric Entropy, Variety, Number of elements). These factors metrics characterization were implemented directly in the BIM authoring tool through a visual programming plug- in, allowing the designer to obtain an objective and comparable evaluation of their design.
The method was tested by using a two-stage testing process, where the factors for each complexity type were tested individually and in groups. Both complexities used the same selected BIM models with obvious complexities differences. The results showed that the building with the simplest geometric design obtained a low geometric complexity of (4.5,0,1) for its foundation; (10.82,2.07,20) for its shell; and (7.56,0,4) for its interior. On the other hand, the most complex building scored (0,0,76) for its foundation, (17.04,2.39,989) for its shell and (16.67,2.66,699) for its interior. The construction complexity showed a similar pattern where the simplest building scored (24.3,24,136), while the most complex scored (24.1,40,2515). This confirmed that the metrics could obtain correct scores to characterize each factor according to their definitions and also according to their group complexity definitions. In conclusion, this research developed a
method that can be used to determine how hard is to describe the geometry of a building and how hard is to create a building directly from the BIM model. The method implies that further direct and indirect construction problems can be avoided by having an idea of the level of complexity that the design is scoring.
Keywords: Complexity, BIM model, Revit, Dynamo, Buildings, Construction Complexity, Geometric Complexity, Geometric Entropy, Buildability.
摘要
現在工程和建築行業(AEC)有幾個關於複雜度的研究分支:工程專案複雜度,
建築設計複雜度,本研究提出建築複雜度是為第三項。這些研究分支一致認為,
目前的設計工具允許創建更複雜的設計,這些複雜的設計可能造成施工上的問題 以及可視化和溝通等間接問題。本研究將建築複雜度分爲施工複雜度跟幾何複雜 度兩種類型。施工複雜度由三個因素決定其施工困難性,這些因素是:可建設 性、多領域性和尺寸。幾何複雜度也由三個因素用來定義建築物主要部分的幾何 形狀的難度,這些因素是:通用幾何熵、多樣性和元素數量。本研究設計了一套 方法可以將這些因素在 BIM 軟體工具中以可視化程式插件實現,使設計人員能夠 對其建築設計進行客觀評估。本研究對兩種複雜度類型的因素進行單獨和分組兩 階段的測試。這兩種複雜度類型都使用了具有明顯複雜度差異的相同 BIM 模型。
結果表明,該建築具有最簡單的幾何設計的基礎得了最低的幾何復雜度分數為 4.5、0、1,其外觀為 10.82、2.07、20,其內部為 7.56、0、4。該建築具有最複 雜的幾何設計的基礎得了最低的幾何復雜度分數為 0、0、76,其外觀為 17.04、
2.39、989,其內部為 16.67、2.66、699。施工複雜度顯示了相同的模式,其中最 簡單的建築得了 24.3、24、136,而最複雜的得了 24.1、40、2515。這證實了這 些指標可以獲得正確的分數,以根據各自的定義並根據其群組複雜度定義來表徵 每個因素。總之,這項研究開發了一種方法,可以直接從 BIM 用來確定建築物的 幾何描述難度 還有建築物創建的難度。該方法意味著可以通過對設計得分的複雜 程度有一個概念來避免進一步的直接和間接的構建問題。
關鍵詞:複雜度,BIM 模型,建築物,施工複雜度,幾何形狀的難度,通用幾何 熵,可建設性。
Table of Contents
Acknowledgments ... ii
Abstract ... iv
摘要 ... vi
Table of Contents ... viii
Table of Figures ... xii
List of Tables ... xiv
1 Introduction ... 1
2 Literature Review ... 3
2.1 General Complexity Meaning ... 3
2.2 Complexity in AEC ... 4
Project Complexity ... 4
Design Complexity ... 5
Building Complexity ... 6
2.3 Complexity vs. Level of Development (LOD) ... 10
3 Research Objective ... 11
4 Methodology ... 12
4.1 Assumptions ... 12
4.2 Database Preparation ... 15
4.3 Labeling Stage ... 16
4.4 Grouping Stage ... 16
4.5 Characterization Stage ... 17
Geometric Complexity: How hard is to describe the building main part geometry? ... 18
1 Geometric Entropy ... 18
Variety ... 20
3 Number of Elements ... 20
Construction Complexity: How hard is to create this building? ... 21
1 Buildability ... 21
2 Multidisciplinarity ... 24
3 Size ... 26
4.6 Ranking process ... 27
5 Implementation ... 30
5.1 Database Preparation ... 30
5.2 Labeling Stage ... 31
5.3 Grouping Stage ... 33
5.4 Characterization Stage ... 35
General Geometric Entropy ... 35
Variety ... 39
Number of Elements... 39
Buildability ... 40
Multidisciplinarity ... 43
Size ... 44
6 Testing Cases ... 45
6.1 Test Procedure ... 45
6.2 Test Models ... 46
6.3 Results ... 48
Geometric Complexity Results ... 48
1 General Geometric Entropy ... 49
2 Variety ... 49
3 Number of elements... 50
4 Group Factor Results ... 50
Construction Complexity Results ... 52
1 Buildability ... 53
2 Multidisciplinarity ... 53
3 Size ... 53
4 Group Factor Results ... 54
7 Discussion ... 55
7.1 Geometric Complexity Discussion ... 55
General Geometric Entropy ... 55
Variety ... 56
Number of Elements... 56
Group Factor discussion ... 56
7.2 Construction Complexity Discussion ... 58
Buildability ... 58
Multidisciplinarity ... 58
Size ... 59
Grouping Factor Discussion ... 59
7.3 Implications ... 60
7.4 Limitations and Future Work: ... 62
8 Conclusion ... 64
9 Reference ... 66
Table of Figures
Figure 1 Complexity of projects……….………...5
Figure 2 Complexity of buildings, geometric and non-geometric information relation concept ……….…..…...…7
Figure 3 Complexities determining how the design affects directly or indirectly the construction………...………....8
Figure 4 Factors affecting the geometric complexity and the construction complexity...9
Figure 5 Process Resume……….………..…..14
Figure 6 Database structure for further complexity characterization……….………….15
Figure 7 Building instance labeled with the corresponding assembly codes……….….16
Figure 8 Grouping stage steps……….………17
Figure 9a 3D Solid vertex, face and edge labeling………..……….…..18
Figure 9b Building main part individual entropies……….19
Figure 9c Building main part general entropy………19
Figure 10 Adapted buildability scoring method metrics for core construction systems.21 Figure 11 Elements involved in the floor area calculation……….……...26
Figure 12a Uniformat classification in the Revit interface……….……..…..32
Figure 12b Assembly Code parameter in the type properties....……...……….……….32
Figure 12c Drop down button to the Uniformat Assembly Code selection interface...32
Figure 13 Assembly Code interpretation……….………33
Figure 14 Grouping stage Dynamo code procedure……….………...34
Figure 15a User input, conceptual building main part made of different instances……35
Figure 15b User input, merged 3D solids………35
Figure 15c Vertex internal angle calculation and vertex labeling………...36
Figure 15d Face labeling………...…………...37
Figure 15e Edge labeling………...……..37
Figure 15f General geometric entropy Dynamo code procedure….………...……38
Figure 16 Variety from the individual entropy scores, Dynamo code procedure..…….39
Figure 17 Number of elements Dynamo code procedure ………..…….39
Figure 18a Buildability calculation example……..………...………..41
Figure 18b Buildability Dynamo code procedure……….……...……...42
Figure 19 Multidisciplinarity Dynamo code procedure………..43
Figure 20 Size factor, Dynamo code procedure……….…….……44
List of Tables
Table 1 Worst and best buildable hypothetical cases………..………....23
Table 2 Multidisciplinarity compilation………..………25
Table 3 Factor metrics compilation……….………27
Table 4a Complexity factor result example 1…...……….……..27
Table 4b Complexity factor result example 2………....……….27
Table 5a Complexity sorted result for example 1……...……….28
Table 5b Complexity sorted result for example 2…….………….………..…...28
Table 6a Sorted building names for example 1...……….……….…..28
Table 6b Sorted building names for example 2...……….……...28
Table 7a.1 Example 1 weight summation……….…………..………29
Table 7a.2 Example 1 building ranking result.………29
Table 7b.1 Example 2 weight summation……….………..29
Table 7b.2 Example 2 building ranking result……….…...29
Table 8 Uniformat sample flat table….….……….………..……...30
Table 9 Uniformat flat table extended…………..………...………31
Table 10 Building model samples……….…..………46
Table 11 Geometric complexity results………...48
Table 12a Geometric complexity results……….50
Table 12b Foundation sorted results………50
Table 12c Shell sorted results……….…………...50
Table 12d Interior sorted results………..…………...51
Table 12e Geometric complexity weighted results………...………..51
Table 12f Foundation weight summation………51
Table 12g Shell weight summation……….…51
Table 12h Interior weight summation………...…..51
Table 12i Foundation ranking………..51
Table 12j Shell ranking………..………..51
Table 12k Interior ranking………..….51
Table 13 Construction complexity results……….…………...52
Table 14a Construction complexity results……….54
Table 14b Construction complexity sorted results………..54
Table 14c Construction complexity weighted results……….54
Table 14d Construction complexity weight summation……….54
Table 14e Construction complexity ranking……….……..54
1 Introduction
A building design may affect construction in two ways, directly and indirectly.
When a design affects the construction directly, it means that the building’s design, shape, materials and construction methods can influence the building process by increasing the complexity of construction. A design affects a building construction indirectly in many ways, two of them could be by affecting the visualization or communication. A complex design can affect the visualization of the buildings by having a high geometric complexity design part. A complex design can also affect the communication between the personal by increasing the number of disciplines that a building requires for construction or preliminary design assessment.
BIM models provide the facilities to allow the designers to obtain different types of information of the closest representation of the real building, which is the BIM model.
The information in the BIM model can be applied to different uses. This research uses it to create an objective measurement of the problems mentioned above. The purpose is to help designers of the building to achieve early assessment that implies improvements in the selection of visualization methods; early plan for communication possible problems, and in the worst of the cases a score to concern if the current design achieves the buildable or not conditions.
The term complex has been interpreted differently in the engineering field depending on where it is applied. The architecture, engineering and construction industry (AEC) defines the complexity in different paths, where complexity is defined regarding the project organization or the process [1]; or in the Building design [2]. Independently from the focus, they all agree that current technologies facilitate the increase of complexity on the field [2, 3, 4].
In the manufacture industry, complexity is defined basically focused on three categories, which are: the product complexity, the manufacturing system complexity and, the business and market complexity [5]. This research main focus is on making an analogy on the manufacturing industry, specifically on their definition of product complexity which represents the building in the AEC industry or its closest representation, the BIM model. The same as a product in the manufacturing industry, a BIM model possess different numbers of elements, disciplines, buildability, geometry, size, and variety. This analogy aims to use the product complexity factors [5] as main indicators to obtain the BIM complexity as defined in this research.
It is possible to separate those factors into two main categories which are: the construction category and geometric category. For the construction category, factor such as multidisciplinarity, size and buildability will become the basic factors that constitute the BIM model construction category; on the other hand, number of elements, variety, and geometry are the basic factors that constitute the BIM model geometric category.
Those two categories have one characteristic in common, which is the large quantity of data that make difficult to obtain a general and objective idea of the building model complexity. By using correct metrics, all this data can be represented in a way that allows the designer of the model goes from a general personal idea to a much more objective one. This research introduces a method to measure the building information model complexity, which is provided as a combinatory score obtained from the geometric complexity and the construction complexity of the BIM model.
2 Literature Review
Complexity is a term that has been subjected to different fields in the scientific, industrial and research area. The definition of complexity may vary depending on its specific application as an independent term. Below will be discussed how this meaning is applied in a general way and how the definitions are ramified in a specific field such as the AEC field.
2.1 General Complexity Meaning
Generally, the meaning of the word ̏ complex ˝ may lay in a state where requirements remain between well-defined and uncertain [5], or it could refer to non-easy to analyze or understand [6]. Independently of the meaning that a field is taking, its definition gets a concrete meaning depending on where the field applies it.
Part of the extensive research on complexity focuses on find ways to estimate or characterize the complexity and the reason for this estimation, is to objectify and make it comparable [7]. To estimate the type of complexity is necessary to know what is the meaning of the value obtained with this estimation. Then to correctly interpret this value is necessary to understand well what is wanted to be answered with that complexity estimation.
According to Fisk [7], researchers that characterize a complexity type, frequently ask these questions, how hard is to describe something? How hard is to create something?
What is its degree of organization? By objectively quantify any of these questions, the researcher then can quantify complexity type. The way to measure complexity vary, and it entirely depends on the field of application. Depending on the field of application, the factors used to measure complexity will change as well.
2.2 Complexity in AEC
Complexity in the AEC industry has been extensively explored. It started with the idea of stating an objective range for complexity reduction of the AEC systems. Currently, the term complexity is mainly applied in the AEC from two perspectives. One is the engineering perspective the other one is the architectural perspective. Both perspectives coincide on warning that current technological advances are allowing for a higher complexity on building design [2,3] and construction projects [1]; which is a tendency that is happening to all the engineering systems [4]. Besides the two main complexity perspectives in the AEC, this research categorizes all the derived complexities from the building design and for specific use as part of the building complexity, which will be discussed under the building complexity title.
Project Complexity
From the engineering perspective, the term complexity is mainly focused on the project complexity because the construction project is considered the most complex compared to others in any industry [8] and its believed that the complexity on a project affects the project’s time, cost, success, and quality [1]. This complexity is something experienced by the project manager [9].
One of the first to categorize a project depending on the complexity was Santana [10]. He proposed a method to classify projects into normal, complex and singular There he considered a project to be ̏ the sum of the planned activities, material or otherwise, of an organization to convert an idea or a design for engineering or construction work to fulfill human or economic needs within limits of quality, cost, and duration. ˝ [11]
Baccarini [8], proposed an even formalized version of project complexity, there he defined project complexity as ̏ consisting of many varied interrelated parts and can be operationalized in terms of differentiation and interdependency ˝ . Which is a definition
that can be applied to any project dimension. Besides the definition, he stated clearly that is very important to recognize the type of complexity that is being dealt with and he declares the two main types of complexities at the moment which were organizational complexity and technological complexity.
Along with the years of exploration and research for the complexity area in projects, many factors, dimensions, and categories were included in the project complexity estimation. Currently, the project complexity has five dimensions, which are:
the socio-political, the pace, the dynamic, the uncertain, the structural [9]. These dimensions are grouped into three categories: the structural category, which includes the pace and the structural complexity; the Socio-political category; and the Emergent complexity, which include dynamic complexity and uncertain complexity [12]. See figure 1.
Design Complexity
From the architectural perspective; the complexity research mainly focuses on the design complexity. The design complexity characterization primary goal is to categorize and open a range for a reduction in the building design [2]. The design complexity is not being as explored as the project complexity and it can be defined from two perspectives
Figure 1 Complexity of projects. [12].
which are the modeling perspective and the shape perspective. This type of complexity is produced by the designer, and it has effects on the project manager and the building users.
The modeling perspective refers to design complexity as for how hard is to create the model. It is measured as the ratio of added design content to added construction content. Where the commands that a computer-aided needed to create an object are the design content and the construction content represent the construction commands that the design object requires [2]
The shape perspective refers to the complexity of the design result or the shape of itself. The shaped result of an architecture model is mainly a 3D model that is made of several elements that together represent the building. A building model shape can be categorized as complex if this one possesses high geometric complexity elements, or it may be considered complex by possessing many low complexity elements [13]. Another way to determine the complexity of the shape in an architectural model is by categorizing it as having a high combinatorial complexity compared with other 3D models in other industries [14].
Building Complexity
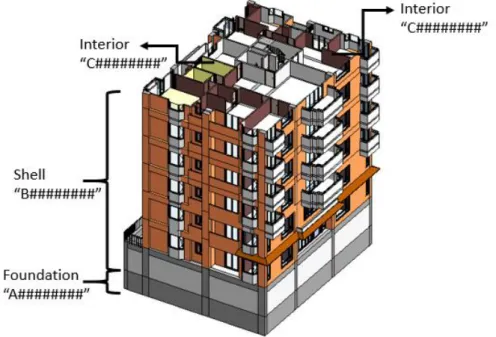
The product or the final goal of a building construction project is a building. This one has a structure designed for exclusive use, and it consists of many interacting elements from different disciplines. The shape of that building’s elements represents the geometrical information. All other information represents the nongeometrical information (See figure 2). These two types of information can be used to create new types of complexity measurements, which are independent of the project information but dependent on the geometric information.
The building’s derived complexities may have a direct relationship with the building elements geometry. The geometrical information of the building and the needed
nongeometrical information obtained from the relation between the building elements are the basis to set new complexities depending on what is wanted to be categorized. For different uses, a complexity measurement can categorize the effect of the design on that specific use.
The term complexity in building was first used to categorize the building from energy efficiency and occupant comfort point of view [15]. The building could be categorized as complex if the energy efficiency indicators and the comfort indicator were not showing correct results due to a possible under design building.
The design of the walls, doors position, and hills in a building may affect directly the way people enter and leave the building. This effect can be considered an issue from the fire safety usage perspective. The effect of how hard is to get out of a building is quantified as egress complexity by Donegan, Pollock, and Taylor [16], where the entropy measurement is used to reflect the building 2D plan complexity.
The way a designer creates a 3D model may influence the cost estimation task directly. A measure of how hard is to estimate a building cost from a specific model is
Figure 2 Complexity of buildings, geometric and non-geometric information relation concept.
quantified as the estimation complexity. The number of elements, the shape and geometric features of the building components and the number of trade categories involved in constructing the building components are the factors used to measure the estimating complexity [17].
The shape complexity of the building instances that need to be cast in place is proposed by Jarkas [18] as a factor to calculate the buildability of the formwork labor production. The shape combined with materials and other factors were used as a base to determine the buildable conditions that a design represent from formwork production point of view.
This research proposes a complexity that fits better in the building complexity stream. The complexity referred here is to a way to characterize the effect of the design on the construction directly or indirectly, where the design can make a building increase its construction complexity due to the construction efforts required to create the building.
Also, a design can affect the construction indirectly by increasing the visualization difficulty due to complex design or by increasing the communication due to the number of disciplines involved. See figure 3.
Figure 3 Complexities determining how the design affects directly or indirectly the construction.
The proposed complexity is an analogy of the one defined in the manufacturing industry. The manufacturing industry has three perspectives to define complexity. One of these perspectives is the complexity of a product, which is affected by factors such as number of parts, multidisciplinarity, manufacturability, size, geometry, variety. Another
perspective is the complexity of the manufacturing system; this one is affected by changeability, responsiveness volume, speed, and operational flexibility. The third perspective is the business organization complexity, which is affected by the supply chain dynamics, global competition, market turbulence, and foresight. [5]
Each perspective has factors that affect their complexities established by a specific scope. In the engineering field, the complexities characterization need to have a scope; it could be a part, a product, a system, or system of systems [5]. Due to the similarity of the factors affecting the product complexity and the proposed goal of this research. Its assumed that a building is the product of the construction process, and its complexity may be affected by the factors that characterize the complexity of a product. From this analogy, it is possible to consider using the factors that affect a product from the AEC perspective.
In this case, the factors affecting a building will be the building number of parts, the building size, the multidisciplinarity involved in the building, the buildability, the geometric information of the building and the variety.
The factor affecting the construction complexity and the geometric complexity is obtained from the analogy made to the manufacturing industry and the ones affecting each type of complexity is determined by the author’ try and error process, where the factor and metrics for each factor were tested and changed to obtain the current arrangement. The factors affecting the construction complexity are the buildability, size, and multidisciplinarity. The factors affecting the geometric complexity are the Geometry, variety, and number of elements. See figure 4.
Figure 4 Factors affecting the geometric complexity and the construction complexity.
2.3 Complexity vs. Level of Development (LOD)
The term level of development refers to ̏ the level of detail to which a model is developed and its minimum requirements ˝ [6]. Depending on the requirements different levels will be used on the building lifecycle making the BIM model increase the details geometrically and non-geometrically. The increase of geometrical information causes that the BIM model shows visual details about elements that are needed for a specific stage in the lifecycle. And the increase in non-geometrical information represent that the BIM model contains information that describe the elements with more details that open the use of those elements for much more uses.
The level of development in a BIM model depends on the content that it has. BIM model with a LOD of 100 represents a conceptual model, while a 500 represent the closet level of detail to the As-built state [7]. It is possible to have two different conceptual designs that maybe are going to be used to procure a project and these both designs may have the same level of development. This implies that a level of development only categorizes that model by its available information.
The complexity in a BIM model represents any complexity categorization that is being done to a building by using specific factors and metrics calculation, where the BIM model is used as the representation of the building, and the LOD during the complexity categorization only represents the detailed information presented during the complexity characterization.
3 Research Objective
Current BIM technologies allow building designers create unthinkable products;
on the other hand, processes and technologies used for construction may present a slower advancement trending, letting designing and construction have an unbalanced relationship where mostly old construction methods are applied to nowadays design.
This research focuses on developing a method for measuring the building complexity in the sense of using the building information model as equivalent to the building in study. The measurement allows the possibility to understand and compare buildings designs using scores. In the same way, the measurements allow to understand and compare the direct effect of the design in the construction; and the indirect effect of the design when it affects the visualization or communication of the directly involved parties. The measuring method should generate logic and comparable scores for the BIM model geometric and construction complexity as its defined in the following chapters;
this objective includes formulating two sets of metrics:
- Metrics to calculate the geometric complexity of the 3D building virtual model main parts by extracting information from the model vertex, edges, and faces, variety, and number of parts.
- Metrics to categorize the current construction complexity of the BIM model depending on its buildability, multidisciplinarity, and size.
4 Methodology
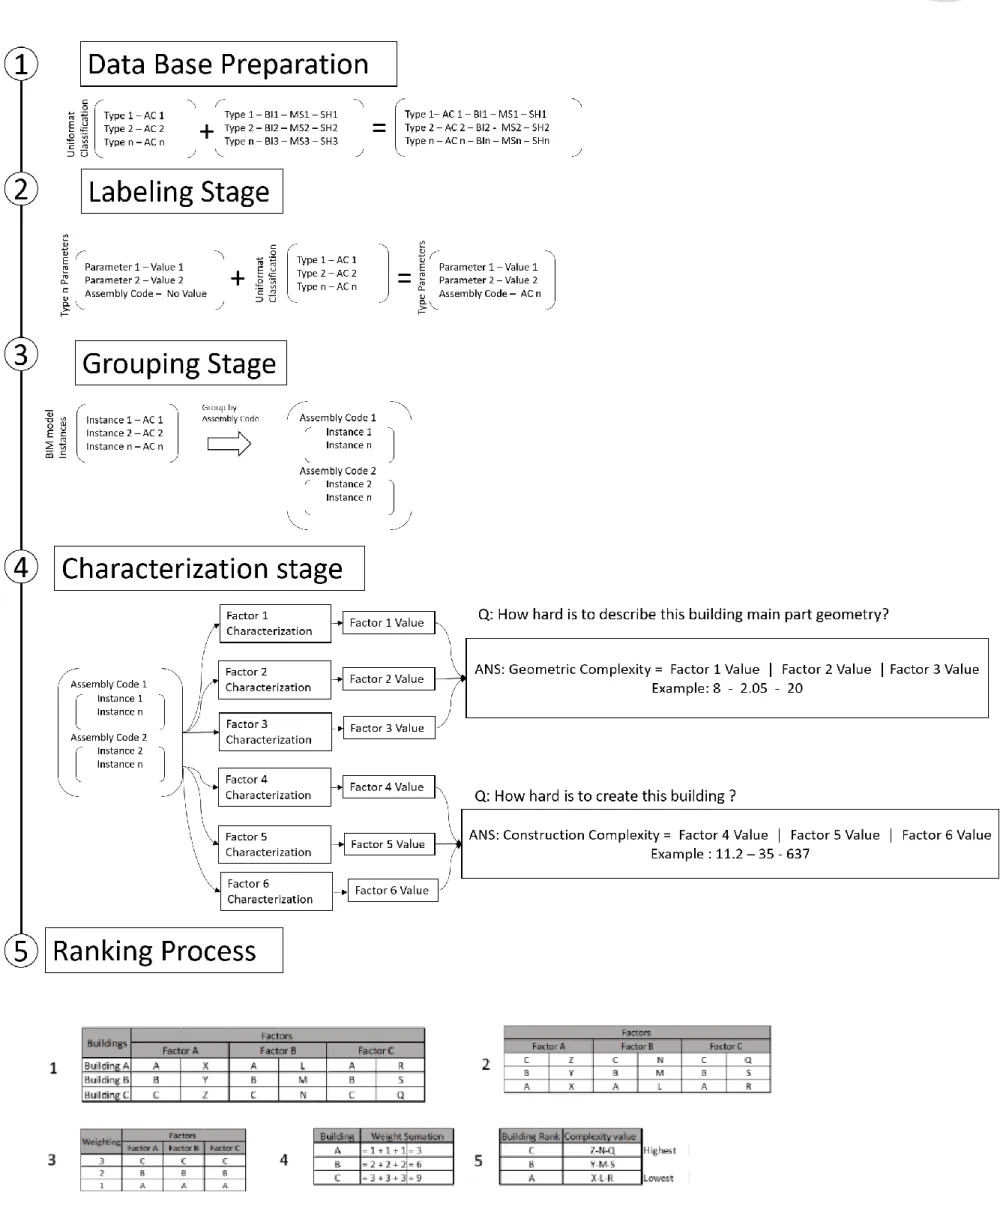
In this research, a complexity calculation and ranking method were created to be applied to architectural BIM models. The developed complexity scoring method aims to allow a designer to evaluate better the current design regarding further construction, visualization or communication problems. This method involves four main steps. First, the database that contains the building classification system is extended with buildability index, building systems weighting and, the directly involved stakeholders in construction and design. Then, all the instances in the model are labeled with their correct assembly code, depending to which one they match in the Uniformat classification system [21];
After that, all the building instances are grouped depending on their assembly code.
Finally, the factor’s metrics are applied to each building main part individually for the geometric complexity factors and together for the construction complexity factors, which are factors that obtain information from an extended database. A ranking methodology is proposed at the end of the chapter to compare the factors scores between buildings with the purpose of make these complexities comparable.
4.1 Assumptions
The developed methods were based on the following assumptions:
A BIM model that approach the closest to the actual construction product is taken
as the equivalent digital version of the construction process product. This model may have components from architectural, structural, mechanical, plumbing and electrical disciplines.
The construction process main goal is to create a product which is the building.
Thus the factors used to characterize a product may have a positive influence in the building complexity characterization if those factors are translated to the AEC field.
The BIM model instance’s geometric information and geometric parameters are
constructed following the best practices, which implies no incomplete solids; or superimposed surfaces vertex or edges.
The model instances are possessing the correct Uniformat Assembly Code. The
Building taxonomy used in this research was the one provided by the Uniformat classification table. All the complexity characterizations in the implementation were based on this building taxonomic hierarchy.
All the Information presented in the methodology chapter is resumed in figure 5:
Figure 5 Process Resume.
4.2 Database Preparation
The building classification system is used as the structure for the database. This classification system’ levels may consist in different hierarchical levels that will represent how the building is arranged from the main parts to the type of the instances. The hierarchical structure focusses its arrangement in the functions of the different building instances. In this case, each instance in the database need a code (assembly code) that represent them; this code will be used for further searching in the database and to recognize their position on the hierarchy of the classification system.
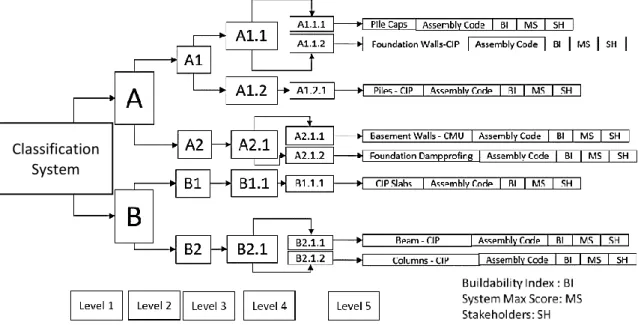
To prepare the database, the data for each instance extended by adding buildability index (BI), which is an index used on to estimate the buildability of a building; building systems max score (MS), which represents the construction core system where the that fits a specific buildability index; and number of ideal stakeholders that influence directly on design and construction (SH). This data represents information that cannot be obtained directly from the BIM model, but it can be retrieved and assigned to the correspondent instances in the building by matching their assembly code. All the added data is related to the construction complexity category. See Figure 6.
Figure 6 Database structure for further complexity characterization.
Classification System
4.3 Labeling Stage
Each instance in the entire BIM model is labeled with their correspondent Assembly code. The Assembly code labeling goes to the type in the BIM authoring tool hierarchy, which means that once one instance is labeled with the correct assembly code, all the instance of the same type will acquire this label. See figure 7.
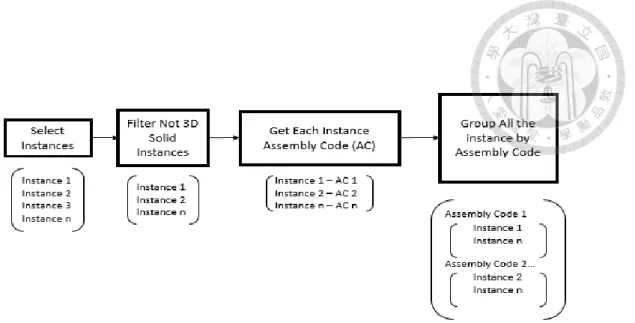
4.4 Grouping Stage
Most of the instances in the BIM model are included for the grouping process.
The grouping process consists of selection, retrieval of data and finally the grouping. For the selection, all the adequate instances that compose the BIM model are selected manually by the user; this method avoids including instance that does not form a 3D solid.
Once the correspondent instances are selected, its assembly code is retrieved from each instance. Last, each instance is grouped into a list depending. This process of grouping ensures the organization for the further complexities characterization. See Figure 8.
Figure 7 Building instance labeled with the corresponding assembly codes.
Figure 8 Grouping stage steps.
This stage uses an idea of complexity measurement from a manufacture industry study, where a product is divided into parts, and each part is analyzed to determine the assembly complexity [22]. The idea of this stage is to separate the building main parts so these can be analyzed and compared due to the possible similarities between design specifically in the building main parts.
4.5 Characterization Stage
The values for the geometric and construction complexities for each building main part or the entire building construction core elements are calculated respectively. The process for this stage is divided into two independent parts the first one is the geometric complexity, There the grouped elements in the grouping stage are used as input. The geometry complexity uses the metrics of the geometric entropy, variety and number of elements factors to assign a value to each building main part. The information required for the geometric complexity characterization is extracted directly from the 3D model geometry. A similar process occurs during the construction complexity characterization, here the entire elements in the BIM model obtain a value from an external database. The values obtained in this complexity are scores for the entire building.
Geometric Complexity: How hard is to describe the building main part geometry?
The factors selected to be responsible for this question measurement are the geometric entropy, variety and elements number. Below are the factors affecting this geometric complexity, their definitions and the metrics used for their calculation.
1 Geometric Entropy
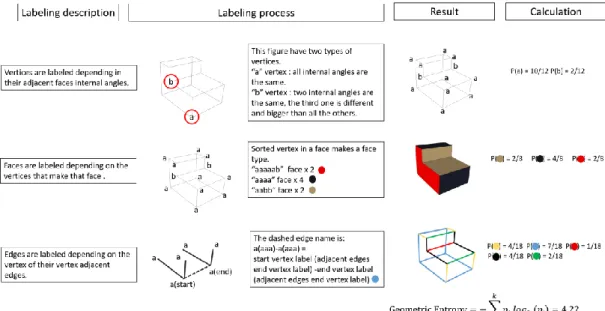
The factor geometric entropy can involve many aspects in a 3D object. This research characterizes this factor regarding geometric entropy, which is a way to measure a 3D object shape. The method used to calculate the geometric entropy was the one proposed by Gero and Kazakov [23], where the vertex of a 3D solid is labeled depending on their adjacent face internal angles; then the 3D solid faces are labeled depending on their vertices, and finally the edges are labeled depending on the edge vertices adjacent edges vertex type. See Figure 9a.
To calculate the geometric entropy is used the number of the different vertex, edge and faces types; the total vertex, face and edge number in a planar solid. The ratio between 𝑁𝑢𝑚𝑏𝑒𝑟 𝑜𝑓 𝑒𝑙𝑒𝑚𝑒𝑛𝑡 𝑇𝑦𝑝𝑒 𝑖 and 𝑇𝑜𝑡𝑎𝑙 𝑁𝑢𝑚𝑏𝑒𝑟 𝑜𝑓 𝐸𝑙𝑒𝑚𝑒𝑛𝑡 is represented by 𝑃𝑖. Those values are plotted in the entropy formula to calculate the geometric entropy obtained from that 3D solid. See Equation 1.
Figure 9a 3D Solid vertex, face and edge labeling.
The geometric entropy is calculated from a 3D solid of an instance. An architectural model may be composed by several instances that are represented by several 3D solids. Also, an architectural model may be entirely represented by one single 3D solid. The geometric complexity takes care of both cases, for this reason, this research applies the geometric entropy calculation to both. The general geometric entropy refers to the calculation of the geometric entropy to the entire building main part; this includes all the elements that form that building main part as one 3D solid by merging them. The individual geometric entropy refers to the calculation of the entropy to the individual instance that forms a building main part. See the Figure 9b and 9c.
Geometric Entropy = − ∑ 𝑝𝑖 𝑙𝑜𝑔2 (𝑝𝑖)
𝑘
𝐼
𝑝𝑖 =𝑁𝑢𝑚𝑏𝑒𝑟 𝑜𝑓 𝑉𝑒𝑟𝑡𝑒𝑥 𝑇𝑦𝑝𝑒 𝑖 𝑇𝑜𝑡𝑎𝑙 𝑉𝑒𝑟𝑡𝑒𝑥
Eq.1
Eq.2
Eq.3
Eq. 4 𝑝𝑖 =𝑁𝑢𝑚𝑏𝑒𝑟 𝑜𝑓 𝐹𝑎𝑐𝑒𝑠 𝑇𝑦𝑝𝑒 𝑖
𝑇𝑜𝑡𝑎𝑙 𝐹𝑎𝑐𝑒𝑠
𝑝𝑖 =𝑁𝑢𝑚𝑏𝑒𝑟 𝑜𝑓 𝐸𝑑𝑔𝑒𝑠 𝑇𝑦𝑝𝑒 𝑖 𝑇𝑜𝑡𝑎𝑙 𝐸𝑑𝑔𝑒𝑠
Figure 9b Building main part individual entropies 3D solid b
3D solid a Merged 3D solid
a and b
Individual geometric entropy for solid a: 4.22
Individual geometric entropy for solid b: 0
General geometric entropy for merged solid: 4.69
Figure 9c Building main part general entropy
Variety
The variety characterization for a geometric model refers to how different are the shapes of the elements in a building main part. This research uses the standard deviation to calculate the variety of the individual geometric entropy values of an entire building main part as calculation metric, where the higher standard deviation is equivalent on a higher range of individual shapes for that building main part. See equation 5.
The values used for this equation are calculated with the same formula used for the geometric entropy 𝐼𝑛𝑑𝑖𝑣𝑖𝑑𝑢𝑎𝑙 𝐺𝐸 is the value for a specific building main part element. 𝑀𝑒𝑎𝑛 𝑜𝑓 𝐴𝑙𝑙 𝐼𝑛𝑑𝑖𝑣𝑖𝑑𝑢𝑎𝑙 𝐺𝐸 is the average of all the individual geometric entropies in a building main part. 𝑁 is the total number of elements that are found in a building main part.
3 Number of Elements
The number of elements characterization refers to the number of elements that form a 3D solid in a building main part. The calculation of the number of elements in this research is the summation of all the 3D solid instances in a building main part. The way to calculate the building instance that composes a building main part is by filtering from the rest of the building instance and then do the summation. See equation 6.
Number of Elements = ∑ 𝐵𝑢𝑖𝑙𝑑𝑖𝑛𝑔 𝑚𝑎𝑖𝑛 𝑝𝑎𝑟𝑡 3𝐷 𝑠𝑜𝑙𝑖𝑑𝑠
𝑆𝑡𝑎𝑛𝑑𝑎𝑟𝑑 𝐷𝑒𝑣𝑖𝑎𝑡𝑖𝑜𝑛 (𝑉𝑎𝑟𝑖𝑒𝑡𝑦) = √∑𝑁𝑖=1(𝐼𝑛𝑑𝑖𝑣𝑖𝑑𝑢𝑎𝑙 𝐺𝐸 − 𝑀𝑒𝑎𝑛 𝑜𝑓 𝐴𝑙𝑙 𝐼𝑛𝑑𝑖𝑣𝑖𝑑𝑢𝑎𝑙 𝐺𝐸 )2 𝑁 − 1
Eq.5
Eq.6
Construction Complexity: How hard is to create this building?
The factors selected to be responsible for this question are the buildability, multidisciplinarity, and size. This question refers to how hard is to create the real building instead of how hard is to create the building model. From those factors is expected to generate rational values that can allow the designer obtain a better understanding of the design from the construction perspective by knowing how hard will be to create.
1 Buildability
This research refers to buildability as ̏ the extent to which the design of a building facilitates ease of construction, subject to the overall requirements for the completed building being met ˝ [24]. Buildability is a factor that gives a score in percentage, for this research the main idea is to obtain how difficult make the design the construction of that specific building.
Buildability calculation method adapt the same calculation as the one used in the Buildability Assessment Method (BAM) developed for Hong Kong [25]. See Figure 10.
Other studies about BAM implementation by other countries were applied by countries like Malaysia, where the metrics followed the same pattern but the indices and max scores changed due to the country standards [26].
Figure 10 Adapted buildability scoring method metrics for construction core systems. [25]
BAM has the purpose of scoring the building when the design of the same is almost completed and help the designer to revise the design to improve buildability [25].
The buildability score is subtracted from the total buildability so can be obtained the difficulty for construction of this design. See equation 7
𝐵𝑢𝑖𝑙𝑑𝑎𝑏𝑖𝑙𝑖𝑡𝑦 𝑓𝑎𝑐𝑡𝑜𝑟 = 100 − 𝑏𝑢𝑖𝑙𝑑𝑎𝑏𝑖𝑙𝑖𝑡𝑦 𝑠𝑐𝑜𝑟𝑒 𝑖𝑛 𝑝𝑒𝑟𝑐𝑒𝑛𝑡𝑎𝑔𝑒
In the BAM metrics, the 𝑆𝑦𝑠𝑡𝑒𝑚 𝑀𝑎𝑥 𝑆𝑐𝑜𝑟𝑒 and 𝐵𝑢𝑖𝑙𝑑𝑎𝑏𝑙𝑖𝑡𝑦 𝐼𝑛𝑑𝑒𝑥 are obtained from data collections and analytical hierarchy process (AHP) [25]. The data collection process will vary depending on the area where is made. This means that different countries may have different buildability indexes for different building elements and systems max score. The 𝐴𝑟𝑒𝑎 𝑜𝑟 𝑉𝑜𝑙𝑢𝑚𝑒 𝑝𝑒𝑟𝑐𝑒𝑛𝑡𝑎𝑔𝑒 represents the way the different systems are distributed in the entire building. 𝑁𝑜𝑟𝑚𝑎𝑙𝑖𝑧𝑎𝑡𝑖𝑜𝑛 𝑓𝑎𝑐𝑡𝑜𝑟 is obtained by dividing the 𝑆𝑦𝑠𝑡𝑒𝑚 max 𝑠𝑐𝑜𝑟𝑒 𝑎𝑛𝑑 𝑡ℎ𝑒 𝐵𝑢𝑖𝑙𝑑𝑎𝑏𝑖𝑙𝑖𝑡𝑦 𝐼𝑛𝑑𝑒𝑥(𝐵𝐼).
See equation 8.
The buildability score is a normalized factor. It does not take in count the building size, but it is directly affected by the way the construction methods or materials are distributed in the entire building. In this case, the core construction systems for a specific area may have predetermined their specific construction method that is linked to the material type used in construction.
The area or volume percentage of all the instances that are part of specific system type in one of the core construction systems are calculated to obtain the buildability. The summation of the percentage for each core construction system needs to be equal to one
Eq. 7
Eq. 8 Construction System Sub score =∑(𝐴𝑟𝑒𝑎 𝑜𝑟 𝑉𝑜𝑙𝑢𝑚𝑒 % ∗ 𝐵𝑢𝑖𝑙𝑑𝑎𝑏𝑙𝑖𝑡𝑦 𝐼𝑛𝑑𝑒𝑥 ∗ 𝑁𝑜𝑟𝑚𝑎𝑙𝑖𝑧𝑎𝑡𝑖𝑜𝑛 𝑓𝑎𝑐𝑡𝑜𝑟)
hundred. Each percentage is multiplied by a buildability index, depending on its system type. Then its multiplied to a normalization factor that is obtained by dividing the construction core systems' max score to the highest buildability index. The summation of all the construction core systems' subscores, lead to the total buildability score for the core construction systems in a building.
In table 1 its presented the best and worst buildable possible cases according to the data obtained from the buildability assessment model done in Hong Kong [25]. This table has the parameters needed to calculate the buildability of a building core construction systems. Moreover, emphasizes the results for a hypothetical building that has the best buildable conditions and worst buildable conditions are presented to illustrate the meaning of this factor.
Table 1 Worst and best buildable hypothetical cases. [25]
Best and Worst Buildable Possible Cases [25]
Construction System
Max
Score System Type Buildability
Index
Nomalization Factor
Volume or Area
Percentage Sub- Score Category
23 Precast RC frame 0.239 0.962 100 23.000
23 Structural steel with fireproofing 0.21 0.962 100 20.209
23 In situ RC frame 0.194 0.962 100 18.669
23 In situ load bearing cross-wall 0.181 0.962 100 17.418
23 Steel encased in concrete 0.176 0.962 100 16.937
14 Precast slab with in situ topping 0.27 0.510 100 13.770
14 Steel deck with in situ concrete topping 0.253 0.510 100 12.903
14 In situ RC slab 0.2 0.510 100 10.200
14 Flat slab 0.176 0.510 100 8.976
14 Pre-stressed concrete slab with in situ topping 0.101 0.510 100 5.151
19 Precast concrete wall with pre-installed windows and finishes 0.257 0.739 100 19.000
19 Curtain wall 0.206 0.739 100 15.230
19 In situ concrete wall 0.179 0.739 100 13.234
19 Pre-finished precast concrete formwork with in situ filling 0.179 0.739 100 13.234
19 Concrete block/brick 0.178 0.739 100 13.160
10 Precast concrete roof 0.271 0.369 100 10.000
10 Steel decking with in situ concrete topping 0.271 0.369 100 10.000
10 Steel truss roof with composite decking 0.238 0.369 100 8.782
10 In situ concrete roof 0.22 0.369 100 8.118
3 Dry wall 0.434 0.069 100 2.999
3 Concrete block/brick 0.317 0.069 100 2.190
3 In situ RC wall 0.249 0.069 100 1.720
Best buildable conditions Best buildable conditions Total of 69 68.76
Worst buildable conditions Worst buildable conditions Total of 69 45.08
Roof Building Envelope Slab
Best and Worst Buildable Possible Cases [23]
Structural Frame
Internal Wall
2 Multidisciplinarity
This research refers to multidisciplinarity as the number of direct stakeholders in the design and construction. The stakeholders in concern are the ones involved in the project consultation and work as the project contractor or subcontractor. Form the consultant’s perspective the main roles according to generalized work breakdown structures can be the 3D modeler, cost modeler, sequencing modeler [27]. The subcontractors involved can be categorized from the generalized work break down structure proposed by Makarfi, Kaka, Aouad, and Kagioglou [28]; where its mentioned that ̏ the work sections reflect a type of construction activity requiring certain skills applied to a particular type of resource. It, therefore, relates to various trades and subcontractors who procure the work˝. These work sections includes main work, formwork, concrete production, stone/block/brick production, other element production, responsible for waterproofing and others.
The multidisciplinarity factor score is obtained by the summation of needed to be involved disciplines in design and construction for a specific building design. See equation 9. Table 2 shows a compilation of the possible stakeholders needed for a simple construction case.
𝑀𝑢𝑙𝑡𝑖𝑑𝑖𝑠𝑐𝑖𝑝𝑙𝑖𝑛𝑎𝑟𝑖𝑡𝑦 = ∑ 𝐷𝑖𝑠𝑐𝑖𝑝𝑙𝑖𝑛𝑒𝑠 𝑖𝑛𝑣𝑜𝑙𝑣𝑒𝑑 𝑖𝑛 𝑑𝑒𝑠𝑖𝑔𝑛 𝑎𝑛𝑑 𝑐𝑜𝑛𝑠𝑡𝑟𝑢𝑐𝑡𝑖𝑜𝑛
Eq. 9
Table 2 Multidisciplinarity compilation [27, 28]
Elements Types Work Sections (Subcontractors) [26] Design Sections (Consultants) [25]
Substructure Concrete or precast
Groundwork, Main Work , Formwork , Concrete Production , Substructure Concrete or precast others
Structure,Architecture, Schedule, Cost, Substructure Design Others
Substructure Masonry Groundwork, Stone/block/brick Production
,Substructure Masonry others
Structure,Architecture, Schedule, Cost, Substructure Design Others Substructure Structural/Carcassing
Metal/Timber
Groundwork, Substructure
Structural/Carcassing Metal/Timber others
Structure, Architecture,Schedule, Cost, Substructure Design Others Substructure Waterproofing Groundwork, Substructure Waterproofing
others
Structure, Architecture,Schedule, Cost, Substructure Design Others
Frame Concrete or precast Main work,Formwork,Concrete Production, Frame concrete or precast others
Structure, Architecture, Schedule, Cost, Frame Design Others
Frame Structural/Carcassing
Metal/Timber Frame Structural/Carcassing Metal/Timber others
Structure, Architecture, Schedule, Cost, Frame Design Others Slabs Concrete or precast Main work, Formwork, Concrete Production,
Slab concre or precast others
Structure, Architecture,Schedule, Cost,Slab Design Others Slabs Structural/Carcassing
Metal/Timber Slab Structural/Carcassing Metal/Timber others
Structure, Architecture,Schedule, Cost,Slab Design Others Roof Concrete or Precast Main work,Fromwork,Concrete Production,
Roof concrete or precast others
Structure,Architecture, Schedule, Cost, Roof Desing Other Roof Structural/Carcassing
Metal/Timber Roof Structural/Carcassing Metal/Timber others
Structure,Architecture, Schedule, Cost, Roof Desing Other Roof Cladding/Covering Roof Cladding/Covering others
Structure,Architecture, Schedule, Cost, Roof Desing Other
Stairs Concrete or precast
Concrete or Precast,Main
work,Fromwork,Concrete Production, Stairs others
Structure,Architecture, Schedule, Cost, Stair Design Other Stairs Structural/Carcassing
Metal/Timber
Stairs Structural/Carcassing Metal/Timber others
Structure,Architecture, Schedule, Cost, Stair Design Other External Walls Concrete or precast Main work,Formwork,Concrete Production,
External Walls concrete or precast others
Architecture,Schedule, Cost, External Wall Design Other
External Walls Masonry Main work,stone production, External Walls Masonry others
Architecture,Schedule, Cost, External Wall Design Other
Windows - Windows others
Architecture,Schedule, Cost,Windows Design Other
Internal Walls and
Partitions Masonry Main work,stone production, Internal Walls Masonry others
Architecture,Schedule, Cost, Partition Design Other
Doors - Door others
Architecture,Schedule, Cost, Door Design Others
Wall Finishes -
Wall finishes Other
Architecture,Schedule, Cost, Wall Finishes Design Others
Floor Finishes -
Floor finishes Other
Architecture,Schedule, Cost, Floor Finish Design Others
Ceiling Finishes -
Ceiling finishes Other
Architecture,Schedule, Cost, Ceiling Design Others
Load Bearing Walls Concrete or precast Main work,Formwork,Concrete Production, Bearing Walls concrete or precast others
Structure,Architecture, Schedule, Cost, Load Bearing Wall Design Others
Load Bearing Walls Masonry Main work,stone production, Bearing Walls Masonry others
Structure,Architecture, Schedule, Cost, Load Bearing Wall Design Others Multidisciplinarity Table (Subcontractors and Consultants)
Elements Types Work Sections (Subcontractors) [28] Design Sections (Consultants) [27]
Multidisciplinarity Table (Subcontractors and Consultants)
3 Size
This research refers to the size of the area of all the floors that form a building, as it is presented by other studies [29, 30]. The calculation of this value only includes the total area of the construction core systems that make a floor at each level as input. See equation 10. The area will be expressed in square meters, and it allows a non-normalized comparable value between different building designs.
𝑆𝑖𝑧𝑒 = ∑ 𝐵𝑢𝑖𝑙𝑑𝑖𝑛𝑔 𝐿𝑒𝑣𝑒𝑙 𝐹𝑙𝑜𝑜𝑟 𝐴𝑟𝑒𝑎
The size of the building is obtained from the summation of all the building floor area that is composed of the pointing upward surfaces of the structural frames and slabs instance. See figure 11.
Eq. 10
Figure 11 Elements involved in the floor area calculation.
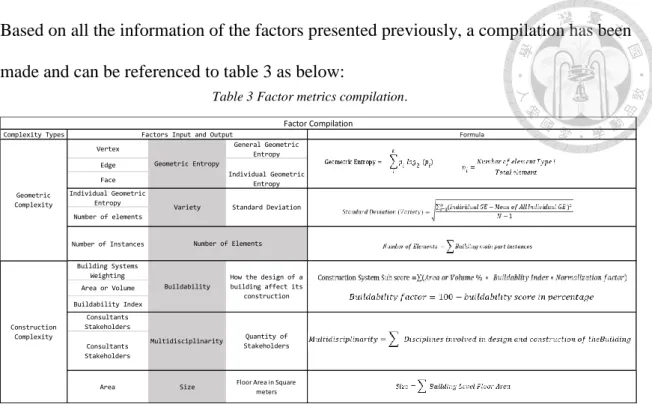
Based on all the information of the factors presented previously, a compilation has been made and can be referenced to table 3 as below:
4.6 Ranking process
Once the score for the geometric and construction complexity factors are obtained, they can be used to compare the buildings or the buildings main parts. This comparison process allows the designer to use the scores not only as individual factors but can also answer questions like, which building has the higher construction complexity or which building main part has the lowest geometric complexity?
The ranking process consists of comparing one-factor value for different buildings or building main part. The factor values and their respective building or building main part names are placed in a table. See table 4a and 4b.
Table 3 Factor metrics compilation.
Table 4a Complexity factor result example 1.
Complexity Types Formula
Vertex General Geometric
Entropy Edge
Face Individual Geometric
Entropy Number of elements
Number of Instances
Building Systems Weighting Area or Volume Buildability Index
Consultants Stakeholders
Consultants Stakeholders
Area Size Floor Area in Square
meters Construction
Complexity
Buildability
How the design of a building affect its
construction
Multidisciplinarity Quantity of Stakeholders Geometric
Complexity
Geometric Entropy
Individual Geometric Entropy
Variety Standard Deviation
Number of Elements Factors Input and Output
Factor Compilation
Factor I Factor II Factor III
Building A 8 1.5 50
Building B 10 2.5 25
Building C 11 3 15
Factor I Factor II Factor III
Building A 10 1 8
Building B 5 3 10
Building C 3 5 10
Buildings Complexity
Buildings Complexity
Table 4b Complexity factor result example 2.
The scores are sorted from the highest to the lowest, where the highest is positioned in the top of a list and the lowest at the bottom of the list. This sorting step is applied to all the factors values for the different buildings. If any factor has the same value, then they are placed in the same position. See table 5a and 5b.
With the sorted values and building names for each factor, then the factor values are removed from the list to obtain a list of the sorted building names. Then a weighting value is applied to the list depending on the number of comparable design that is being ranked. In this case, there are only three buildings and the weightings will be between three and one. The highest value of the weighting is given to the ones in the top of the sorted list while the lowest is given to the ones in the bottom of the sorted list. See table 6a and 6b.
Factor I Factor II Factor III
3 C C C
2 B B B
1 A A A
Factor I Factor II Factor III
3 A C B-C
2 B B A
1 C A
Complexity Weighting
Weighting Complexity
C 11 C 3 C 50
B 10 B 2.5 B 25
A 8 A 1.5 A 15
A 10 C 5 B-C 10
B 5 B 2 A 8
C 3 A 1
Complexity Complexity
Factor I Factor II Factor II
Factor I Factor II Factor II
Table 6b Sorted building names for example 2.
Table 5b Complexity sorted results for example 2.
Table 5a Complexity sorted results for example 1.
Table 6a Sorted building names for example 1.
Building
A = 1 + 1 + 1 = 3 B = 2 + 2 + 2 = 6 C = 3 + 3 + 3 = 9
Building
A = 3 + 1 + 2 = 6 B = 2 + 2 + 3 = 7 C = 1 + 3 + 3 = 7
Weight Summation Weight Summation
Building Rank Complexity value
C 11-3-15 Highest
B 10-2.5-25
A 11-3-15 Lowest
Building Rank Complexity value
C 3-5-10 Highest
B 5-2-10
A 10-1-8 Lowest
Then the weighting values for each building are added to obtain a comparable score that can be used to determine the actual ranking of the buildings or the building main parts. This final value helps to decide which design has the highest or the lowest complexity, while the assigned score for that complexity is the factor values.
If one of the summation results shows the same value as other building and the numbers in the summation are not the same, then the summation of the square values of those weights are used to determine the final score of the ranking. See table 7a and 7b.
Table 7b.1 Example 2 weight summation.
Table 7a.1 Example 1 weight summation. Table 7a.2 Example 1 building ranking result.
Table 7b.2 Example 2 building ranking result.
Building
A = 3*3 + 1*1 + 2*2 = 14 B = 2*2 + 2*2 + 3*3 = 17 C = 1*1 + 3*3 + 3*3 = 19 Weight Summation
![Figure 1 Complexity of projects. [12].](https://thumb-ap.123doks.com/thumbv2/9libinfo/9608339.633925/21.892.235.680.609.972/figure-complexity-of-projects.webp)
![Table 1 Worst and best buildable hypothetical cases. [25]](https://thumb-ap.123doks.com/thumbv2/9libinfo/9608339.633925/39.892.129.767.649.1029/table-worst-best-buildable-hypothetical-cases.webp)
![Table 2 Multidisciplinarity compilation [27, 28]](https://thumb-ap.123doks.com/thumbv2/9libinfo/9608339.633925/41.892.132.792.159.944/table-multidisciplinarity-compilation.webp)