國立臺灣大學公共衛生學院流行病學與預防醫學研究所 碩士論文
Institute of Epidemiology and Preventive Medicine College of Public Health
National Taiwan University Master Thesis
比較 24 位點 MIRU-VNTR 與全基因定序兩種基因分型方法所辨別的 結核病群聚一致性:以醫院為基礎的研究
Comparing the consistency of 24-loci MIRU-VNTR and whole genome sequencing in identifying clusters: a hospital-based study in Taiwan
廖佑荏 Yu-Ren Liao
指導教授: 林先和 博士 Advisor: Hsien-Ho Lin, Sc.D.
中華民國 108 年 7 月
July 2019
致謝
首先,最要感謝林先和教授這兩年的指導,過程中讓我學會邏輯性論述與開始獨立 思考,從原先對自我有些徬徨的狀態,來到今天能夠更清楚表達自我,也正是當初 前來就讀研究所的初衷,與其說林教授是老師,不如說他像一位朋友,總是用一種 嚴謹卻不失幽默的方式帶領著我去思考。而論文方面的資料,要感謝高醫盧柏樑主 任團隊協助分析 MIRU -VNTR 資料、Thomas 團隊幫忙分析全基因定序原始資料,
以及高雄市衛生局願意提供疫調資料做研究所用,沒有他們的幫忙論文也不會這 麼順利產出,也感謝口試當天周如文博士與盧子彬老師所給予基因資訊方面相關 的建議,另外,在這條做研究的路上,我很幸運遇到一群貴人,家人方面,爸爸、
媽媽,以及姊姊們從不過度給我壓力,反而時常關心我的狀態與供我得以完成碩士 學位;實驗室方面,伍倢瑩學姐總能在我研究上卡住時,給我時間討論及適時給我 方向,讓我安心許多;同儕方面,在我初步構想如何分析資料時,葉憲周會在我遇 到技術層面問題時,與我一起討論與修正構想,鍾瑀安陪我練習報告邏輯與剪報建 議,同時要感謝實驗室的夥伴曾柏翔、曹宇翔、楊芷其、劉澄杰一起經歷每次 Lab Meeting 成長,BOT 團施雅雯、陳柏延、潘汶萱、洪嘉倩以及陳怡如給予我心靈上 的安定,讓我情緒一直保持在正向思考,從不會因為挫折失落很久,在這裡學習到 的一切,我都會帶往未來去發揚光大,研究所給我帶來最大的影響,不是自己沒有 變得多厲害,但更能接受和自己思維不同的人所提出的觀點與意見,同時知道我還 有很多值得打拼努力的地方。
摘要
背景
由於結核病透過空氣傳播,以致難以明確釐清傳染源。然而,結核分枝桿菌散置 變異性重複序列及全基因定序兩種基因分型方法能夠區分不同群聚事件,輔以克 服該困境。本研究目的將比較兩種基因分型方法,探討他們在根據在地數據資料 下的一致性。
方法
在 2017 年 3 月至 12 月期間,來自高雄醫學大學體系內四家醫院的 155 位結核病 患者,均透過痰培養確認且具有完整的流行病學數據,包括基因數據。對這些患者 的分離株採用國際標準 24 位點結核分枝桿菌散置變異性重複序列及全基因定序分 型方法進行分析,對於每對病人的分離株,具有相同的結核分枝桿菌散置變異性重 複序列表現譜定義為「結核分枝桿菌散置變異性重複序列群聚」,具有≤12 的單核 苷酸多態性距離則被定義為「全基因定序群聚」。流行病學資訊包括結核病例之間 的已知接觸紀錄,以及每位患者的居住、戶籍和工作地址。我們分析結核分枝桿菌 散置變異性重複序列和全基因定序兩者之間群聚的一致性,同時檢驗它們判別的 群聚與流行病學數據之間是否具有相關性,若接觸調查支持其關係,抑或是病人間 地理距離相距 5 公里內,均判別為有流病關聯性。
結果
隨著結核分枝桿菌散置變異性重複序列上基因位點差異數量增加,單核苷酸多態 性距離也增加。在具有相同 24 位點結核分枝桿菌散置變異性重複序列的 88 對患 者中,只有 8 對(9.1%)的單核苷酸多態性距離≤12。另外,在單核苷酸多態性距 離≤12 的 23 對患者中,有 15 對(65.2%)在結核分枝桿菌散置變異性重複序列模 式中至少有一個位點的差異。 23 對全基因定序有關的群聚中有 13 對(57%)具 有地理相關性,而 88 對(29.5%)結核分枝桿菌散置變異性重複序列有關的群聚,
只有 26 對是地理相關性。值得注意的是,我們的全基因定序分析顯示了有四個潛
在的基因型群聚存在,但其中僅有一個是通過常規接觸調查確定。
結論
在我們的研究人群中,24 位點結核分枝桿菌散置變異性重複序列和全基因定序分 析的分析結果顯示兩工具分型存在不一致的情形,又以結核分枝桿菌散置變異性 重複序列的群聚不一致情況最嚴重。透過接觸調查和地理空間資訊結果表現出全 基因定序的群聚比結核分枝桿菌散置變異性重複序列群聚更具有流病相關性。
關鍵詞: 結核病、基因分型、全基因定序、結核分枝桿菌散置變異性重複序列
Abstract
Introduction
Due to Tuberculosis (TB) transmissible characteristic of airborne, it is difficult to clarify
the source of infection. However, whole genome sequencing (WGS) and mycobacterial
interspersed repetitive unit-variable number of tandem repeat (MIRU-VTNR) of genotyping techniques can identify separate clusters as different transmission events to overcome this obstacle. The purpose of this study is to compare two genotyping methods
head-to-head, and to explore the consistency of them based on local epidemiological data.
Methods
Between March and December 2017, TB patients (n = 155) from four hospitals of the Kaohsiung Medical University system were confirmed by sputum culture and had complete epidemiological data, including genetic data. The isolates of these patients were employed both international standard 24-loci MIRU-VNTR and WGS. For each pair of patients, the same MIRU-VNTR pattern was defined as "MIRU-VNTR cluster", and the single nucleotide polymorphism (SNP) distance of ≤ 12 was defined as "WGS cluster".
Epidemiological information included known contact investigation between TB cases, and the location of patients such as permanent, residential, and work addresses. We analyzed the concordance of clusters between MIRU-VNTR and WGS, and examined whether there was a correlation between genetic clusters and epidemiological data. If contact investigation had shown to support the relationship between the pair, or the geographical distance between patients within 5 kilometer (km), the pair were identified as having epidemiological correlation.
Results
The SNP distance increased as the number of discrepant MIRU loci increased. Among the 88 pairs of patients with identical 24-MIRU pattern, only eight (9.1%) pairs had a SNP distance of ≤12. On the other hand, among the 23 pairs of patients with SNP ≤12, 15 pairs (65.2%) had at least one loci difference in MIRU pattern. 13 of 23 (57%) WGS- linked pairs had geographical correlation, while only 26 of 88 (29.5%) MIRU linked pairs were geographical correlation. Of note, our WGS analysis revealed four potential genotypic clusters, but only one of them had been identified by conventional contact investigation.
Conclusion
In our study population, the outcomes of 24-loci MIRU-VNTR and WGS had indicated that there was high discordant situation between two genotyping tools, especially for MIRU-VNTR clusters. Through contact investigation and spatial information, WGS clusters were more epidemiological correlation than MIRU-VNTR.
Key words: Tuberculosis, genotyping, whole genome sequencing, mycobacterial
interspersed repetitive-unit-variable-number tandem-repeat
Table of Contents
致謝 ... i
摘要 ... ii
Abstract ... iv
Table of Contents ... vii
List of Figures ... ix
List of Tables ... x
Chapter 1: Introduction ... 1
Chapter 2: Materials and methods ... 4
2.1. Study design and population ... 4
2.2. Case data ... 4
2.3.1. Selection of MIRU-VNTR loci ... 5
2.3.2. Calculation of Hunter-Gaston discriminatory index (HGDI) from loci ... 6
2.3.3. The process of PCR in this study ... 6
2.3.4. Definition of cluster by MIRU-VNTR ... 7
2.4.1. Bioinformatics analysis of WGS ... 7
2.4.2. Definition of cluster by WGS ... 8
2.5.1. Definition of epidemiological correlation ... 8
2.5.2. Calculating distance and mapping of activity locations from patients ... 9
2.6. Statistical Analysis ... 10
Chapter 3: Results ... 11
3.1. Baseline characteristic of study population ... 11
3.2. Single nucleotide polymorphism (SNP) network ... 11
3.3. MIRU-VNTR network ... 12
3.4. The relationship between outcome of MIRU-VNTR and WGS ... 12
3.5. The epidemiological correlation of clusters from WGS and MIRU-VNTR ... 13
Chapter 4: Discussion ... 15
4.1. Summary ... 15
4.2. Discriminatory power of MIRU-VNTR and WGS ... 15
4.3. Effect of lineage on the correlation between MIRU-VNTR and WGS results 16 4.4. Consistency of result by two genotyping methods ... 17
4.5. Definition problems of gold standard and the threshold of SNPs ... 19
4.6. Strengths and limitations ... 19
References ... 23
Appendix ... 26
Supplement ... 39
List of Figures
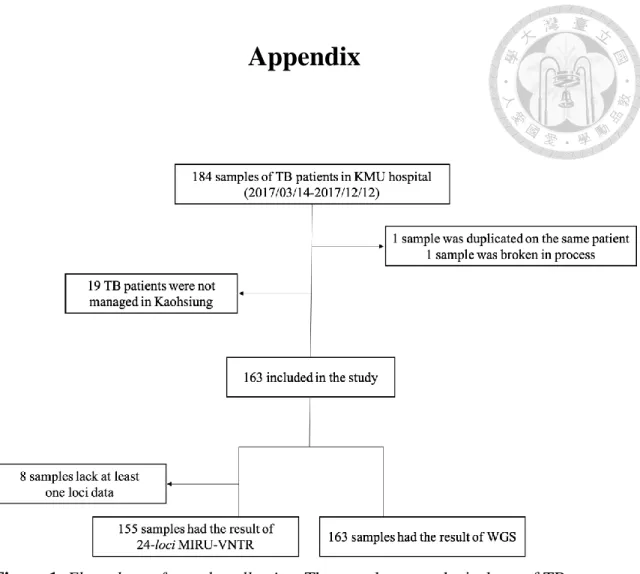
Figure 1. Flow chart of sample collection ... 25
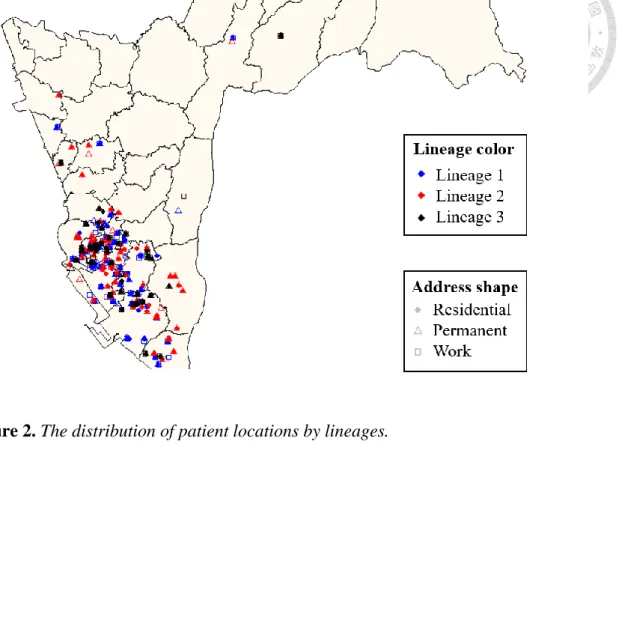
Figure 2. The distribution of patient locations by lineages ... 28
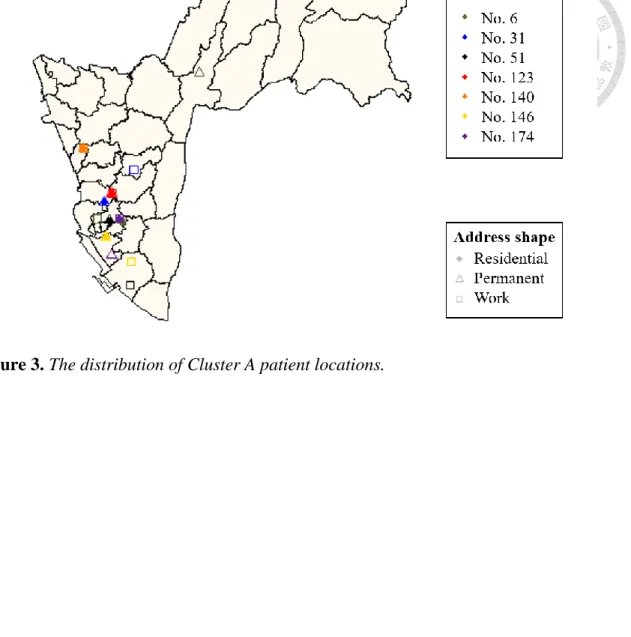
Figure 3. The distribution of Cluster A patient locations ... 29
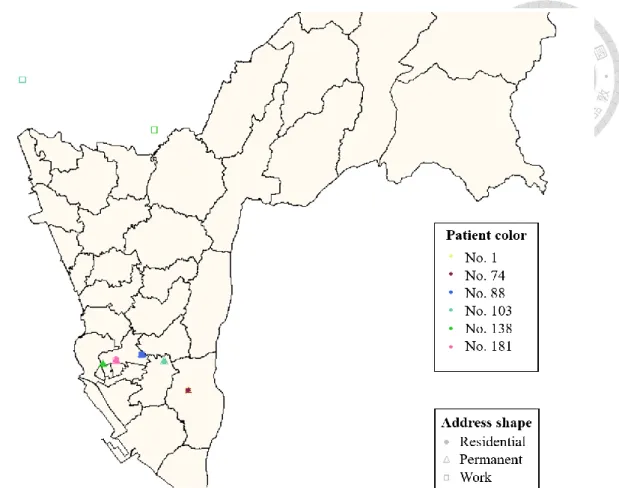
Figure 4. The distribution of Cluster B-D patient locations ... 30
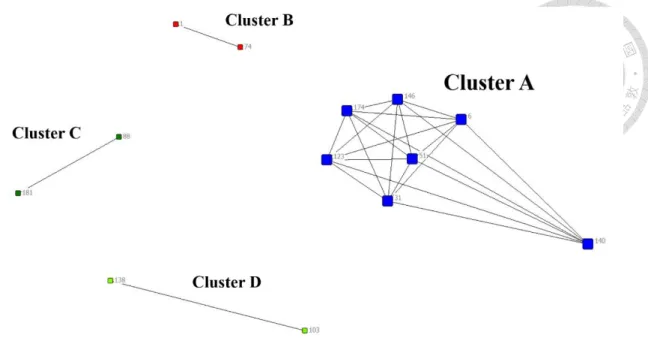
Figure 5. Network of WGS-clustered cases ... 31
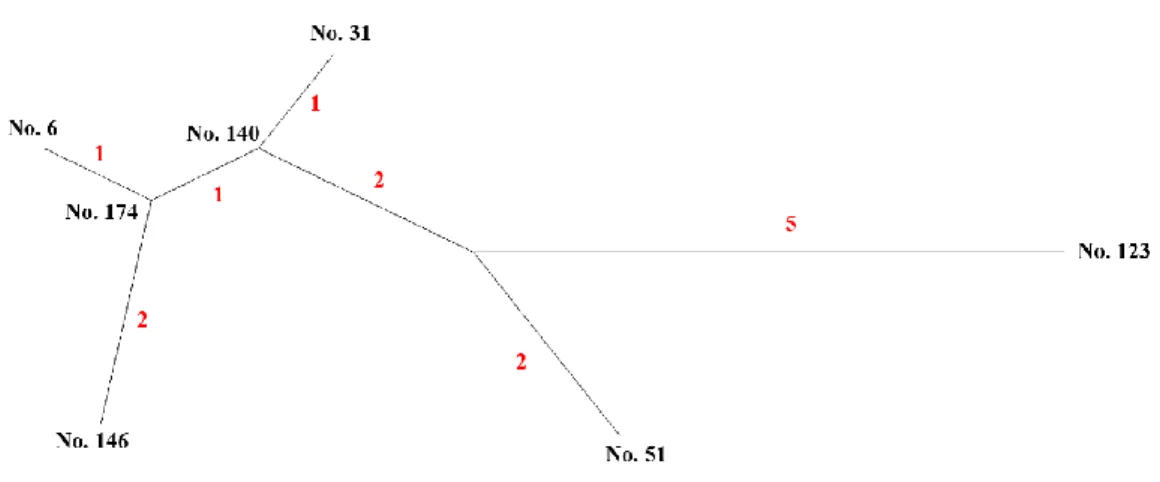
Figure 6. Neighbor joining tree of Cluster A ... 32
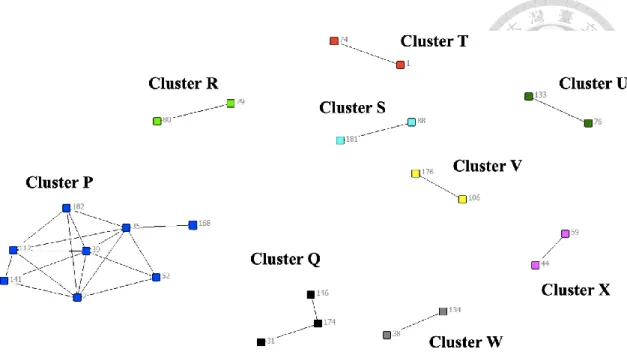
Figure 7. Network of MIRU-VNTR-clustered cases with geographical correlation .. 33
Figure 8. Neighbor joining tree of Cluster P ... 34
Figure 9. The relationship of variation between 24-loci MIRU-VNTR and WGS .... 35
Figure 10. The relationship of variation between 24-loci MIRU-VNTR and WGS (under 50 SNPs) ... 36
Figure 11. Venn diagram of 24-loci MIRU-VNTR and WGS typing of 155 MTB isolates from Kaohsiung and geographical correlation ... 37
List of Tables
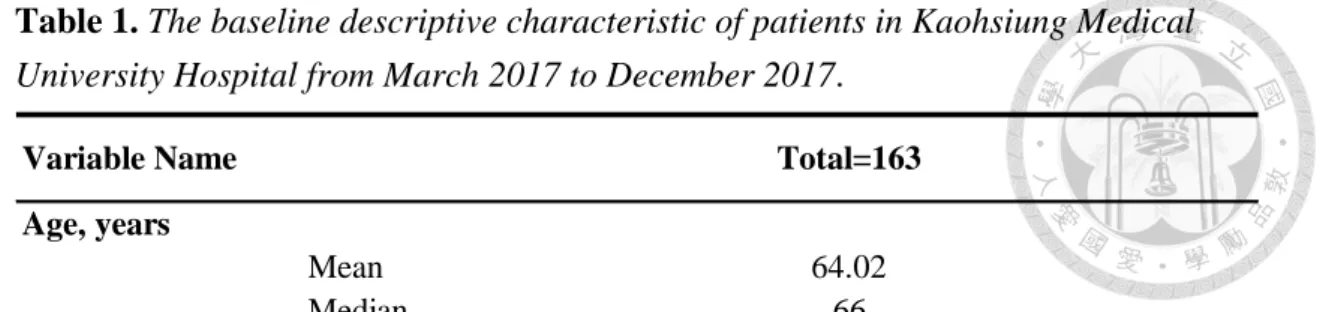
Table 1. The baseline descriptive characteristic of patients in Kaohsiung Medical
University hospital from March 2017 to December 2017 ... 26
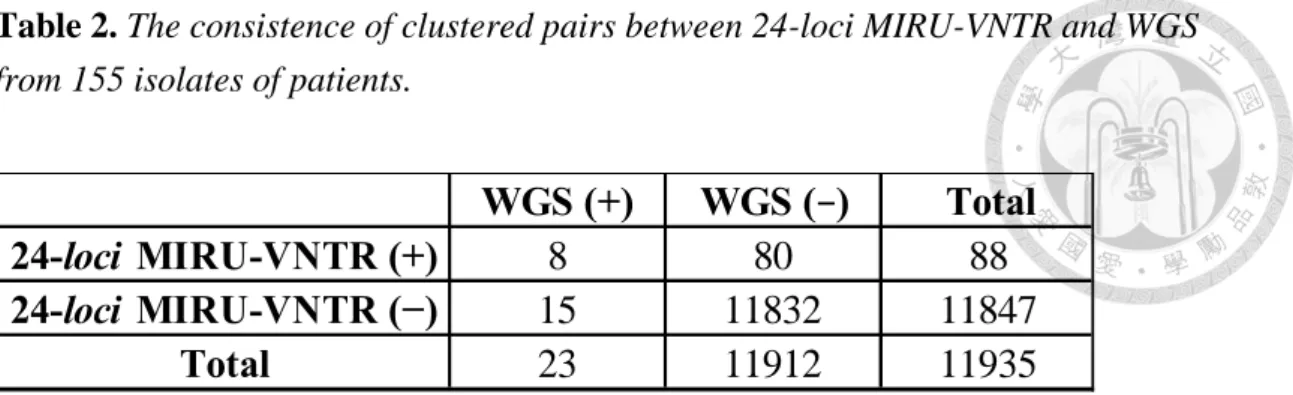
Table 2. The consistence of clustered pairs between 24-loci MIRU-VNTR and WGS from 155 isolates of patient ... 27
Chapter 1: Introduction
Tuberculosis (TB) is an airborne disease caused by Mycobacterium Tuberculosis
(MTB) infection, and remains a one of main public health issues in Taiwan with 9,759 new cases in 2017. Because of its transmission characteristic, it is able to infect and spread
without directly contact. In addition, TB patients have potentially long latency periods. It all lead the public health department trace the source of transmission more difficultly.
Although we are not easy to identify the actual transmission source of TB, we can distinguish between different transmission events (or called clusters) by some molecular genotyping tools first. Genotyping methods have been used to define transmission clusters and detect potential outbreak investigations during recent decades. Thus, it can assist the epidemiological surveillance of TB.
The 24-loci Mycobacterial Interspersed Repetitive Unit-Variable Number of Tandem Repeat (MIRU-VNTR), which is the most common fingerprinting method in studies at present [1], is dependent on copy numbers of a sequence in independently selected set of 24 highly polymorphic regions as surrogate marker in the genome [2]. After typing the isolates by MIRU-VNTR, their results are converted into a numerical code to save digital format, which enables easy to compare results among different laboratories. Moreover, sharing identical patterns isolates are categorized as the same genotyped clusters [3]. In
addition, some studies conducting in different countries have indicated that detecting the clusters based on MIRU-VNTR may better understand the potential transmission dynamics of MTB strains [4-6]. However, multiple other studies have showed that a few of limitations about the standard 24-loci MIRU-VNTR. Some studies have shown that lineage of MTB is a crucial determinant of MIRU-VNTR performance, not all lineages being distinguished well [7-9]. Besides that, some studies have demonstrated that this genotyping method might overestimate the transmission clusters, especially for certain lineages of TB in low incidence areas [10, 11]. In order to address the limitations of 24- loci MIRU-VNTR, the new genotyping methods are expected.
In the recent years, whole genome sequencing (WGS) becomes a more popular and potentially alternative genotyping method. Instead of using the specific loci, it classifies the TB genotyped clusters by the single nucleotide polymorphisms (SNPs), and comparing the results to the sequence of the reference strain, H37Rv. Next, the researchers calculate the genetic distance between SNPs (or called SNPs distance) in the genome between two strains of the samples. If two isolates are less than a defined threshold number of SNPs, they are defined as the same genotyped cluster by WGS.
Moreover, some recent evidences have shown that WGS has high discriminatory power, even better resolution than MIRU-VNTR [10, 12-15]. However, the cut-off value of SNPs
in different literature have not a certain criterion to defined TB transmission clusters between pairs (two patients) [16]. Although some studies have shown that WGS can divide the MIRU-VNTR results into smaller clusters, it is not always exist epidemiological evidence to support it [17]. In addition, there has been a lack of studies to compare the MIRU-VNTR and whole genome sequencing (WGS) unconditionally (head-to-head), and further understand their association with epidemiological information.
Therefore, we aimed to compare two genotyping methods 24-loci MIRU-VNTR and whole genome sequencing head to head based on actual epidemiological data.
Furthermore, we explored the concordance and discordance of result to understand the strengths and limitations of two tools.
Chapter 2: Materials and Methods
2.1. Study design and population
This was a retrospective study. The population of case was patients with culture- confirmed tuberculosis during March to December 2017 from four hospitals in Kaohsiung and having epidemiological information available were included (n=163) (Figure 1).
2.2. Case data
Contact investigation and demographic data of participants were obtained from Kaohsiung city government department of health. The case data included the following variables: age, sex, nationality (Taiwanese or foreign), management area, marital status (single, married, divorced, or widowed), activity addresses (permanent, residential, and work addresses). The 163 MTB cultures from these cases were conducted 28-loci MIRU- VNTR genotyping at Kaohsiung Medical University Hospital System Laboratory (KMUHSL) from the collaborator professor Po-Liang Lu, and they provided us the MIRU-VNTR pattern results of isolates. Besides, the samples from these 163 cases were also sent to the team of professor Thomas Ioerger for analysis of whole genome sequencing, and we got the FASTA format file from foreign laboratory to detect SNPs
between cases. Finally, we had genetic and epidemiological information of patients in this study.
2.3.1. Selection of MIRU-VNTR loci
We adopted the set of 24-loci in our main analysis. However, there were 155 of 163 samples of cases having complete the selected 24 loci information (Figure 1). Thus, we conducted 24-loci MIRU-VNTR identifying the cluster from these 155 samples. In addition, although many studied would use the international standard 24-loci to analyze [2], there is no golden standard of selecting specific loci to classify clusters to date.
Therefore, we would conduct sensitivity analysis in 9, 10, and 28 loci sets of MIRU- VNTR to classify the genotyped cluster in this study.
First of all, combination of 9 loci was recommended by Qian Gao et.al. research in China, and it showed high discriminatory power to distinguish Beijing strains and non- Beijing strains [18]. Secondly, we adopted 10 loci which was the best typing result according to the report from Taiwan Centers for Disease Control (TCDC) in 2014 [19].
They recommended that it was better to perform with another typing method spacer oligonucleotide typing (spoligotyping) together, but we still try to understand the effect of using only these 10-loci MIRU-VNTR method. Moreover, the last one we selected all of 28-loci which were analyzed in KMUHS laboratory to classify the cluster.
2.3.2. Calculation of Hunter-Gaston discriminatory index (HGDI) from loci
The Hunter-Gaston discriminatory index (HGDI) was used to evaluate the discriminatory power of the selected loci of MIRU-VNTR in study, and its value range between 0 and 1. This index is given by the following equation [19, 20]:
HGDI = 1-∑𝑋𝚤2[ n/(n-1)]
where 𝑋𝚤 is the probability of a single isolate at random belongs to the 𝚤 th cluster group, n is the number of the isolates. The lower value of HGDI shows that the sample isolates are more difficult distinguished. In contrast, the higher value of HGDI means all strains are more distinguished well. We calculated it to understand the performance of classified cluster from our selected sets of loci. Based on the study of Sola et al.[21], their respective HGDI score was that the discriminatory powers were classified as high (HGDI>0.6), moderate (0.6≥HGDI≥0.3), or low (HGDI<0.3) in our study.
2.3.3. The process of PCR in this study
We conducted genotyping using PCR based on 24-loci MIRU-VNTR [2]. First, collaborate laboratory conducted denaturation of DNA. Reaction temperature was increased to 94 °C for 15 min to ensure that all double-stranded DNA molecules were separated into single strands for amplification. Secondly, they conducted annealing. The
temperature was lowered to 59 °C to promote primer binding to the template. Thirdly, extension, the temperature was increased to 72 °C to allow the hybridized primers to be extended. Finally, it finished after cycling the three steps for 22-25 times.
2.3.4. Definition of cluster by MIRU-VNTR
We successfully MIRU-VNTR genotyped 95.1% (155/163) of isolates in this study.
After typing the isolates by MIRU-VNTR, the cluster was defined that the digital code of MIRU-VNTR pattern of isolates from two or more strains were identical. They sharing identical patterns were categorized as the same genotyped clusters [3].
2.4.1. Bioinformatics analysis of WGS
In brief, our samples were sequenced using short read technology, HiSeq X System (Illumina). After using BWA (version 0.7.12) to map reads to the H37Rv reference genome (GenBank accession number NC_000962.2), detection of genomic variants SNPs were identified as sites with a majority of nucleotides differing from the reference among reads covering each site. Small indels (1-3bp) were identified from the .sam files generated by BWA, and larger indels (up to 20kb) were identified by drops in coverage below 10 reads, and edits to the genome sequence were generated by building a local contig of overlapping reads that spans the site. Using MUMMER (version 3.20) to align
genome sequences, SNPs were extracted according to the following criteria: coverage ≥ 10x (covered by at least 10 reads) with purity ≥ 70% (conversion to non-reference
nucleotide). To filter out potential false-positive SNPs attributable to mapping errors, we omitted the variants detected in proline-proline-glutamic acid (PPE), proline-glutamic acid_polymorphic guanine-cytosine-rich sequence (PE_PGRS) genes, and repetitive regions [22], because of sequences in these regions not unique.
2.4.2. Definition of cluster by WGS
To date there was no uniform standard for cut-off values of SNPs, and different country studies had applied various cut-offs. However, some recent studies using WGS for detecting TB transmission employed isolates with 12 SNPs difference as the maximum threshold related to recent transmission chains [23-25], and this concept was early proposed by Walker et al [13]. In our study, we employed 12 SNPs cut-offs for main definition genotyped cluster of WGS, but other thresholds of SNP were considered in sensitivity analysis.
2.5.1. Definition of epidemiological correlation
Kaohsiung city government department of health authorized to give us the de- identified TB patients data about epidemiological information on TB contact
investigation. However, epidemiological information of cases was difficult to obtain completely. Thus, we defined as two definitions as epidemiological correlation in our study. One was epidemiological linking. If any case was named by other patients before they became patients, they had epidemiological linking. The other one was geographical correlation, and it was based on the activity addresses of cases recorded in the data. We defined the threshold of distance was 5 km, thus it meant if the distance difference of two cases locations under 5 km, they had geographical correlation. However, there was no evidence to support how far was the distance of TB transmission, because it was difficult to know the all activity place of all patients. Therefore, we also conducted sensitivity analyses: the threshold of distance as 1 and 3 km as geographical correlation to understand how different distance of definition affected clusters of two genotyping methods with geographical relationship.
2.5.2. Calculating distance and mapping of activity locations from patients
We adopted Euclidean distance as our distance form, and this is the common way to understand distance calculation. It is given by the following equation:
𝑑(𝑥, 𝑦) = √∑(𝑥𝑖 − 𝑦𝑖)2
𝑛
𝑖=1
where 𝑥 and 𝑦 are the different patient locations. Distance difference were calculated by dist function in R package “stats”. Moreover, we map patient's activity locations in
order to understand their activity distribution. First, we geocoded the all activity addresses of each TB patient by Taiwan Geospatial One-Stop Portal (TGOS), and drew locations on map with R 3.4.2 using GIS package.
2.6. Statistical Analysis
All analyses used the statistical software R 3.4.1 for Windows. Using chi-square compared the categorical variables, and conduct Fisher's exact test when the cell counts were below 5. P-value < 0.05 was defined statistically significant.
Chapter 3: Results
3.1. Baseline characteristic of study population
There were 163 patients in our study population. The majority was men, married, Taiwanese, and strain belonging to lineage 2 (Beijing). And over half of the patients were elder (52.8%) (mean age, 64 years) (Table 1).
3.2. Single nucleotide polymorphism (SNP) network
The activity locations of cases in largest genetic cluster (Cluster A) and other small clusters (Cluster B-D) were shown on Figure 3 and Figure 4. Figure 5 was the network of WGS-clustered cases by using pairwise SNP distance ≤12. There were four clusters identified by WGS. Cluster A was the largest cluster including seven cases, and the other three small clusters (Cluster B-D) involved only two cases. Besides, the isolates of cases in Cluster A were separated by 1-10 SNPs in neighbor joining tree (Figure 6), and the neighbor joining method was based on genetic distances. We found that one (Cluster D) of four clusters had no geographical correlation because the location of this pair was over 5 km, and the distance of No.140 in Cluster A was over 5 km with the other cases.
3.3. MIRU-VNTR network
We have 155 of 163 patients with complete 24-loci MIRU-VNTR data, because some isolates of patients lack at least one loci in our study population. In MIRU-VNTR analysis, 39 (25.2%) of the MTB isolates had identical 24 loci pattern, and were grouped into 11 clusters. Two clusters (Cluster E, Cluster F) comprised 11 and 6 isolates respectively; the other clusters were smaller (Cluster G: 4 isolates, Cluster H-I: 3 isolates, and Cluster J-O: 2 isolates) (Figure S7). In addition, Figure 7 was the network of MIRU- VNTR clusters with geographical correlation. There were nine clusters having geographical linking. Cluster P was the largest cluster including eight cases, and it was a part of Cluster E. The second largest was Cluster Q, and it was a part of Cluster G. And the other small clusters involved only two cases (Cluster R-X). In addition, the isolates of cases in the largest Cluster P were separated by 14-143 SNPs (Figure 8), and they were not included as a cluster by WGS.
3.4. The relationship between outcome of MIRU-VNTR and WGS
The genetic distance of SNP from WGS outcome increased as the number of discrepant MIRU loci increased (Figure 9). Among the 88 pairs of cases with identical 24-loci MIRU-VNTR pattern, only eight (9.1%) pairs had a SNP distance of ≤12 (Table 2). On the other hand, among the 23 pairs of cases with SNP ≤12, 15 pairs (65.2%) had
at least one loci difference in MIRU pattern. Importantly, 80 of 88 (91%) pairs of MIRU- VNTR clusters were rejected by WGS, and 15 of 23 (65%) pairs of WGS clusters were rejected by MIRU. If we calculate the discordance of two tools by number of cases, 31 of 39 (79.5%) MIRU-VNTR clustered cases were rejected by WGS clustered cases, and 3 of 11 (27.3%) WGS clustered cases had different MIRU-VNTR pattern. Comparing to using number of pairs, the proportion of discordance in two tools all reduced if using number of cases. However, the proportion of discordance in MIRU-VNTR clustered cases was still high (Table S6).
3.5. The epidemiological correlation of clusters from WGS and MIRU-VNTR
WGS analysis revealed four potential genotypic clusters, but only one (Cluster B) of them had been identified by conventional contact investigation. Among 23 WGS- linked pairs, 13 (57%) had geographical correlation (pair distance within 5 km) (Figure 11). The distance of the pair in Cluster D was over 5 km. And No.140 which the only one case was not geographical correlation with the other cases in Cluster A. As for MIRU- VNTR, 11 clusters with identical 24-loci MIRU-VNTR pattern, the only 26 of 88 (29.5%) MIRU-linked pairs were geographically linked. Besides, the pair (No.1 and No.74) was the only recorded by contact investigation, and was detected by two genotyping methods simultaneously. The epidemiological data had shown that No.1 was the index case of
No.74, and they were a couple. It was identified as a household transmission event based on epidemiological linking. In Cluster D, No.103 and No.138 were a salesman and a staff of gas station respectively, and the place of work were all located in Tainan. It meant their activity distance was far than the other cases in Cluster D. In Cluster A, No.31 was a driver, and he had family history of his father. No.51 was a factory staff, and contacted over thirty people every work day. Besides, No.6 was a case working at internet café, and contacted over ten people every work day in contact investigation. In Cluster A, No. 6 is the only case that had been found by a known contact investigation in another transmission event.
Chapter 4: Discussion
4.1. Summary
Our result had showed that substantial high proportion of inconsistency between 24- loci MIRU-VNTR and WGS in this study. Of 80 (90.9%) pairs had a SNP distance of
≥12 among the 88 pairs of cases with identical 24-loci MIRU-VNTR pattern. Of 15 pairs (65.2%) had at least one loci difference in MIRU pattern among the 23 pairs of cases with SNP ≤12. Furthermore, our study highlighted another finding that WGS clusters had higher geographical correlation (pair distance ≤5km) than 24-loci MIRU-VNTR clusters, no matter what threshold of SNPs we defined.
4.2. Discriminatory power of MIRU-VNTR and WGS
In addition, most of previous studies had showed that WGS divided MIRU-VNTR cluster into several sub-clusters [12, 26]. However, there was the opposite situation in our study. Cluster Q was one of MIRU-VNTR clusters with geographical correlation, but it was a part of Cluster A identified by WGS. Due to this result, it had potentially indicated that the collected samples of this study were not enough to observe whole clusters of transmission, and many infected patients might have not found yet. Of note, the only one pair of patients (a couple) with confirmed epidemiological links, the genetic distance was 3 SNPs. Epidemiological linking based on contact tracing is still vital and helpful to
identify putative transmission events between individual TB cases in clusters, even it was not too objective and difficult to conduct thoroughly.
4.3. Effect of lineage on the correlation between MIRU-VNTR and WGS results
Some studies had found that the performance of MIRU-VNTR varies markedly by lineage when they used MIRU-VNTR typing to match WGS [21]. In our study, the isolates of MIRU-VNTR and WGS clusters were mainly belonged to lineage 1and lineage 2, respectively. In order to estimate the effect of lineage, we stratified by lineages to know how lineage affected the correlation of MIRU-VNTR and WGS. Interestingly, our result demonstrated that the isolates of lineage 4 made MIRU-VNTR pattern the best matching with the performance of WGS among three lineages (lineage 1, lineage 2, lineage 4) (Figure S4-S6), and it was agreement with the study in Hawaii [15], which was indicated that MIRU-VNTR had poor ability to resolve lineage 1 and 2 clusters relative to lineage 4. There was no pair of samples with identical MIRU-VNTR profile in our data of lineage 4 (Figure S6), and the group of the pairs with one loci difference was only one pair with the genetic distance highly over 12 SNPs. On the contrary, for both lineage 1 and lineage 2 (Figure S4, S5), isolates with identical 24 loci copy number had wide range of SNP, and were all over the threshold of 12. Importantly, it had showed that lineage would affect the performance of MIRU-VNTR, the same as the previous studies [7, 8, 27, 28].
4.4. Consistency of result by two genotyping methods
Our result had shown that high discordance of genetic clusters identified by 24-loci MIRU-VNTR and WGS. For pairs of isolates differing by from zero to two loci of MIRU- VNTR, the distributions of SNP were all similar. Besides, the SNP values of pairs were almost all highly over twelve in the group of 0 loci difference (Figure 9), and less than 10 pairs under the threshold of 12 SNPs (Figure 10). It had shown that MIRU-VNTR clusters isolates with relatively large genetic distances of SNPs. And this part had been much discussion of these in previous studies. However, in our study, we especially pointed out that some of the isolates were WGS-clustered but not MIRU-VNTR clustered. This was seldom mentioned in previous studies due to selected samples and WGS seen as gold standard. There are some possible explanations for this discordance.
First, there might be some biased results from the performance of MIRU-VNTR laboratory procedure. The determination of MIRU-VNTR pattern was based on the copy number of the specific loci estimation, then transform the digital code to compare with each other. The accuracy of estimation was important to result of identified clusters.
Therefore, we checked the outcome of gel electrophoresis conducted by KMU laboratory.
We found out that the discordance of MIRU-VNTR pattern in WGS-clusters were mainly from 3 loci (Mtub04, Mtub21, MIRU26) identifying on three cases (No.6, No.51, No.123).
Especially for Mtub21 locus, the locus was belonging to low power to discriminate
samples in this study (Table S7). And the bands of No.51 and No.123 showed that DNA fragments were near 300 base pairs (bp) by DNA marker, but they were recognized as not 300 bp originally. However, the band of the other cases in Cluster A were recognized as 300 bp. Thus, we tried to relax the criterion of Mtub21 locus identifying these three cases as the same as the other cases of Cluster A, and observed if it would change the result of inference direction. Although the proportion of discordance reduced (MIRU:
87%, WGS: 47.8%), but the discordance still existed. And WGS was still higher geographical correlation than MIRU-VNTR.
Secondly, except for MIRU-VNTR problems, several technological limitations of WGS also existed, such as short read, reading repetitive regions error, and basic error rate in NGS. Some length of fragments for MIRU-VNTR locus were longer than 1000 bp, but several studies showed that short reads in next generation sequencing would affect the accuracy of the genome assembly and quality would decrease [29], particularly for the repetitive regions. Due to false variant calls from wrong mapping in some regions, these pipelines of WGS often exclude approximately 10% of the genome [30]. Besides, although we could get the information that the average depth of WGS technology was more than 300 times (329X coverage) from the collaborate team, we could not know how many times actual reads on the location of calling SNPs by using FASTA format file,
however, this was a vital information. These reasons all might cause the outcome difference between MIRU-VNTR and WGS. Another possible explanation for discordance between two tools, WGS ruled out the selected loci of MIRU-VNTR on pipeline, or those few loci of difference were just the variation positions on WGS sites and their total number of SNP were under twelve. In addition, any instrument of NGS (including applying to WGS) still had error in process basically, and it was mentioned range 0.1-2.6% per base in published error rates on Illumina sequencers; therefore, it should evaluate error rates to improve the quality and analysis of NGS data [31]. The above problems were shown that discordant results between MIRU and WGS will need to be studied further.
4.5. Definition problems of gold standard and the threshold of SNPs
Many studies set either contact investigation or WGS as gold standard. However, we tried to compare MIRU-VNTR and WGS head-to-head, but the information of contact investigation in our study was not enough to validate. Thus, we did not set any gold standard, just observed the consistency of clusters defined by two methods. For this reason, we could not conclude which method was better to detect the transmissible clusters. In addition, we could understand that the situation of strain mutation between cases in this study from the distribution of the number of pairs of SNPs (Figure S8) and
how many pairs were detected by two methods when we set different SNP cut-off (Table S8). However, there was no strong evidence to support whether 12 SNPs as the cut-offs was suitable.
4.6. Strengths and limitations
This study is the first to perform head-to-head comparison between MIRU-VNTR and WGS quantitatively using hospital-based data in Taiwan. Most of the studies perform the analysis of MIRU-VNTR first, then they use WGS to analyze the result of MIRU- VNTR [10, 26]. In these studies, they reported that WGS had higher resolution by using some validation data, and it was helpful to exclude transmission events identified by MIRU-VNTR. Nevertheless, it is seldom to analyze all samples by two genotyped methods simultaneously in one study probably due to limited resource and cost. As a result, the result of clusters always lacks the part which is identified by WGS, but MIRU considers not as the cluster. Besides, the addresses of activity places in our study were not only residential, but also more places were recorded, such as work. The more detailed information of activity places is recorded, the more we are possible to understand the potential transmission location.
There were still a few potential limitations of this study. Our population was collected from the specific hospital system, not all TB patients of Kaohsiung were included in 2017,
which may cause selection bias. Besides, the study period was only nearly one year, it was difficult to understand complete transmission in Kaohsiung. These problems might lead to an underestimation of clusters of TB transmission. However, we planned to conduct a population-based study to collect all cases from all hospitals in Kaohsiung for over one year in the future. Our epidemiological data based on contact investigation was difficult to record all the epidemiological links. Hence, epidemiological links were possibly missed some parts of links between cases, and it also had the problem of recall bias when interviewing patients. Several limitations of WGS technologies and analysis tools were challenged that the workflows had various criteria, and lacked standardization and validation. There was no international standard for the cut-off of SNP, although many studies use the number of SNPs to define WGS cluster. The SNPs cut-off as adequate cluster definition still needed to take some factors into account, such as the TB incidence, the characteristic and mutation rates of MTB in this area, the duration of transmission, and so on.
In conclusion, with decreasing costs of next-generation sequencing (NGS) technologies, WGS will become an essential tool in routine use of identifying clusters.
Moreover, our results also support that the cases of WGS clusters match more with epidemiological information than clusters by MIRU-VNTR. Although WGS has potential
ability to replace routine typing MIRU-VNTR [13], some challenges remain such as how to compare among different studies when WGS applying, and how to better define clusters of recent or reactive TB transmission by SNP thresholds in different conditionally area. Besides, workflow of WGS has various criteria, and lacks standardization and validation. It should be validated and established an algorithm as general standard for meeting public health needs in the future.
References
1. Thain, N., et al., Towards better prediction of Mycobacterium tuberculosis lineages from MIRU-VNTR data. Infection, Genetics and Evolution, 2018.
2. Supply, P., et al., Proposal for Standardization of Optimized Mycobacterial Interspersed Repetitive Unit-Variable-Number Tandem Repeat Typing of Mycobacterium tuberculosis. 2006. 44(12): p. 4498-4510.
3. Gurjav, U., et al., Temporal dynamics of Mycobacterium tuberculosis genotypes in New South Wales, Australia. BMC Infect Dis, 2014. 14: p. 455.
4. Zamani, S., et al., MIRU-VNTR analysis of the Mycobacterium tuberculosis isolates from three provinces of Iran. Scand J Infect Dis, 2013. 45(2): p. 124-30.
5. Shamputa, I.C., et al., Genetic diversity of Mycobacterium tuberculosis isolates from a tertiary care tuberculosis hospital in South Korea. Journal of clinical microbiology, 2010. 48(2): p. 387-394.
6. Perez Del Molino Bernal, I.C., et al., Genomic Diversity of Mycobacterium tuberculosis Complex Strains in Cantabria (Spain), a Moderate TB Incidence Setting. PLoS One, 2016. 11(6): p. e0157266.
7. Wyllie, D.H., et al., A Quantitative Evaluation of MIRU-VNTR Typing Against Whole-Genome Sequencing for Identifying Mycobacterium tuberculosis
Transmission: A Prospective Observational Cohort Study. EBioMedicine, 2018.
34: p. 122-130.
8. Comas, I., et al., Genotyping of Genetically Monomorphic Bacteria: DNA Sequencing in Mycobacterium tuberculosis Highlights the Limitations of Current Methodologies. PLOS ONE, 2009. 4(11): p. e7815.
9. Luo, T., et al., Combination of Single Nucleotide Polymorphism and Variable- Number Tandem Repeats for Genotyping a Homogenous Population of Mycobacterium tuberculosis Beijing Strains in China. Journal of Clinical Microbiology, 2012. 50(3): p. 633.
10. Stucki, D., et al., Standard Genotyping Overestimates Transmission of
Mycobacterium tuberculosis among Immigrants in a Low-Incidence Country. J Clin Microbiol, 2016. 54(7): p. 1862-1870.
11. Jamieson, F.B., et al., Whole-genome sequencing of the Mycobacterium tuberculosis Manila sublineage results in less clustering and better resolution than mycobacterial interspersed repetitive-unit-variable-number tandem-repeat (MIRU-VNTR) typing and spoligotyping. J Clin Microbiol, 2014. 52(10): p.
3795-8.
12. Gardy, J.L., et al., Whole-Genome Sequencing and Social-Network Analysis of a Tuberculosis Outbreak. 2011. 364(8): p. 730-739.
13. Walker, T.M., et al., Whole-genome sequencing to delineate Mycobacterium tuberculosis outbreaks: a retrospective observational study. The Lancet.
Infectious diseases, 2013. 13(2): p. 137-146.
14. Jajou, R., et al., Epidemiological links between tuberculosis cases identified twice as efficiently by whole genome sequencing than conventional molecular typing: A population-based study. PLoS One, 2018. 13(4): p. e0195413.
15. Koster, K.J., et al., Genomic sequencing is required for identification of tuberculosis transmission in Hawaii. BMC Infect Dis, 2018. 18(1): p. 608.
16. Stimson, J., et al., Beyond the SNP Threshold: Identifying Outbreak Clusters Using Inferred Transmissions. Molecular Biology and Evolution, 2019. 36(3): p.
587-603.
17. Alaridah, N., et al., Transmission dynamics study of tuberculosis isolates with whole genome sequencing in southern Sweden. Scientific Reports, 2019. 9(1): p.
4931.
18. Luo, T., et al., Development of a Hierarchical Variable-Number Tandem Repeat Typing Scheme for Mycobacterium tuberculosis in China. PLOS ONE, 2014.
9(2): p. e89726.
19. 莊佩君, 周如文, 103 年度全程研究報告-開發基因分型方法及建置結核菌資
料庫. 2014, 衛生福利部疾病管制署: 衛生福利部疾病管制署.
20. Hunter, P.R. and M.A. Gaston, Numerical index of the discriminatory ability of typing systems: an application of Simpson's index of diversity. Journal of clinical microbiology, 1988. 26(11): p. 2465-2466.
21. Sola, C., et al., Genotyping of the Mycobacterium tuberculosis complex using MIRUs: association with VNTR and spoligotyping for molecular epidemiology and evolutionary genetics. Infection, Genetics and Evolution, 2003. 3(2): p. 125- 133.
22. Cole, S.T., et al., Deciphering the biology of Mycobacterium tuberculosis from the complete genome sequence. Nature, 1998. 393(6685): p. 537-544.
23. Meehan, C.J., et al., The relationship between transmission time and clustering methods in Mycobacterium tuberculosis epidemiology. 2018: p. 302232.
24. Kohl, T.A., et al., Whole-genome-based Mycobacterium tuberculosis surveillance: a standardized, portable, and expandable approach. J Clin Microbiol, 2014. 52(7): p. 2479-86.
25. Pankhurst, L.J., et al., Rapid, comprehensive, and affordable mycobacterial diagnosis with whole-genome sequencing: a prospective study. Lancet Respir Med, 2016. 4(1): p. 49-58.
26. Tyler, A.D., et al., Application of whole genome sequence analysis to the study of Mycobacterium tuberculosis in Nunavut, Canada. PLOS ONE, 2017. 12(10):
p. e0185656.
27. Sloot, R., et al., Clustering of tuberculosis cases based on variable-number tandem-repeat typing in relation to the population structure of Mycobacterium tuberculosis in the Netherlands. Journal of clinical microbiology, 2013. 51(7): p.
2427-2431.
28. Coscolla, M. and S. Gagneux, Consequences of genomic diversity in
Mycobacterium tuberculosis. Seminars in Immunology, 2014. 26(6): p. 431-444.
29. Chaisson, M., P. Pevzner, and H. Tang, Fragment assembly with short reads.
Bioinformatics, 2004. 20(13): p. 2067-2074.
30. Meehan, C.J., et al., Whole genome sequencing of Mycobacterium tuberculosis:
current standards and open issues. Nature Reviews Microbiology, 2019.
31. Pfeiffer, F., et al., Systematic evaluation of error rates and causes in short samples in next-generation sequencing. Scientific Reports, 2018. 8(1): p. 10950.
Appendix
Figure 1. Flow chart of sample collection. The samples were the isolates of TB patients.
Table 1. The baseline descriptive characteristic of patients in Kaohsiung Medical University Hospital from March 2017 to December 2017.
Age in years, n (%)
15-24 (3%)
25-44 (16.6%)
45-64 (27.6%)
65≤ (52.8%)
(74.23%) (25.77%) Marital status, n (%)
(23.31%) (67.48%) (4.29%) (1.84%) (3.08%)
(96.93%) (3.07%)
Lineage 1 (35%)
Lineage 2 (43.33%)
Lineage 4 (21.67%)
5 27 45 86 Total=163
Lineage, n (%)
Married Divorced Widowed Missing Sex, n (%)
Male Female Variable Name
Age, years
64.02 Mean
Median
42 121
66
37 69 57 5 158
5 3 7 Single
Taiwan Foreign
110 38
Nationality, n (%)
Table 2. The consistence of clustered pairs between 24-loci MIRU-VNTR and WGS from 155 isolates of patients.
The 163 patients excluding Case 18, 19, 32, 67, 77, 103, 138, 143). (+) was mean the number of pairs identified as the cluster by the tool; (−) was mean the number of pairs identified as non-cluster by the tool.
WGS (+) WGS (−) Total
8 80 88
15 11832 11847
23 11912 11935
24-loci MIRU-VNTR (+) 24-loci MIRU-VNTR (−)
Total
Figure 2. The distribution of patient locations by lineages.
Figure 3. The distribution of Cluster A patient locations.
Figure 4. The distribution of Cluster B-D patient locations.
Figure 5. Network of WGS-clustered cases.
Figure 6. Neighbor joining tree of Cluster A.
Figure 7. Network of MIRU-clustered cases with geographical correlation.
Figure 8. Neighbor joining tree of Cluster P.
Figure 9. The relationship of variation between 24-loci MIRU-VNTR and WGS.
Figure 10. The relationship of variation between 24-loci MIRU-VNTR and WGS (under 50 SNPs).
Figure 11. Venn diagram of 24-loci MIRU-VNTR and WGS typing of 155 MTB isolates from Kaohsiung and geographical correlation.
Supplement
Table S1. The characteristic of patients between WGS-clustered and Unique.
Male Female
Mean Median
15-24 25-44 45-64 65≤
Single Married Divorced Widowed Missing
Taiwan Foreign
Lineage 1 Lineage 2 Lineage 4
P-value ( n=150 ) ( n=13 )
Sex 0.09953
114 (76%) 7 (54%) Unique WGS-Clustered
64.56 57.85
67.5 56
Age, years
36 (24%) 6 (46%)
Age, years
3 (23.1%)
Marital status 0.3143
34 (22.6%) 4 (30.8%)
0.07644
5 (3.3%) 0 (0%)
24 (16%) 3 (23.1%) 38 (25.3%) 7 (53.8%)
58 (38.7%) 11 (84.6%) 37 (24.6%) 0 (0%) Variable Name
5 (3.3%) 0 (0%)
Lineage 0.00478*
55 (36.7%) 2 (15.4%)
5 (3.4%) 0 (2%)
Nationality 0.999
145 (96.7%) 13 (100%) 102 (68%) 8(61.5%)
7 (4.7%) 0 (0%)
2 (1.3%) 1 (7.7%) 83 (55.3%)
Table S2. The characteristic of patients between MIRU-clustered and Unique.
Male Female Mean Median 15-24 25-44 45-64 65≤
Single Married Divorced Widowed Missing Taiwan Foreign Lineage 1 Lineage 2 Lineage 4
P-value ( n=130 ) ( n=25 )
Sex 0.2179
99 (76%) 16 (64%)
31 (24%) 9 (36%)
Age, years
Unique MIRU-Clustered
64.61 67.2
67 73
Age, years 0.9999
14 (56%)
Marital Status 0.4398
28 (21.5%) 7 (28%)
4 (3.1%) 1 (4%)
19 (14.6%) 3 (12%)
36 (27.7%) 7 (28%)
56 (43.1%) 7 (28%)
36 (27.7%) 0 (0%)
Variable Name
3 (2.3%) 0 (0%)
Lineage 0.00*
38 (29.2%) 18 (72%)
5 (3.9%) 0 (0%)
Nationality 0.999
127 (97.7%) 25 (100%)
88 (67.7%) 17(68%)
7 (5.4%) 0 (0%)
2 (1.5%) 1 (4%)
71 (54.6%)
Table S3. The consistence of clustered pairs between 8-loci MIRU-VNTR and WGS from 158 isolates of patients.
(+) was mean the number of pairs identified as the cluster by the tool; (−) was mean the number of pairs identified as non-cluster by the tool. Patients were excluding Case 19, 32, 77, 138, 143.
WGS (+) WGS (−) Total
8 157 165
15 12223 12238
23 12380 12403
Total
8-loci MIRU-VNTR (+) 8-loci MIRU-VNTR (−)
Table S4. The consistence of clustered pairs between 10-loci MIRU-VNTR and WGS from 158 isolates of patients.
(+) was mean the number of pairs identified as the cluster by the tool; (−) was mean the number of pairs identified as non-cluster by the tool. Patients were excluding Case 19, 32, 77, 138, 143.
WGS (+) WGS (−) Total
4 39 43
19 12341 12360
23 12380 12403
Total
10-loci MIRU-VNTR (+) 10-loci MIRU-VNTR (−)
Table S5. The consistence of clustered pairs between 28-loci MIRU-VNTR and WGS from 155 isolates of patients.
(+) was mean the number of pairs identified as the cluster by the tool; (−) was mean the number of pairs identified as non-cluster by the tool. The patients were excluding Case 18, 19, 32, 67, 77, 103, 138, 143.
WGS (+) WGS (−) Total
4 23 27
19 12044 12063
23 12067 12090
Total
28-loci MIRU-VNTR (+) 28-loci MIRU-VNTR (−)
Table S6. The consistence of clustered case number between 24-loci MIRU-VNTR and WGS from 158 isolates of patients.
(+) was mean the number of pairs identified as the cluster by the tool; (−) was mean the number of pairs identified as non-cluster by the tool. Patients were excluding Case 19, 32, 77, 138, 143.
WGS (+) WGS (−) Total
8 31 39
3 113 116
23 144 155
24-loci MIRU-VNTR (+) 24-loci MIRU-VNTR (−)
Total
Table S7. The Hunter Gaston discriminatory index of each loci.
Bold was the locus of 24-loci international standard.
Loci Loci Loci
QUB-26 MIRU 39 MIRU 20
MIRU 26 ETRA Mtub34
QUB-18 MIRU 24 MIRU 02
VNTR3232 Mtub30 ETRC
Mtub21 MIRU 23 MIRU 27
QUB2163b Mtub29 MIRU 16
VNTR3820 QUB4156
ETRB MIRU 31 MIRU 10 VNTR4120
Mtub04 0.3041
0.9623 0.9417 0.9312 0.8698 0.8137 0.7401 0.4403
0.3828 0.5479
0.3286 0.3263 0.3197 0.5537 0.5359 0.5012 0.4975 0.4419 0.2087
0.1808 0.1604 0.1453 0.1421
Low (HGDI < 0.3) Moderate (0.3 ≤ HGDI ≤ 0.6) High (HGDI > 0.6)
0.2577 0.2539
Table S8. The number of pairs in different SNP-definition.
(+) was mean the number of pairs identified as the cluster by the tool; (−) was mean the number of pairs identified as non-cluster by the tool.
82 81 80
11846 11843 11839 11832
8
1 15
80
11832 86
4 8 15
WGS(+) / MIRU-VNTR(+)
WGS(+) / MIRU-VNTR(−)
WGS(−) / MIRU-VNTR(+)
WGS(−) / MIRU-VNTR(−)
2 6 7 8
SNPs ≤ 1 SNPs ≤ 3 SNPs ≤ 6 SNPs ≤ 10 SNPs ≤ 12
Figure S1. The relationship of variation between 8-loci MIRU-VNTR and WGS.
Figure S2. The relationship of variation between 10-loci MIRU-VNTR and WGS.
Figure S3. The relationship of variation between 28-loci MIRU-VNTR and WGS.
Figure S4. The relationship of variation between MIRU-VNTR and WGS in Lineage 1 (N=56).
Figure S5. The relationship of variation between MIRU-VNTR and WGS in Lineage 2 (N=63).
Figure S6. The relationship of variation between MIRU-VNTR and WGS in Lineage 4 (N=36).
Figure S7. Network of MIRU-clustered cases.
Figure S8. The number of pairs in the different group of SNPs.