Sclareol exhibits anti-inflammatory activity in both lipopolysaccharide-stimulated
RAW246.7 macrophages and the λ-carrageenan-induced paw edema model
Guan-Jhong Huang,†Chun-Hsu Pan,‡Chieh-Hsi Wu‡,*
†Institute of Chinese Pharmaceutical Sciences, China Medical University, Taichung 40402,
Taiwan
‡School of Pharmacy, China Medical University, Taichung 40402, Taiwan
*Correspondence Author:
Chieh-Hsi Wu, Ph.D.
Professor and Chairman,
School of Pharmacy, China Medical University,
No. 91, Hsueh-Shih Road, Taichung 40402, Taiwan Tel: +886-4-22053366#5101 / Fax: +886-4-22073709
E-mail: [email protected]
Sclareol is a natural fragrance compound and be widely used in the cosmetic and food
industries. Our study attempted to investigate whether sclareol has anti-inflammatory property and to clarify its possible molecular mechanisms. The lipopolysaccharide (LPS)-stimulated
RAW246.7 macrophages and the λ-carrageenan (Carr)-induced edema paw model were applied
to examine the anti-inflammation of sclareol in the present study. Inhibitory effects of sclareol were examined on cells growth, nitric oxide (NO) production, expression of inducible nitric
oxide synthase (iNOS) and cyclooxygenase-2 (COX-2) proteins, and activity change of
antioxidant enzymes (catalase, superoxide dismutase and glutathione peroxidase). Experimental
results demonstrated that sclareol markedly inhibited cell growth, NO production, and expression
of iNOS and COX-2 proteins in LPS-stimulated RAW246.7 cells. Sclareol can also
significantly reduce paw edema, tissue content of NO, TNF-and malondialdehyde (MDA), expression of iNOS and COX-2 proteins, and neutrophil infiltration within the tissues by Carr
stimulation. The anti-inflammatory mechanisms of sclareol might be related to the decrease of
inflammatory cytokine and activity increase of antioxidant enzymes, which would result in reduction of iNOS, COX-2 and MDA and subsequently inflammatory responses.
The acute inflammatory response is a series of local cellular and vascular responses that
occurs immediately following tissue damage, and this complex biological response is a protective mechanism of organisms to remove the injurious stimuli, such as pathogens, irritants or physical
injury, from the tissues and to initiate the healing process. However, chronic inflammation has
been reported to involve in the development of several diseased conditions or disorders such as Alzheimer disease,1asthma,2atherosclerosis,3autoimmune diseases,4cancers5and rheumatoid
arthritis,6which may lead to progressive destruction of the tissue, fibrosis, and necrosis, etc.7, 8 Numerous molecules have been mentioned to contribute the local tissue destruction during
chronic inflammation.9-11 Of these, inducible nitric oxide synthase (iNOS), a member of the NOS protein family, catalyzes the formation of nitric oxide (NO) from L-arginine.12 NO can
activate guanylate cyclase to induce smooth muscle relaxation in the normal physiological condition. High-output NO produced by the activated macrophage via iNOS has been found to
play a major role as antimicrobial molecule.13 However, highly level of NO have the
opportunity to react with superoxide resulting in peroxynitrite formation and cell toxicity, which are found to play important roles in inflammation and carcinogenesis. The expression of
COX-2 (cyclooxygenase 2) has also been mentioned to implicate the response for the
prostaglandin biosynthesis involved in inflammation and pain, and clinical application of highly
selective inhibitors of COX-2 has been demonstrated to provide effective anti-inflammatory
activity with marked reduction in gastrointestinal toxicity as compared to traditional NSAIDs
(non-steroidal anti-inflammatory drugs).14 Similarly, TNF-(tumor necrosis factor-alpha), an endotoxin-induced glycoprotein, is a critical modulator of host immune response to infection, but
inappropriate or excessive production can be harmful. Receiving anti-TNF-antibody and oral administration of soluble TNF receptors have been demonstrated to control the inflammatory conditions.11
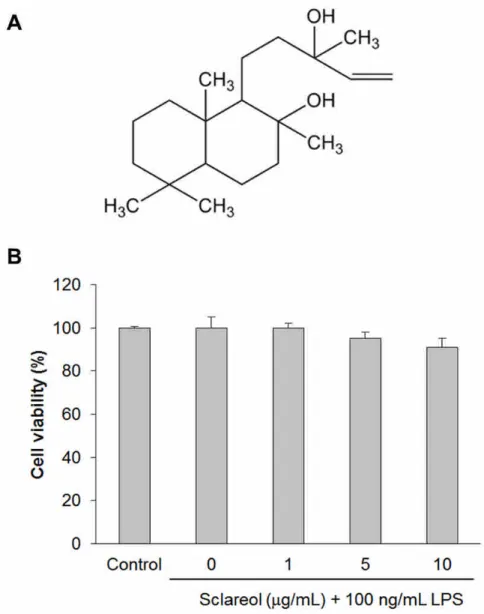
Sclareol (labd-14-ene-8,13-diol) (Figure 1A) belongs to the member of labdane type
diterpenes and first isolated from the plant Salvia sclarea, whose natural fragrance ingredient was
widely applied in both cosmetic and food industries. Several studies demonstrated that sclareol has been identified as a biologically active molecule to provide the cytotoxic or cytostatic effects
against numerous human cancer cell lines.15-18 Noori et al. noticed that sclareol modulated the immune response through shifting cytokines pattern in the splenocytes obtained from
intra-tumorally injected mice.19 Although this report implicated that sclareol might has
potential activity to regulate the inflammatory response, the possible pharmacological mechanisms are unclear until now. Thereby, we designed both in vitro and in vivo study to
examine whether sclareol has potential effects against inflammatory response in the
lipopolysaccharide (LPS)-stimulated RAW246.7 cells and the-carrageenan-induced edema paw model, and to clarify its possible molecular mechanisms, which will help us to further evaluate
the clinical therapeutic potential of sclareol on anti-inflammation.
RESULTS AND DISCUSSION
The growth regulation of sclareol on RAW264.7 cell viability was examined by a MTT assay
(Figure 1B). The cells were pre-treated with sclareol at the concentrations (0, 1, 5 and 10
g/mL) for 1 h and then co-incubated with 100 ng/mL of LPS for further 24 h. Our results indicated that 100 ng/mL of LPS did not change cell viability of RAW246.7 cells. Similarly, the cell viability of RAW264.7 macrophages also did not be influenced even if treating the highest
concentration (10 μg/mL) of sclareol with presence of LPS. However, several studies reported that sclareol can markedly reduce the cell viability of numerous human leukemic cell lines at a
range of IC50value from 6.0 to 24.2g/mL,15, 18inhibit human breast cancer cells at a range of
IC50value from 7.0 to 11.6g/mL,17, 18and suppress human colon cancer cells (HCT116) at 10.6
g/mL of IC50value, etc..18 In the normal cell such as peripheral blood mononuclear (PBMC) cells, sclareol still exhibited its growth inhibition at IC50value of 10.7g/mL.18
Various concentration (0, 1, 5 and 10g/mL) of sclareol were used on RAW246.7 cells to test whether sclareol can reverse LPS-induced dramatically accumulation of NO (Figure 2).
The results revealed that 100 ng/mL LPS can evidently increase NO production as compared with
control group (p < 0.001), and this effect can be markedly suppressed in a dose-dependent
manner by pre-treatment of sclareol (1, 5 and 10g/mL) as compared to those in LPS treated only group. Additionally, sclareol (0, 1, 5 and 10g/mL) was also tested on RAW246.7 cells to
examine whether it can reduce protein expression of inflammation-associated molecules triggered
by LPS (Figure 3). The experimental results suggested that 100 ng/mL of LPS can significantly stimulated protein expression of iNOS and COX-2 (p < 0.001), and pre-treatment of sclareol at
concentration of 5 and 10g/mL can obviously down-regulate expression of these LPS-stimulated proteins as compared to LPS treated only group (p < 0.01 and p < 0.001).
It has been mentioned that sclareol can increase expression of interferon-gamma (INF-γ) and
decrease interleukin-4 (IL-4) in the splenocytes isolated from intra-tumorally injected mice.19 Chan and Riches demonstrated that co-incubation of LPS and INF-γcan induce both TNF-αand
IL-1βproduction, which up-regulated protein expression of iNOS via activating ERK and JNK MAPK pathways in the RAW 264.7γNO(−)cells that do not produce NO with IFN-γstimulation
alone.20 Roach et al. also reported that co-treatment of LPS and INF-γwill increase both transcriptional and translational levels of iNOS in the macrophages.21 Moreover, the
up-regulatory effect of INF-γon the expression of iNOS also has been identified in aortic smooth
muscle cells, epithelial cells, and saphenous vein endothelium.22-24 In human foreskin
fibroblasts, IFN-γhas been reported to suppress COX-2 promoter activity.25 On the other hand,
IL-4 has been evidenced to down-regulate IFN-γ-inducible iNOS transcription in the murine macrophage cell line RAW264.7.26 Cui et al. also noticed that IL-4 has the capacity to inhibit
COX-2 mRNA transcription in human non-small cell lung cancer and follicular dendritic cells.27,
28 In contrast to the regulation of IFN-γ, Guo et al. noticed that IL-4 played a critical role for
mRNA stabilization of iNOS in primary human airway epithelial cells stimulated by IFN-γ.29 To date, it is still unknown whether sclareol can modulate the expression of INF-γand IL-4 in the
RAW 264.7 macrophages. In the present study, our data suggested that sclareol can markedly
decrease LPS-stimulated iNOS expression and then reduce NO production in the RAW 264.7 macrophages.
Carr-induced paw edema model was used to evaluate the in vivo anti-inflammatory effect of sclareol (Figure 4). The results showed that Carr injection will stimulate local inflammation and
then induce edema of paw tissues. Indo, a common clinical NSAID, was used as positive control to indicate that pre-treatment of 10 mg/kg Indo can effectively reduce paw edema after 3
h Carr stimulation (p < 0.001). Similarly, pre-treatment of 10 mg/kg sclareol can also markedly attenuate paw edema after 3 h Carr stimulation, as same as the result of Indo + Carr group (p <
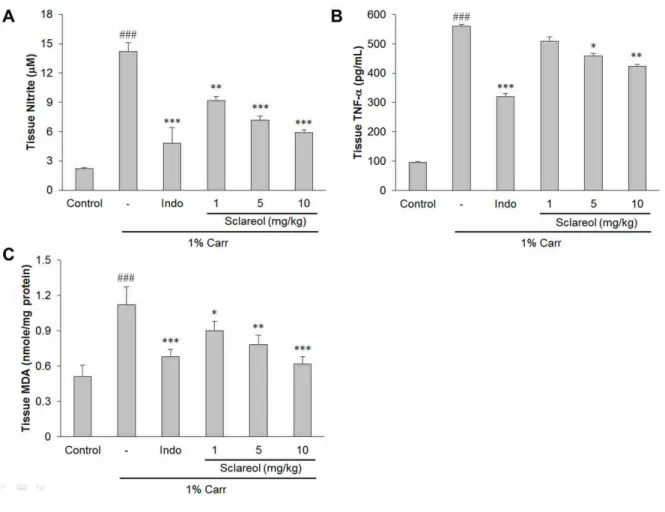
0.01). In Figure 5A, the NO level increased significantly in the edema serum at the 5 h after
Carr injection (p < 0.001), which can be markedly reversed by sclareol as concentration more than 1 mg/kg (p < 0.01). Likewise, both TNF-αand MDA levelwereincreased significantly in
the edema paw at the 5 h after Carr injection (p < 0.001), and this effect was decreased significantly by treatment with sclareol as well as 10 mg/kg Indo (Figures 5Band5C).
The Carr test is highly sensitive to non-steroidal anti-inflammatory drugs, and has long been
accepted as a useful phlogistic tool for investigating new drug therapies.30 It is well known that
the third phase of the edema-induced by Carr, in which the edema reaches its highest volume, is characterized by the presence of prostaglandins and other compounds of slow reaction found that
the injection of Carr into the rat paw induces the liberation of bradykinin, which later induces the
biosynthesis of prostaglandin and other autacoids, which are responsible for the formation of the inflammatory exudates.31 In the present study, statistical analysis revealed that 10 mg/kg of
Indo and 10 mg/kg of sclareol significantly inhibited the development of edema 3 h after
treatment (p < 0.001 or p < 0.01) (Figure 4). L-arginine–NO pathway has been proposed to play
an important role in the Carr-induced inflammatory response,32and the expression of the
inducible isoform of NO synthase has been proposed as an important mediator of inflammation.33
Our present results confirm that Carr-induced paw edema model results in the production of NO, and the level of NO was decreased significantly by treatment with 1, 5, and 10 mg/kg of sclareol
(Figure 5A). We suggest the anti-inflammatory mechanism of sclareol may be through the L-arginine–NO pathway because sclareol significantly inhibits the NO production. TNF-αis
also a mediator of Carr-induced inflammatory incapacitation, and is able to induce the further
release of kinins and leukotrienes, which is suggested to have an important role in the maintenance of long-lasting nociceptive response.34 In this study, we found that sclareol
obviously decreased the level of serum TNF-αafterCarrinjection by treatment with 5 and 10
mg/kg of sclareol (Figure 5B).
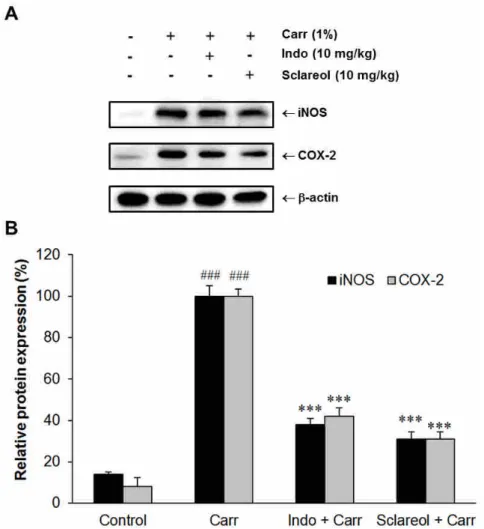
Our results showed that sclareol (10 mg/kg) can obviously inhibit (p < 0.001) both iNOS and COX-2 proteins expression in edema paw as compared to Carr-treated alone group (Figure 6).
The experiments showed an average of 69.6 % and 70.3 % down-regulation of iNOS and COX-2
protein, respectively, after treatment with sclareol at 10 mg/kg compared with the Carr-induced alone (Figure 6B). In addition, the protein expression showed an average of 61.5 % and 58.1 %
down-regulation of iNOS and COX-2 protein after treatment with Indo at 10 mg/kg compared with the Carr-induced alone (Figure 6B). The potency of sclareol (10 mg/kg) on
down-regulating the expression of iNOS and COX-2 proteins was similar to that of Indo (10 mg/kg).
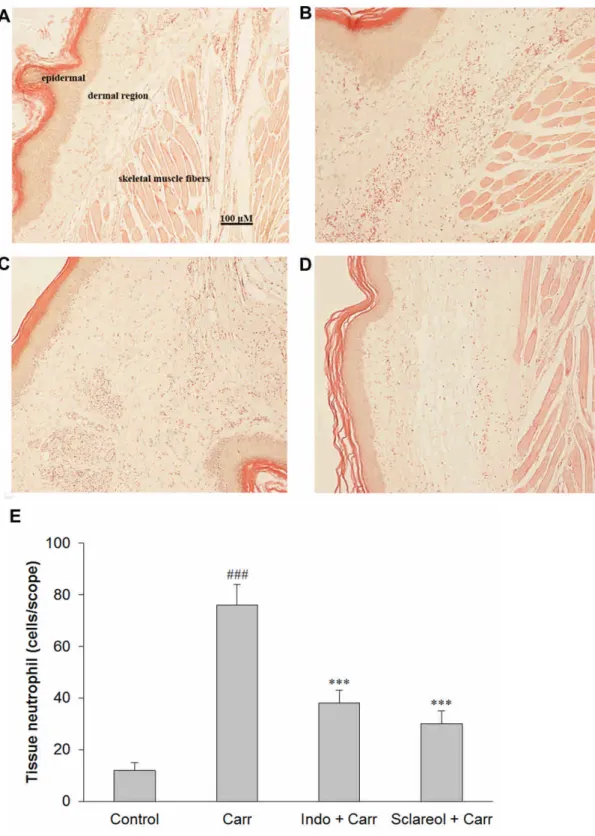
Paw biopsies of Carr model animals showed marked cellular infiltration in the connective tissue, and the infiltrates accumulated between collagen fibers and into intercellular spaces
(Figure 7B). Paw biopsies of animals treated with sclareol (10 mg/kg) showed a reduction in
Carr-induced inflammatory response (Figure 7D). Actually inflammatory cells were reduced in number and confined to near the vascular areas, and intercellular spaces did not show any cellular
infiltrations (Figure 7D). Collagen fibers were regular in shape and showed a reduction of intercellular spaces. Moreover, the hypoderm connective tissue was not damaged (Figure 7D).
In Figure 7E, neutrophils increased with Carr treatment (p < 0.001). As Indo and sclareol (10
mg/kg) could significantly decrease the neutrophils numbers as compared to the Carr-treated
group (p < 0.001). The Carr-induced inflammatory response has been linked to neutrophils infiltration and the production of neutrophils-derived free radicals as well as the release of other
neutrophils-derived mediators.34 It has been demonstrate that free radical and NO will be
released when administrating with Carr, and increasing free radical might attack plasma membrane and result in the accumulation of MDA. Our study demonstrated that 10 mg/kg
sclareol the same as Indo can markedly decrease neutrophils infiltration and accumulation of MDA within edema paw after Carr treatment (Figures 7and5C).
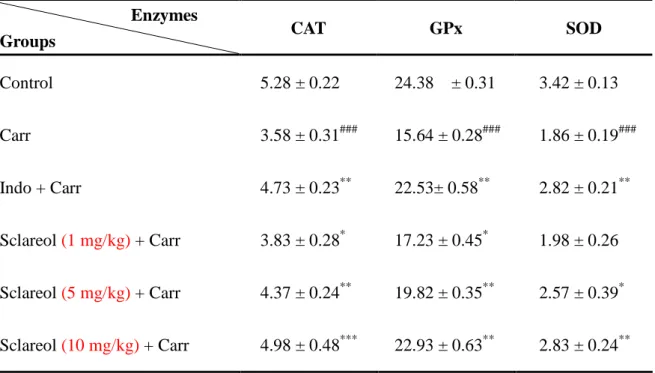
At 5h after the intrapaw injection of Carr, liver tissues were analyzed for the biochemical parameters such as CAT, SOD, and GPx activities (Table 1). CAT, SOD, and GPx activities in
liver tissue were decreased significantly by Carr administration, which were increased
significantly after treated with 5 mg/kg sclareol (p > 0.05 or p < 0.01) and 10 mg/kg Indo (p <
0.01). Glutathione (GSH) plays an important role against Carr-induced local inflammation,35
and endogenous GSH can reduce MDA production. In the present study, increases of CAT, SOD, and GPx activities were found in the group with sclareol treatment (Figure 5CandTable 1).
Thereby, we assume the suppression of MDA production is probably due to the increases of CAT, SOD, and GPx activities.
These results suggested that the anti-inflammatory mechanism of sclareol may be related to
the inhibitions of iNOS and COX-2, and it is associated with the increase in the activities of
antioxidant enzymes (CAT, SOD, and GPx). Based on reported bioactivities above, it might be partially explained why sclareol can exhibit the anti-inflammatory effect in the LPS-stimulated
RAW246.7 macrophages and the Carr-induced paw edema model. Sclareol may be used as a
pharmacological agent in the prevention or treatment of disease in which free radical formation in a pathogenic factor.
Figure 1. Chemical structure (A) and growth inhibitory effect (B) of sclareol in LPS-stimulated
RAW 264.7 cells.
Figure 2. Sclareol reduces LPS-induced NO production in RAW 264.7 macrophages. ###
indicated p < 0.001 as compared with control group (normal saline treated only). *, ** and ***
indicated p < 0.05, p < 0.01 and p < 0.001 as compared to LPS treated alone group, respectively.
Figure 3. Sclareol inhibits LPS-stimulated expression of inflammation-associated proteins in
RAW264.7 cells. (A) Western blot showing expression of iNOS and COX-2 proteins. The bar
chart indicated the relative protein expression of iNOS and COX-2 in RAW264.7 cells after treatments (B). ### indicated p < 0.001 as compared with control group (normal saline treated
only). ** and *** indicated p < 0.01 and p < 0.001 as compared with LPS treated only group,
respectively.
Figure 4. Sclareol reduced mice hind paw edema induced by-carrageenan (Carr). ** and ***
indicated p < 0.01 and p < 0.001 as compared with the Carr group, respectively. Carr, 1%
-carrageenan; Indo, 10 mg/kg indomethacin.
Figure 5. Sclareol inhibits tissue content of NO (A), TNF-(B) and MDA (C) in Carr-induced
paw edema model. ### indicated p <0.001 as compared with control group (normal saline
treated only). *, ** and *** indicated p < 0.05, p < 0.01 and p < 0.001 as compared with the Carr group, respectively. Indo, 10 mg/kg indomethacin.
Figure 6. Sclareol reduced expression of inflammation-associated proteins in edema paw induced
by Carr. (A) Western blot showing protein expression of iNOS and COX-2. The bar chart indicated the relative protein expression of iNOS and COX-2 within the paw tissue after
treatments (B). ### indicates p < 0.001 as compared with control group (normal saline treated only). *** indicates p < 0.001 as compared with Carr treated only group. Carr, 1%
-carrageenan; Indo, 10 mg/kg indomethacin; sclareol, 10 mg/kg sclareol.
Figure 7. Pathological examinations on Carr-induced edema paw tissues after treatments. The
pathological changes of paw tissues from (A) control group (normal saline treated only), (B) Carr
group, (C) Indo + Carr group, (D) Sclareol + Carr group were observed (original magnification, 100). (E) The bar chart shows neutrophil infiltration of paw tissues each group. ###
indicates p < 0.001 as compared with the control group (normal saline treated only). ***
indicates p < 0.001 as compared with Carr treated only group. Scale bar represents 100m.
Carr, 1%-carrageenan; Indo, 10 mg/kg indomethacin; Sclareol, 10 mg/kg sclareol.
Table 1. Regulation of sclareol on the enzyme activities of CAT, SOD and GPx in mice liver.
Enzymes
Groups CAT GPx SOD
Control 5.28 ± 0.22 24.38 ± 0.31 3.42 ± 0.13
Carr 3.58 ± 0.31### 15.64 ± 0.28### 1.86 ± 0.19###
Indo + Carr 4.73 ± 0.23** 22.53± 0.58** 2.82 ± 0.21**
Sclareol(1 mg/kg)+ Carr 3.83 ± 0.28* 17.23 ± 0.45* 1.98 ± 0.26 Sclareol(5 mg/kg)+ Carr 4.37 ± 0.24** 19.82 ± 0.35** 2.57 ± 0.39*
Sclareol(10 mg/kg)+ Carr 4.98 ± 0.48*** 22.93 ± 0.63** 2.83 ± 0.24**
Activity unit of enzymes: U/mg protein. ### indicates p < 0.001 as compared with the control group. *, ** and *** indicated p < 0.05, p < 0.01 and p < 0.001 as compared with the Carr group.
CAT, catalase; Carr, 1%-carrageenan; GPx, glutathione peroxidase; Indo, 10 mg/kg
indomethacin; SOD, superoxide dismutase.
EXPERIMENTAL SECTION
Chemicals. Sclareol, lipopolysaccharide (LPS) from Escherichia coli (serotype 0127:B8),
carrageenan (Carr), indomethacin (Indo) and other chemicals were purchased from
Sigma-Aldrich (St. Louis, MO, USA). TNF-αwaspurchased from BiosourceInternationalInc
(Camarillo, CA, USA). Anti-iNOS, anti-COX-2, anti-β-actin antibody (Santa Cruz Biotechnology, CA, USA) and a protein assay kit (Bio-Rad Lab, Watford, Herts, UK) were
obtained as indicated. Polyvinylidene fluoride (PVDF) membrane (Immobilon-P®) was obtained from Millipore Corp (Bedford, MA, USA).
Cell culture. A murine macrophage cell line RAW264.7 (BCRC No. 60001) was
purchased from the Bioresources Collection and Research Center (BCRC) of the Food Industry
Research and Development Institute (Hsinchu, Taiwan). Cells were cultured in culture dishes
containing Dulbecco's Modified Eagle Medium (DMEM; Sigma-Aldrich) supplemented with 10% fetal bovine serum (FBS; Sigma-Aldrich) in a CO2 incubator (5% CO2 in air) at 37°C and
subcultured every 3 days at a dilution of 1:5 using 0.05% trypsin–0.02% EDTA in Dulbecco's phosphate-buffered saline (DPBS) without Ca2+ and Mg2+ ions.
Mice model of Carr-induced paw edema. Twenty-four male ICR mice were obtained
from the BioLASCO Taiwan Co., Ltd. The animals housed in Plexiglas cages with free access
to food and water, and maintained at a constant temperature of 22 ± 1°C and relative humidity of 55 ± 5 % with a photocycle of 12-h light/dark. The experimental procedures were performed
according to the National Institutes of Health (NIH) Guide for the Care and Use of Laboratory
Animals. In addition, all tests were conducted under the guidelines of the International
Association for the Study of Pain.36 After a 2-week adaptation period, the mice (about 18-25 g)
were randomly assigned to four groups (n = 6) for further experiments. The control group receives normal saline, and the other three groups include a Carr alone, Carr + Indo (a positive
control), and sclareol administered groups (Carr + sclareol). The Carr-induced hind paw edema model was used for determination of anti-inflammatory activity.37 Animals were treated with
normal saline, Indo or sclareol (1, 5 and 10 mg/kg) with intraperitoneal injection, 30 min prior to injection of1% Carr(50 μL)in theplantarsideofrighthind pawsofthemice. Thepaw volume was measured immediately after Carr injection and at 1, 2, 3, 4, and 5 h intervals after the
administration of the edematogenic agent using a Plethysmometer (model 7159; Ugo Basile, Varese, Italy). The degree of swelling induced was evaluated by the ratio A/B, where A is the
volume of the right hind paw after Carr treatment, and B is the volume of the right hind paw before Carr treatment. Finally, the animals were sacrificed and all of right hind paw were
dissected and stored at -80 ºC. Also, blood were withdrawn and kept at -80 ºC.
MTT cell viability assay. RAW264.7 cells (2 × 10⁵) were cultured in 96-well plate
containing DMEM supplemented with 10% FBS for 1 day to become nearly confluent. Then
cells were pre-treated with several concentrations (0, 1, 5 and 10g/mL) of sclareol for 1 h and then co-stimulated with 100 ng/mL of LPS for 24 h. After that, the cells were washed twice
with DPBS and incubated with 100L of 0.5 mg/mL MTT (3-[4,5-dimethylthiazol-
2-yl]-2,5-diphenyltetrazolium bromide) for 2 h at 37°C, and then the medium was discarded and
100L of dimethyl sulfoxide (DMSO) was added. After 30 min incubation, absorbance at 570 nm was read using a microplate reader.
Measurement of nitric oxide/nitrite. NO production was indirectly assessed by
measuring the nitrite levels in the cultured media and serum determined according to previous
study.37 The cells were pre-incubated with sclareol (0, 1, 5 and 10g/mL) for 1 hr and then
co-treated with 100 ng/mL LPS at 37°C for 24 h. Subsequently, 100L of each collected culture medium was mixed with the same volume of Griess reagent (1% sulfanilamide, 0.1%
naphthyl ethylenediamine dihydrochloride and 5% phosphoric acid) and incubated at room temperature for 10 min. The absorbance of mixture was measured at 540 nm with a
Micro-Reader (Molecular Devices, Orleans Drive, Sunnyvale, CA). Homogenized tissue samples were diluted four times with distilled water and deproteinized by adding 1/20 volume of
zinc sulfate (300 mg/mL) to a final concentration of 15 mg/mL. After centrifugation at 10,000
×g for 5 min atroom temperature,100 μL ofsupernatantwasapplied into amicrotiterplate, followed by 100 μL ofGriessreagent. After10 min ofcolordevelopmentatroom temperature, the absorbance was measured at 540 nm with a Micro-Reader. By using sodium nitrite to
generate a standard curve, the concentration of nitrite was measured by absorbance at 540 nm.
Western blot analysis. The stimulated RAW264.7 cells were washed with PBS and lysed
in an ice-cold lysis buffer [10% glycerol, 1% Triton X-100, 1mM sodium orthovanadate, 1mM
EGTA, 10mM sodium fluoride, 1mM sodium pyrophosphate, 20 mM Tris buffer (pH 7.9), 100
mM-glycerophosphate, 137 mM sodium chloride, 5 mM EDTA and one protease inhibitor cocktail tablet (Roche, Indianapolis, IN, USA)] on ice for 1 h, followed by centrifugation at 12,000 ×g for 30 min at 4°C. Soft tissues were removed from individual mice paws and
homogenized in a solution containing 10 mM CHAPS, 1 mM phenylmethylsulphonyl fluoride
(PMSF), 5g/mL, aprotinin, 1 M pepstatin and 10 M leupeptin. The homogenates were centrifuged at 12,000 ×g for 20 min, and the supernatant was collected for Western blot analysis.
Protein concentration was measured by the Bio-Rad protein assay kit with bovine serum albumin
as a standard. About 30g of protein from the supernatants was then separated on 10% sodium dodecylsulphate- polyacrylamide gel (SDS-PAGE) and transferred to PVDF membranes. After transfer, the membrane was blocked for 2 h at room temperature with 5% skim milk in TBST
buffer (20 mM Tris, 500 mM NaCl, pH 7.5 and 0.1% Tween 20). The membranes were then
incubated with mouse monoclonal anti-iNOS or anti-COX-2 antibody in 5% skim milk in TBST
buffer for 2 h at room temperature. The membranes were washed three times with TBST at room temperature and then incubated with a 1:2000 dilution of anti-mouse IgG secondary
antibody conjugated to horseradish peroxidase (Sigma-Aldrich) in 2.5% skim milk in TBST for 1
h at room temperature. The membranes were washed three times and the immunoreactive proteins were detected by enhanced chemiluminescence (ECL) using Hyperfilm® ECL reagent
(Amersham International, Buckinghamshire, UK). The results of Western blot analysis were quantified by measuring the relative intensity compared to the control using Kodak Molecular
Imaging Software Ver.4.0.5 (Eastman Kodak Company, Rochester, NY, USA) and represented in
the relative intensities. The results for iNOS and COX-2 were normalized to the band density of internal control (-actin), and the relative proteins expression were calculated according to the values of LPS treated alone group as 100%.
Malondialdehyde assay. Malondialdehyde (MDA) from Carr-induced edema foot was
evaluated by the thiobarbituric acid reacting substance (TRARS) method.37 Briefly, MDA reacted with thiobarbituric acid in the acidic high temperature and formed a red-complex TBARS.
The absorbance of TBARS was determined at 532 nm.
Measurement of Serum TNF-. Serum levels of TNF-were determined using a
commercially available ELISA kit (Biosource International Inc., Camarillo, CA) according to the
manufacturer's instruction. The concentration of serum TNF-was presented as pg/mL and determined according to the regression equation of the standard curve.
Histological examination. The biopsies of mice hind paws were immediately taken
following 5 h treatment with the interplanetary injection of Carr. The tissue slices were fixed in
(1.85% formaldehyde, 1% acetic acid) for 1 week at room temperature, dehydrated by graded ethanol and embeddedin Paraffin (Sherwood Medical). Tissuesections(5 μm thickness)were
deparaffinized with xylene and stained with hematoxylin and eosin for cell counting. All samples were observed and photographed with BH-2 Olympus microscopy. The excessive
inflammatory response was illustrated as massive infiltration of ploymorphonuclear leukocytes (PMNs). The observation of tissue slices (3-5 slides) were randomly chosen from every groups,
and the number of neutrophils were counted from five scopes (400×) on each tissue slice to obtain average value.
Measurement of antioxidant enzymes activity. The following biochemical parameters
were analyzed to check the hepatoprotective activity of sclareol by the methods given below.
Total superoxidase dismutase (SOD) activity was determined by the inhibition of cytochrome c
reduction.38 The reduction of cytochrome c was mediated by superoxide anions generated by the xanthine/xanthine oxidase system and monitored at 550 nm. One unit of SOD was defined
as the amount of enzyme required to inhibit the rate of cytochrome c reduction by 50%. Total
catalase (CAT) activity was measured according to previous study.39 In brief, the reduction of
10 mM hydrogen peroxide in 20 mM of phosphate buffer (pH 7.0) was monitored by measuring the absorbance at 240 nm. The activity was calculated using a molar absorption coefficient, and
the enzyme activity was defined as nanomoles of dissipating hydrogen peroxide per milligram
protein per minute. Total glutathione peroxidase (GPx) activity in cytosol was determined according to Paglia and Valentine's method.40 The enzyme solution was added to a mixture
containing hydrogen peroxide and glutathione in 0.1 mM Tris buffer (pH 7.2) and the absorbance at 340 nm was measured. Activity was evaluated from a calibration curve, and the enzyme
activity was defined as nanomoles of NADPH oxidized per milligram protein per minute.
Statistical analysis. Data are expressed as mean ± standard error of the mean (SEM).
Statistical evaluation was carried out by one-way analysis of variance (ANOVA, Scheffe's post-hoc test). A value of p < 0.05 was regarded as being statistically significant.
Acknowledgements
The authors want to thank the financial supports from the National Science Council (NSC
97-2313-B-039 -001 -MY3), China Medical University (CMU) (CMU99-S-29,
CCM-P99-RD-042, and CMU99-COL-10) and Taiwan Department of Heath Clinical Trial and
Research Center of Excellence (DOH100-TD-B-111-004).
REFERENCES AND NOTES
(1) Weninger, S. C.; Yankner, B. A. Nat. Med. 2001, 7, 527-528.
(2) Bousquet, J.; Jeffery, P. K.; Busse, W. W.; Johnson, M.; Vignola, A. M. Am. J. Respir. Crit.
Care. Med. 2000, 161, 1720-1745.
(3) Libby, P. Nature 2002, 420, 868-874.
(4) Flavell, R. A. Curr Top Microbiol. Immunol. 2002, 266, 1-9.
(5) Rajput, S.; Wilber, A. Front. Biosci. (Schol Ed) 2010, 2, 176-183.
(6) Christodoulou, C.; Choy, E. H. Clin. Exp. Med. 2006, 6, 13-19.
(7) Liu, H.; Pope, R. M. Rheum. Dis. Clin. North Am. 2004, 30, 19-39, v.
(8) Wynn, T. A.; Barron, L. Semin. Liver Dis. 2010, 30, 245-257.
(9) Suschek, C. V.; Schnorr, O.; Kolb-Bachofen, V. Curr. Mol. Med. 2004, 4, 763-775.
(10) Crofford, L. J. J. Rheumatol. Suppl. 1997, 49, 15-19.
(11) Bradley, J. R. J. Pathol. 2008, 214, 149-160.
(12) Knowles, R. G.; Moncada, S. Biochem. J. 1994, 298 ( Pt 2), 249-258.
(13) James, S. L. Microbiol. Rev. 1995, 59, 533-547.
(14) Antoniou, K.; Malamas, M.; Drosos, A. A. Expert Opin. Pharmacother. 2007, 8, 1719-1732.
(15) Dimas, K.; Kokkinopoulos, D.; Demetzos, C.; Vaos, B.; Marselos, M.; Malamas, M.;
Tzavaras, T. Leukemia Res. 1999, 23, 217-234.
(16) Dimas, K.; Hatziantoniou, S.; Tseleni, S.; Khan, H.; Georgopoulos, A.; Alevizopoulos, K.;
Wyche, J. H.; Pantazis, P.; Demetzos, C. Apoptosis 2007, 12, 685-694.
(17) Dimas, K.; Papadaki, M.; Tsimplouli, C.; Hatziantoniou, S.; Alevizopoulos, K.; Pantazis, P.;
Demetzos, C. Biomed. Pharmacother. 2006, 60, 127-133.
(18) Hatziantoniou, S.; Dimas, K.; Georgopoulos, A.; Sotiriadou, N.; Demetzos, C. Pharmacol.
Res. 2006, 53, 80-87.
(19) Noori, S.; Hassan, Z. M.; Mohammadi, M.; Habibi, Z.; Sohrabi, N.; Bayanolhagh, S.
Cellular Immunol. 2010, 263, 148-153.
(20) Chan, E. D.; Riches, D. W. American journal of physiology. Cell Physiol. 2001, 280,
C441-450.
(21) Roach, T. I.; Barton, C. H.; Chatterjee, D.; Liew, F. Y.; Blackwell, J. M. Immunology 1995,
85, 106-113.
(22) Teng, X.; Zhang, H.; Snead, C.; Catravas, J. D. Am. J. Physiol -Cell Physiol. 2002, 282,
C144-152.
(23) Arany, I.; Brysk, M. M.; Brysk, H.; Tyring, S. K. Cancer letters 1996, 110, 93-96.
(24) Stefano, G. B.; Salzet, M.; Magazine, H. I.; Bilfinger, T. V. J. Cardiovasc. Pharm. 1998, 31, 813-820.
(25) Deng, W. G.; Montero, A. J.; Wu, K. K. Arterioscl. Throm. Vas. 2007, 27, 1752-1759.
(26) Coccia, E. M.; Stellacci, E.; Marziali, G.; Weiss, G.; Battistini, A. Int. Immunol. 2000, 12, 977-985.
(27) Cui, X.; Yang, S. C.; Sharma, S.; Heuze-Vourc'h, N.; Dubinett, S. M. Biochem. Bioph. Res.
Co. 2006, 343, 995-1001.
(28) Cho, W.; Kim, Y.; Jeoung, D. I.; Kim, Y. M.; Choe, J. Mol. Immunol. 2011, 48, 966-972.
(29) Guo, F. H.; Uetani, K.; Haque, S. J.; Williams, B. R.; Dweik, R. A.; Thunnissen, F. B.;
Calhoun, W.; Erzurum, S. C. J. Clin. Invest. 1997, 100, 829-838.
(30) Spector, W. G.; Willoughby, D. A. Bacteriol. Rev. 1963, 27, 117-154.
(31) Tohda, C.; Nakayama, N.; Hatanaka, F.; Komatsu, K. Evid. Based Complement Alternat.
Med. 2006, 3, 255-260.
(32) Cuzzocrea, S.; Zingarelli, B.; Calapai, G.; Nava, F.; Caputi, A. P. Life Sci. 1997, 60, 215-220.
(33) Pan, M. H.; Lai, C. S.; Dushenkov, S.; Ho, C. T. J. Agr. Food Chem. 2009, 57, 4467-4477.
(34) Dawson, J.; Sedgwick, A. D.; Edwards, J. C.; Lees, P. Int. J. Tiss. Teact. 1991, 13, 171-185.
(35) Chaturvedi, P. Evid. Based Complement Alternat. Med. 2008, 5, 55-59.
(36) Zimmermann, M. Pain 1983, 16, 109-110.
(37) Chang, H. Y.; Sheu, M. J.; Yang, C. H.; Lu, T. C.; Chang, Y. S.; Peng, W. H.; Huang, S. S.;
Huang, G. J. Evid. Based Complement Alternat. Med. 2009.
(38) Flohe, L.; Otting, F. Methods Enzymol. 1984, 105, 93-104.
(39) Aebi, H. Methods Enzymol. 1984, 105, 121-126.
(40) Paglia, D. E.; Valentine, W. N. J. Lab. Clin. Med. 1967, 70, 158-169.
Table of Contents Graphic


![TraditionalMLCalgorithmsmainlytacklethebatchMLCproblem,wheretheinputdataarepresentedinabatch[24,28].Nevertheless,inmanyMLCapplicationssuchase-mailcategorization[22],multi-labelexamplesarriveasastream.Onlineanalysisistherefore dimensionreducermotivatedbyma](data:image/gif;base64,R0lGODlhAQABAIAAAP///wAAACH5BAEAAAAALAAAAAABAAEAAAICRAEAOw==)