Journal of Chemical and Pharmaceutical Research, 2014, 6(6):1584-1590
Research Article ISSN : 0975-7384 CODEN(USA) : JCPRC5
Image copy-move tamper blind detection algorithm based on integrated feature vectors
Yanfen Gan
1and Junliu Zhong
21Information Science and Technology Department, Guangdong University of Foreign Studies South China Business College, Guangzhou, China
2College of Information Engineering, Guangdong Mechanical & Electrical College, Guangzhou, China ____________________________________________________________________________________________
ABSTRACT
Copy-Move method is a simple effective tampering algorithm in digital image tamper, and regarding regional copy-move post-processing, existing detection algorithms are poor in robustness and high in time complexity. This dissertation provides a blind detection algorithm based on integrated eigenvector. This algorithm extracts from each image block the Tamura texture features and average gray-value information to make up integrated feature vectors and then sorts the feature vectors in a dictionary sorting method, and finally calculates the similarity among the image blocks by using confidence distance so as to detect and locate any tampered regions. The experimental result suggests that this algorithm can not only effectively detect and locate the tampered image regions but also effectively resist multiple post-processing of regional copy-move, including rotation, Gaussian noise addition, high/low pass filtering and JPEG compression, showing higher accuracy and lower time complexity than other algorithms.
Keywords: Image tamper; Texture; Region copy-move; Robustness
____________________________________________________________________________________________
INTRODUCTION
In digital image tampers, a common operation is to copy and paste part of an image to override the figures or objects in the image. Such an operation is widely applied because it generates no obvious change in the image brightness, color, etc. and thus will not induce visual suspicion from a viewer. The passive blind detection for digital image tamper means to detect whether an image is tampered with since its shooting without watermark embedded in advance.
Though most of tampers would not induce visual suspicion, they will inevitably cause changes in image statistical properties. The tamper detection technique, significant in application value, can analyze such statistical property changes to judge image authenticity and integrity while they have no special requirements on digital cameras used for shooting.
Recent years, the blind detection technique for digital image tampers is now at its startup stage. Over the past few years, some scholars worked out some of detection algorithms concerning digital image authenticity, which can be independent of digital watermark or specific hardware and tell whether a digital image is tampered with. In the literature [2], Fridrich presents an algorithm that first uses overlap blocks to partition an image and then gives a dictionary sort of the image block’s DCT quantization coefficient to detect a forged region produced by any image copy. Popescu also gives a similar algorithm to detect image duplicate regions, which uses Principal Component Analysis (PCA) for an image block to reduce its dimensions and then uses the resulting dimensional reduction feature as the block’s feature description so as to reduce the feature space dimensions. But Fridrich’s method is for detection on the images without being post-processed, therefore inadequate to resist post-processing. Literature [3] uses SIFT
copy-move regions but cannot detect smaller ones; literature [5] first partitions a tampered color image and then calculates the statistical feature value for each of partitioned blocks, thus being able to find the copy-move regions and has stronger anti-noise, however larger in calculated amount too. Literature [8] extracts Tamura texture feature vector and Literature [9] extracts Krawtehouk invariant-moment feature vector, less in dimensions while weaker in post-processing resisting.
On that account, this paper proposes a tamper detection algorithm based on image Tamura texture feature and average gray value information, which uses 7 attributes of the texture feature and average gray value information to make up the image feature vectors, thus reducing the feature-vector dimensions and time complexity, and can effectively resist multiple post-processing for regional copy and detect and locate any tampered regions.
EXPERIMENTAL SECTION
2. Relevant Feature Extraction Theoretical Knowledge 2.1 Images’ Tamura Texture Feature
The texture feature is a kind of visual feature, independent of color or brightness, to reflect homogeneity in an image.
It is an inherent feature common to all objects like clouds, trees, bricks and fabrics, containing important information of an object's surface structure and tissue as well as their relationship with ambient environment. On that account, the texture feature is widely applied to content-based image retrievals. By giving an image with certain texture, users can search for other images with the similar texture. The features described by existing texture algorithms are ambiguous in physical attribute or visual characteristics, leading to inconsistency between retrieval result and visual perception, thus the formed retrieval system has an unfriendly user interface. In 1978, based on the psychological study regarding human visual perception of textures, Tamura, etc. presented Tamura expression for texture features. The 6 components of Tamura feature correspond to 6 attributes of a texture feature in the psychological perspective, in which roughness, contrast and orientation are applied well in the fields of texture synthesis and image identification.
1) Roughness – regarding a texture mode with different structures, larger sizes of primitives or fewer repetitions of primitives will cause rougher feeling to a viewer. The roughness can be obtained by calculating the Sbest mean value of an entire image:
∑∑ ( )
= =
= ×
mi n
j best
crs
S i j
n F m
1 1
1 ,
(1) 2) Contrast – the brightness levels between the brightest white in the light region and the darkest black in the dark region within an image. A larger difference between pixels denotes a larger contrast, and vice versa. For each pixel domain, calculating its statistical properties as mean value, square deviation and kurtosis can measure the global variable of contrast within an entire image or region. Its calculation formula is:
4 1
α
4= σ F
con(2)
Therein,
σ
is the standard deviation of image gray scale;α
4denotes the kurtosis of image gray value, defined by4 4
4
σ
α = u
;u
4is the mean value of four moments;σ
2denotes the square deviation of image gray value.3) Orientation – used for describing how textures scatter or concentrate along certain orientation and related with textural primitive shapes and arrangement rules. In an image, the pixels take on a pattern of straight line or approximate straight line in certain orientation, showing the characteristic of orientation. The image’s overall orientation can be obtained by calculating the peak sharpness within
θ
histogram:) ( ) ( φ φ
2φ
φε D
n
p w
p
dir
H
F
p
p
∑ ∑ −
=
(3) Therein, p denotes certain peak value; Wp denotes the peak range between valleys. This feature represents the consistency in orientation of an entire image. The formulas (1)-(3) derive from literature [7].
2.2 Image Block Average gray-value Information Extraction
On the tampered grayscale image A, you can disintegrate an overlap block from upper left corner to lower right corner.
If the A size is M×N and the overlap block size is b
×
b, you can get (M−b+1)×(N−b+1) overlap blocks; as per row priority, record 4 features of each image block and use vector to represent as Vi =(C1 ,C2 ,C3, C4) to calculate the brightness component of the color image block:B G
R
Y =0.299 +0.587 +0.114 (4) Use C1 ,C2 ,C3, C4 to respectively record Y component’s features in the following 4 orientations as formula(5) and Fig.1 shows:
)) 2 ( )
1 ( /(
) 1
( part sum part sum part sum
C
i= +
i=1,2,3,4 (5)Fig. 1 Four disintegration modes
The feature rationality has been proved in literature [5]. Vi =(C1 ,C2 ,C3, C4) representing image blocks’ “average gray-value ” information, equivalent to direct current or low frequency component data, provides better robustness for various post-processing of regional copy tamper.
3. Image Tamper Blind Detection Algorithm Based on Texture Feature and Average gray-value Information This algorithm selects orientation, contrast and roughness, the 3 attributes of Tamura texture feature, as 3 feature vectors of an image block, together with 4 feature vectors of the block’s average gray-value information, thus totally 7 vectors, in the detection process as shown by the Fig.2 below:
Fig. 2 Flowchart of the algorithm
All the experiments are done in the environment of Windows 7 system with CPU of Intel Core Quad i5, 2GB memory, and Matlab 7 software. The tampered image used for the experimental simulation is an RGB color image obtained through Photoshop treatment; you can do as per the above theoretical knowledge in the following steps:
×
Step2: First calculate Tamura texture feature’s 3 components fcrs ,fcon ,fdir, and then extract image block average gray-value information Vi =(C1 ,C2 ,C3, C4), finally obtain 7 feature value Vi =(fcrs ,fcon ,fdir ,C1 ,C2 ,C3 ,C4), and form them into a row vector Ui, in which i is the row vector order, L= (M-b+1)
×
(N-b+1)row vectors, resulting in matrix U with dimensions of L×N, in which N is the number of each row vector.Step3: sort matrix U in a dictionary way; after sorting, mark the matrix as S with the same dimensions as U, marking as Si (i=1,2,…L) which is S’s no. i row; use(xi, yi) to record S sub-block coordinate at the upper-left corner corresponding to U.
Step4: mark adjacent Si and Sj blocks’ upper-left-corner coordinates as(xi, yi) and (xj, yj)respectively; calculate the adjacent Si and Sj blocks’ distance difference Lmax and correlation coefficient
ρ
(Si,Sj),
L
max=
( x
i− x
j) (
2+ y
i− y
j)
2 , Si and Sj blocks’ feature vectors Vi and Vj; give similarity match detection to pearson correlation-coefficient detecting method belonging to statistics:
( ) ( )( )
( ) ∑ ( )
∑
∑
=
=
=
−
−
−
−
=
Li
j j L
i
i i L
i
j j i i j
i
S S S
S
S S S S S
S
1
2 1
2
,
1ρ
(6)
If
ρ
(Si,Sj)>T, Lmax>a are met, it is indicated that a tampered region is present in an image; record corresponding (xi, yi) and (xj, yj); mark in white the two regions using (xi, yi) and (xj, yj) as their upper-left-corner coordinates.
RESULTS AND DISCUSSION
4. Algorithm Experimental Results & Analysis
To prove the effectiveness of the blind detection algorithm, an experimental verification is made by using a 256 grayscale map of 512
×
512 size (an RGB image can be transformed into a grayscale image). By regional copy tamper on randomly selected 200 images, conduct post-processing of the tampered images (including rotation, Gaussian noise addition, high-pass and low-pass filtering and JPEG compression), and then compare the changes between original blocks and tampered blocks, using formula (6) to obtain correlation coefficientρ
(Si, Sj). From the experimental result, when the threshold T is 0.95, this algorithm will have the lowest rates of falseness and omission, so the threshold T is set to 0.95. During the match between adjacent blocks, if there is any overlap area between two blocks, they will be highly similar to each other, which is likely to cause false report; because the block size is 8
×
8, the distance difference isL
max>
8 × 8 + 8 × 8 ≈
15; during the detection course, as the image is likely to be treated with unknown post-processing, the detected blocks are surely different in shape from original tampered blocks;according to literature [5], if a large area of similar regions are detected in an image, they are likely the tampered ones by regional copy; the algorithm herein also regards that as the criterion to judge image tamper. If an image size is 512
×
512, we can define the region area threshold as ST >β
×512×512×0.85%, βis damage coefficient; after tampering with regions of different size in 200 images, we get β=55%. Meanwhile, the difference between copied-moved area and original area is limited, Si−Sj /max(Si,Sj)<7%4.1 Anti-rotation robustness detection
In this exper iment, with a jpeg image of 512
×
512 selected first, tamper with the image by using photoshop software;rotate the copied regions in clockwise 0°, 90°, 180° and 270° respectively and then paste them; the result, as Fig.3 shown below, suggests that the algorithm can correctly detect both the tampers without rotation and those after rotation.
(a)Original image (b) Copy-paste forgery image (c) 0°rotation
(d) 90°rotation (e) 180°rotation (f) 270°rotation Fig. 3 Detection figure of different rotation angles
4.2 Anti-scaling robustness detection
In this experiment, the same image is selected for tamper. Since over-scaling may highlight the tampers, the copied region is scale down and up by 1/5 respectively and then pasted; the result, as shown by the Fig.4 below, suggests that this algorithm can correctly detect the tampers made by certain scaling.
(a)Original image (b) scale down 1/5 (c) scale up by 1/5 Fig. 4 Robustness testing of anti-scaling
4.3 Anti-noise addition and lossy compression robustness detections
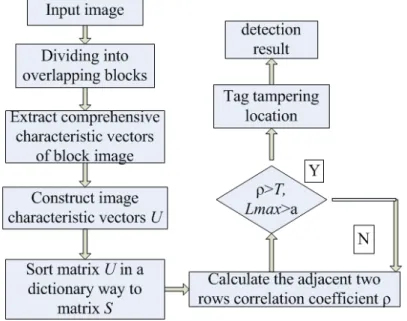
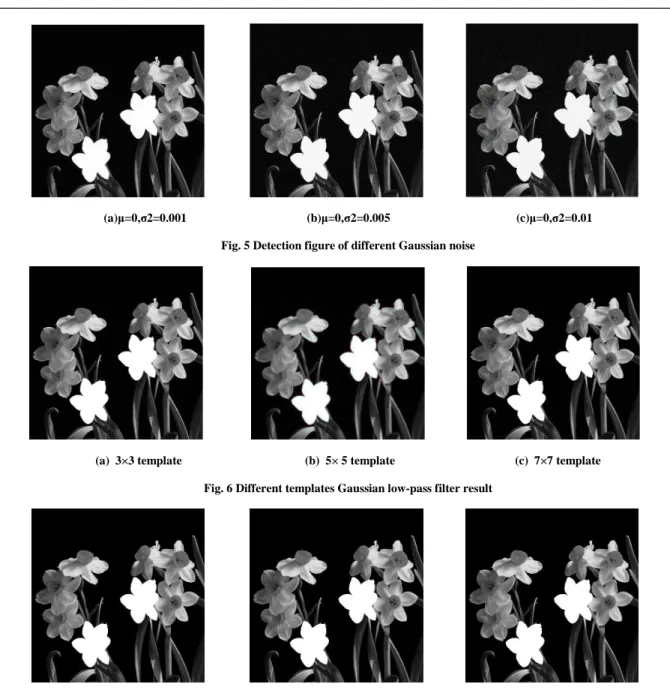
To prove the anti-noise addition and lossy compression robustness detections, Fig.5 is processed with different Gaussian noise addition µ=0 ,σ2=0.001 , µ=0 ,σ2=0.005 , µ=0 ,σ2=0.01, Fig.6 is processed with different Gaussian low pass filter with 3×3 template,5×5 template,7×7 template, and Fig.7 is added with different compression factors50,75,85.
(a)µ=0,σ2=0.001 (b)µ=0,σ2=0.005 (c)µ=0,σ2=0.01 Fig. 5 Detection figure of different Gaussian noise
(a) 3×3 template (b) 5× 5 template (c) 7×7 template Fig. 6 Different templates Gaussian low-pass filter result
(a)Quality factor 50 (b)Quality factor 75 (c)Quality factor 85 Fig. 7.Detection figure of different quality factor
From the experimental result, after adding noise to an image, the detection can work well though its effect will slightly decline with the increase in noise factors; the robustness regarding the high and low-pass filtering does not decline with the enlargement in templates, showing better stability; regarding the increase in compression factors, the tampered regions can be correctly detected despite corresponding decline in the detection effect.
4.4 Experimental result comparison and analysis
To better explain the detection accuracy, this algorithm and literature [1][2][5] give comparisons in false reject rate and missing rate of the tamper detection. The comparison result, shown in Table 1, suggests that this algorithm is highly accurate in detecting the tampered regions.
Table 1 Comparison in False Reject Rate & Missing Rate
Algorithm false reject rate missing rate
Literature [1] 5% 4.1%
Literature [2] 4.5% 3.6%
Literature [5] 4.3% 2.5%
This Algorithm 3% 2.4%
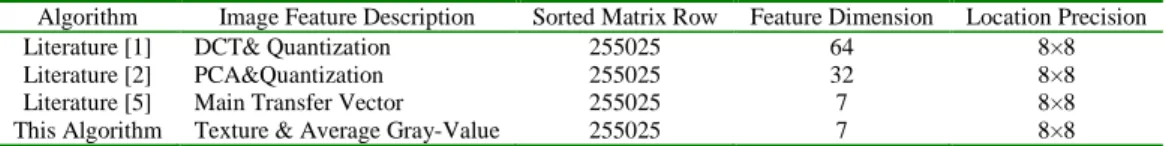
Time complexity is a bottleneck of the algorithms based on block matching. Taking a grayscale image of 512×512 size, this algorithm is compared with literature [1][2][5]. The comparison result, shown in Table 2, suggests that, with the same block quantity and size, the feature dimensions extracted by this algorithm are far less than the algorithms in literature [1] and [2] and equal to that of literature [5], giving a significant reduction in time complexity.
Table 2 Copy-Move Tamper Detection Algorithm Comparison
Algorithm Image Feature Description Sorted Matrix Row Feature Dimension Location Precision
Literature [1] DCT& Quantization 255025 64 8×8
Literature [2] PCA&Quantization 255025 32 8×8
Literature [5] Main Transfer Vector 255025 7 8×8
This Algorithm Texture & Average Gray-Value 255025 7 8×8
CONCLUSION
Digital image region-copy tamper is a partial tampering technique operated within one image. Because its operation is simple and furthermore the tampered image may appear almost true due to the consistency in brightness, noise, color, etc. within one image, this kind of tamper has been extensively applied in digital image forgery; therefore its research is of larger practical significance. Regarding region-copy post-processing, existing detection algorithms are poor in robustness and high in time complexity. This dissertation provides a blind detection algorithm based on image Tamura texture feature and average gray-value information. This algorithm extracts from each partitioned image block the texture features and gray mean features to make up integrated feature vectors and then sorts the feature vectors in a dictionary sorting method, and finally calculates the similarity among the image blocks by using Euclidean distance so as to detect and locate any tampered image regions. The experimental result suggests that this algorithm can not only effectively detect and locate the tampered regions but also effectively resist multiple post-processing of regional copy, including Gaussian blur, additive white Gaussian noise, JPEG compression and their mixture, thus showing higher accuracy and lower time complexity in such tamper detection.
REFERENCES
[1] Fridrich J, Soukal D,Lukas J. Detection of Copy-Move Forgery in Digital Images. Proceedings of Digital Forensic Research Workshop, Cleveland, 2003.
[2] Popescu A C, Farid H. Exposing digital forgeries by detecting duplicated image regions, TR2004-515 . Hanover, NH, USA: Dartmouth College.
[3] Huang Hailing, Guo Weiqiang, Zhang Yu. Detection of Copy-Move forgery in digital images using SIFT algorithm//Computational Intelligence and industrial Application,2008. Wuhan, China: Pacific-Asia Workshop,2008:272-276.
[4] Zhang Jing, Feng zhanglei, Su Yuting. A new approach for detecting Copy-Move forgery in digital images//11th ieee singapore international conference on commication systems. Guangzhou, China: Ieee,2008:362-366.
[5]Luo Weiqi,Huang Jiwu,Qiu Guoping. Chinese journal of computers. 2007,30(11):1998-2006.
[6]Tamura H, Mori S,Yamawaki T. IEEE Trans On Systems,Man and Cybernetics,1978,Smc-8(6):460-473.
[7] Lv Xiaoqi , Guo jinge, Zhao Yuhong, Ren Xiaoying, Chinese Journal of Tissue Engineering Research, 2012,16(17):3160-3163.
[8] Zhao Wei, Wang Tao, Lv Wanli, et al.Blind detection of copy-move forgery in digital images based on Tamura texture features. Computer Engineering and Applications.
http://www.cnki.net/kcms/detail/11.2127.TP.20120716.1500.028.html.
[9]Jiang Li, Zhou Shaoqiong. Computer Technology And Development. Vol.2l, No.5 May, 2011:48-51.