行政院國家科學委員會專題研究計畫成果報告
證券化與不動產市場效率
Secur itization and Real Estate Mar ket Efficiency
計畫編號:NSC 88-2416-H-002-021
執行期限:87 年 8 月 1 日至 88 年 7 月 31 日
主持人:廖咸興 執行機構:國立台灣大學
一、中文摘要
不動產市場以缺乏效率著名。這是因為 不動產具高度異質性、高交易成本、以及缺乏 充分交易資訊所致。此外,不動產的低流動性 也是造成不動產價格無法反映其基本價值的 主要原因。證券化被廣泛討作為提昇不動產市 場效率的一種方式,因為一般相信與個別交易 市場比較,在公開市場上,資產價格將較接近 其基本價值。然而,有系統的探討上述兩市場 訂價差異並提供嚴謹實證證據的研究相當 少。本研究將藉對香港市場的研究來探討上述 議題。本研究的實證解果卻與上述預期相反。 我們在證券化的市場發現了泡沫現象,卻未在 未在證券化的不動產市場中看到。有三種可能 的原因來解釋此現象(1)由於未在證券化的不 動產市場,投資人承擔了極大的流動性風險, 因此投資人決策會較審慎,產生泡沫現象的機 會也較少;(2) 由於未在證券化的不動產市 場,投資金額龐大,投資人有財富上的限制, 此類投資人通常較有經驗,不易受到傳言影 響。反之,證券化市場較無經驗小額投資人也 可參與,容易造成泡沫現象。(3) 相較於未在 證券化的市場,在證券化的市場中的投資人, 可能因為認為面臨的流動性風險極低,而從事 大膽的投機行為,因而提供產生泡沫現象的環 境。本研究可提供以下啟示:再決定市場效率 性時,市場投資人之組成可能比市場結構還重 要。而投資人風險的認知更是決定投資人投資 行為的重要因素。最後由本研究可知,證券化 並非達到市場效率的充分調瑱。關鍵詞:證券化、不動產市場效率專
Abstr act
Real estate market is notorious for its lack of efficiency. Securitization is widely discussed as one of the ways to improve the efficiency of real estate market. It is believed that real estate price in a securitized market (later restated as public market) will be closer to
its fundamental value than in a non-securutized one (later restated as private market). However, few studies have systematically examined the pricing differences between the two markets and have provided vigorous empirical evidence to support that belief. This study, hence, use data from Hong Kong market to address the above issue. Our empirical results are opposite to our expectation. We found speculative bubble in the securitized real estate market during the sample period but failed to find it in the private real estate market. There are three possible explanations. First, since the liquidity risk in private market is much higher than in public market, the investors in private market will more prudently doing their real estate investments. Therefore, there is less opportunity to generate speculative bubble. Second, in private market, the investors are limited to those who are wealthy enough to invest one single big amounts of money in real estate properties. On the contrary, in public market, the wealth constraint is much lower and investor base is much larger. In public market, many participants are unsophisticated investors. Therefore, it is much easier to brew speculative bubbles in public market. Third, comparing to high liquidity risk in private market, participants in public markets may believe that they are exposed to much less liquidity risk. Investors in public market may behave more aggressively than do those in private market. The perception of less risk exposure provides a foundation for forming speculative bubbles. Our finding has significant implication. The composition of investors may be more important than market structure itself in determining market efficiency. In addition, the perception of risk exposure may also play an important role in determining investors’ behavior. It is also worth noting that securitization is not a means sufficient to achieve market efficient.
Keywor ds:Secur itization, Real estate
mar ket efficiency
I. Intr oduction
Real estate market is notorious for its lack of efficiency. The common belief is based upon the following facts: the heterogeneity of the properties, the high transaction cost, and the lack of sufficient information flows about the traded property. The illiquidity of real estate properties also contributes to the fact that real estate property price may not reflect the value of its return generating ability. Securitization is widely discussed as one of the ways to improve the efficiency of real estate market. It is believed that real estate price in a securitized market (later restated as public market) will be closer to its fundamental value than in a non-securutized one (later restated as private market). However, few studies have systematically examined the pricing differences between the two markets and have provided vigorous empirical evidence to support that belief. This study, hence, use data from Hong Kong market to address the above issue. Hong Kong is a major Asian market (probably the second most expensive real estate market in the world after Tokyo), which have systematically collected both the private and public real estate market data on a regular and homogeneous basis since 1980. Hong Kong provides an ideal case for studying the issue.
According to West (1987) and Dezhbakhsh and Demirguc-Kunt (1990), previous studies in stock market, it is defined as “not efficient” (or called “existence of bubble”) that in a relatively long run an asset price persistently deviates from its fundamental value which reflecting its return generating ability1. To examine the efficiency of the two markets, this study, therefore, will examine property prices in both public and private real estate markets to see whether there is significant price-fundamental value deviation in the two markets. A better understanding of the pricing difference of the two markets will not only help institutional investors allocate their assets among real estate and other financial markets but will also provide policy-makers sound
1 The persistent deviation of asset prices away from
the expected future dividends or incomes, if induced by self-fulfilling rumors, is referred to as speculative bubbles. (See LeRoy and Porter (1981), Shiller (1981), Blanchard and Watson (1982)).
theoretical supports to form the their asset securitization policies
To test the existence of speculative bubbles in both private and public markets, this paper uses the procedure proposed by West (1987) and refined by Dezhbakhsh and Demirguc-Kunt (1990). The procedure includes Hansen and Chow specification tests on the arbitrage equation which yield the discount rate, Box-Pierce chisquare test on the return generating process and Ramsey and PSW differencing tests on no-bubble hypothesis.
The rest of the paper is arranged as follows. In Section II, we introduce the model and the methodologies for testing the existence of speculative bubbles. In Section III, we described the data we use in the empirical testing. Section IV shows the empirical results. Section V is the conclusion.
II. Methodologies.
To examine the efficiency of the both the public and the private markets, this study, therefore, will examine property prices in both markets to see whether there is significant price-fundamental value deviation in the two markets. That is, if
Pt =Pt* +Bt
where Pt is the asset price, Pt* the present value of all expected future dividends (or casflows), reflects the market fundamentals, and Bt represent the deviation between asset price and its fundamental value. The main job of this study to test whether Bt is exist, namely whether Btis significant from 0.
According to West (1987) and Dezhbakhsh and Demirguc-Kunt (1990), a more technical description of the methodology is as follows:
In a rational expectations model, an asset's price is determined by the following arbitrage relation:
(1)
P
E P
d
t =
θ
(( t+1+ t+1)|Ωt)where P and d are the real price and the real dividend2 of an asset. Ωt is the
2 Here, dividend indicates cash flows of an asset
information available to the public at time t, θ = (1+r)-1 is the discount factor, and r is the discount rate. Equation (1) merely states that the equilibrium asset price should be the expected future cash flows, including future price and dividends, properly discounted to the present values.
The forward-looking solution to equation (1) is (2)
P
E d
t i i t i t *(
|
)
=
= ∞ +∑
θ
1Ω
where Pt* is the present value of all expected future dividends. It reflects the market fundamentals when bubbles do not exist. However, it is not the only solution to equation (1). The general solution to equation (1) is
(3)
P
P
B
t
=
t+
t*
where Bt denotes speculative bubbles which satisfy the following equation
(4)
θE B
( t+1|Ωt)−B
t =0Equation (4) shows that a bubble is self-fulfilling, while equation (3) shows that a bubble causes the market price to stay away from an asset's market fundamentals.
In order to test for the existence of speculative bubbles, we need to turn the above model into regression equations. We first write the market fundamental equation (2) as:
(5)
P
tE d
H
z
i i t i t t *(
|
)
=
+
= ∞ +∑
θ
1 wherez
t iE d
E d
H
t i t t i t=
∑
∞θ
+−
+ 1[ (
|
Ω
)
(
|
)]
, Ht is the information only on the current and past dividends. Therefore E(dt+i|Ht) is the forecast of future dividends based on the current and the past dividends. And Pt* is the sum of the present value of the total expected dividends conditional on the past dividend history. Following West (1987) and Dezhbakhsh and Demirguc-Kunt (1990), we use the autoregressive part of the ARIMA model to proxy the dividend process. This approachuses data to determine the proper model for the dividend process, which has the advantage of avoiding theoretical controversy. Suppose we identify the dividend process as
(6)
d
t=
ϕ ϕ
o+
1d
t−1+ +
...
ϕ
qd
t q−+
ε
twe can then substitute equation (6) to equation (5) to obtain
(7)
P
t* od
t qd
t qz
t...
=
β
+
β
1+ +
β
− +1+
which states the regression equation when speculative bubbles do not exist. Substitute equation (7) into (3). We obtain the regression form for (3)(8)
P
t=
β
o+
β
1d
t+ +
...
β
qd
t q− +1+ +
B
tz
tThe no bubble hypothesis implies that Bt=0.
In sum, the the no bubble hypothesis can be tested by the following procedure: First, using Box-Jenking technique and Box-Pierce chisquare test to identify and test the specification of the return generating process, equation (6). Then we use Hansen (1982) and Chow tests to do the specification test of equation (5)3. If it is corrected specified, then we remove Bt from equation (8) 4 and test whether equation (8) without the Bt term is misspecified using the Ramsey’s RESET test and the differencing test5. The no-bubble hypothesis can be stated as
H
B
H
B
t t 0 10
0
:
:
=
≠
Ramsey's RESET test is conducted by adding the power terms of the explanatory variables to the original regression model and
3 We use the fitted values of the dividend equation to
estimate the parameters of equation (5) when applying Hansen test. We cut the whole sample period into two subsample period of equal length when doing the Chow test.
4
When the dividend process is integrated, the distributed equations (7) and (8) are written in differenced form. The form is written as follows:
∆
P
t*=
β
o+
β
1∆
d
t−1+ +
...
β
q∆
d
t q−+
z
t 5 Proposed by Plosser, Schwert, and White (PSW,computing the F statistics for these added power terms to determine if they are statistically different from zero. PSW's differencing test is conducted by comparing the parameter estimates of the original model with the parameter estimates of the first difference model to determine if they are statistically different from each other. If both tests show statistically insignificant, we cannot reject the null hypothesis.
III. The Data
This study use both the appraisal-based data and security market-based data to measure private and public real estate markets. Data series for the private market are quarterly property price index - all private domestic premises and rental index - all private domestic premises. The data are obtained from HKNADJ. Data series for public real estate market are quarterly dividends and prices on the Hong Kong property company index. The index is made of major real estate companies listed on the Hong Kong Stock Exchange. The data are obtain from Datastream. Because of the constraint of the availability of private market data, our data set starts from the first quarter of 1980 and ends at second quarter of 1996.
IV. Empir ical Results
Identifying the AR or der of the r etur n
gener ating pr ocess
Our empirical work starts from identifying the AR order of the return process (6) for both private market rents and public market dividends. We estimate analyze equation (6) with the Box-Jenkins techniques. Table 1 reports the results of estimating equation (6).
[Table 1 Her e]
We identify private market return generating process as an ARIMA(1,0,0) process and public market as an ARIMA(2,0,0) process. The modified Box-Pierce (Ljung-Box) Q statistics are all insignificant in both series confirming the appropriateness of our fits.
Testing the no-bubble hypothesis
The first step to test the no-bubble hypothesis is to test the specification of the estimation of equation (5). We use Hansen test
and Chow test to do the specification tests as described previously. The results are reported in table 2. The residuals are white noise as indicated by insignificant
(
ρ
ˆ
1)
. This indicatesthat expectations are rational. The Chow test statistics are insignificant. This shows that within sample period, the discount rate is statistically time-varying. From above result, we can reasonably conclude that the specification of equation (5) and the dividend process are adequate6. We can, therefore, test the no-bubble hypothesis by examining the specification of the equation (8).
[Table 2 her e]
In the second step of testing the no-bubble hypothesis, the differencing test and the RESET test are used. After omitting Bt from equation (8), we use the least square procedure to estimate the parameters of the equation for both markets and report the results in table 3. The Durbin-Watson statistics for both regressions are small are expected since the disturbance in equation (8) (also equation (5)) is defined to be serially correlated. Because the differencing test and the RESET test are not valid in the presence of serial correlation, we use the procedure suggested by Plosser et. al. (1982) to transform the data to make the disturbance white noise.
[Table 3 Her e]
Equation (8) indicates that in the absence of speculative bubbles, the real estate price can be expressed as a distributed lag of the current and past dividends (or rent). The order of the lagged dividends is the same as the order of the AR part of the dividend process minus 1. From Table 1, we know the order of this distributed lag. They are zero for the private market and one for the public market. Equation (8) is then estimated with Bt=0. The results are
summarized in Table 4. The
Durbin Watson statistic indicates that there
is
no
autocorrelation
problems
for
specification tests of both markets.
6
For private market, the Ramsey statistic is 1.265, which is insignificant at 5% significant level for an F-distribution with 3 and 59 degrees of freedom . The PSW differencing statistic is 2.70 which is insignificant at 5% for an F-distribution with 1 and 61 degrees of freedom. The results of the above two tests show that we cannot reject the null hypothesis of no speculative bubbles in private market. It implies that the a property’s value in private market reflects its fundamental value which is generated from its future expected returns.
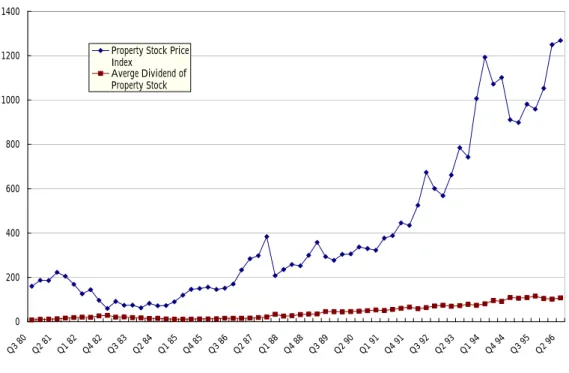
For public market, the Ramsey statistic is 14.35, which is significant at 5% for an F-distribution with 3 and 58 degrees of freedom . The PSW differencing statistic is 52.14 which is also significant at 5% for an F-distribution with 1 and 60 degrees of freedom. The results of the above two tests show that we should reject the null hypothesis of no speculative bubbles in public market. It implies that the a property’s value in public market deviates from its fundamental value which is generated from its future expected returns. Figure 1 and figure 2 present the time series plots of asset prices and returns for both market respectively. From the two figures we can also see that different relationship between asset prices and asset returns. The prices in public market also show larger deviation from its returns than do prices in private market.
[Table 4 Her e]
These results are opposite to our expectation. We found speculative bubble in the securitized real estate market during the sample period but failed to find it in the private real estate market. The results may be partly explained by three reasons: Firstly, since the liquidity risk in private market is much higher than in public market, the investors in private market will more prudently doing their real estate investments. Therefore, there is less opportunity to generate speculative bubble. Second, in private market, the investors are limited to those who are wealthy enough to invest one single big amounts of money in real estate properties. On the contrary, in public market, the wealth constraint is much lower and investor base is much larger. Besides, many
participants in public market are unsophisticated investors. It is therefore much easier to brew speculative bubbles in public market. Third, comparing to high liquidity risk in private market, participants in public markets may believe that they are exposed to very little liquidity risk. Investors in public market may behave more aggressively than do those in private market. The perception of little risk exposure also provides a foundation for forming speculative bubbles. Our findings has significant implication. The composition of investors may be more important than market structure itself in determining market efficiency. In addition, the perception of risk exposure may also play an important role in determining investors’ behavior. It is also worth noting that securitization is not a means sufficient to improve market efficient.
V. Conclusion
Speculative bubbles refer to the price movements of an asset that are induced by self-fulfilling rumors. Speculative bubbles channel useful investment funds to pursue an investment instrument that does not have equal fundamental values. So the existence of speculative bubbles can cause misapplication of resources. In addition, when speculative bubbles burst, the investors end up in serious financial troubles. This phenomenon is especially serious in the real estate market because it is a large part of economy. The real estate market are susceptible to the self-fulfilling rumors for its lack of information and illiquidity. In this paper, we examine the existence of speculative bubbles in both private and public the real estate market using data of Hong Kong markets.
Our empirical results are opposite to our expectation. We found speculative bubble in the securitized real estate market during the sample period but failed to find it in the private real estate market. There are three possible explanations. First, since the liquidity risk in private market is much higher than in public market, the investors in private market will more prudently doing their real estate investments. Therefore, there is less opportunity to generate speculative bubble. Second, in private market, the investors are limited to those who are wealthy enough to invest one single big amounts
of money in real estate properties. On the contrary, in public market, the wealth constraint is much lower and investor base is much larger. In public market, many participants are unsophisticated investors. Therefore, it is much easier to brew speculative bubbles in public market. Third, comparing to high liquidity risk in private market, participants in public markets may believe that they are exposed to very little liquidity risk. Investors in public market may behave more aggressively than do those in private market. The perception of little risk exposure provides a foundation for forming speculative bubbles. Our finding has significant implication. The composition of investors may be more important than market structure itself in determining market efficiency. In addition, the perception of risk exposure may also play an important role in determining investors’ behavior. It is also worth noting that securitization is not a means sufficient to improve market efficient.
Refer ence
Blanchard, O. J. and M. W. Watson. 1982
"Bubbles, Rational Expectations and Financial Markets." In Crises in Economic and Financial Structure. P. Wachtel, ed. Lexington, MA: Lexington Books, pp.295-315.Dezhbakhsh, Hashem and Asli Demirguc-Kunt, March 1990, "On the Presence of Speculative Bubbles in Stock Prices" Journal of Financial and Quantitative Analysis, Vol. 25, No. 1, pp.101-112. Diba, B. T. and H. I. Grossman, June. 1988
"Explosive Rational Bubbles in Stock Prices?" American Economic Review, 78, pp.520-530. Gyourko, Joseph, and Donald B. Keim, 1992, "What
Does the Stock market Tell Us About Real Estate Returns?" Journal of American Real Estate Economics Association, V20, No.3, pp.457-484. Hamilton, J. D. Oct. 1986, "On Testing for
Self-Fulfilling Speculative Price Bubbles." International Economic Review, 27, pp.545-552.
LeRoy, S. F. and R. D. Porter, May 1981, "The Present-Value Relation: Tests Based On Implied Variance Bounds." Econometrica, 49, pp.555-574.
Liao, Hsien-hsing and Ahyee Lee, 1995, "Speculative Bubble and Equity Real Estate Investment Trusts (EREITs)-- An Empirical Investigation", The 1995 Annual Conference of American Real Estate and Urban Economics Association.
West, Kenneth D., August 1987 "A Specification Test for Speculative Bubbles" Quarterly Journal of Economics, pp.553-580.
West, Kenneth D., July 1988 "Bubbles, Fads and Stock Price Volatility Test: A Partial Evaluation" Journal of Finance, Vol. XLIII, No.3, pp.639-660.
Table 1
Results of Estimating equation (6)
d
t=
ϕ
o+
ϕ
1d
t−1+ +
...
ϕ
qd
t q−+
ε
tA. Rent gener ating pr ocess for pr ivate r eal estate pr oper ties
Parameter Estimates Models constant
ϕ
1 ARIMA(1,0,0) 0.010 0.604
(2.80) a (6.04)
Modified Box-Pierce (Ljung-Box) chi-square statistic Lag 12 24
Chi-square 5.5(DF=11) 14.8(DF=23) 36 48
24.2(DF=35) 34.0(DF=47) a
The figures in parenthesis are t statistics.
B. Dividend gener ating pr ocess for public estate pr oper ties
Parameter Estimates Models constant
ϕ
1
ϕ
2ARIMA(2,0,0) -0.326 0.802 0.237 (-0.870) a (6.44) (1.86) Modified Box-Pierce (Ljung-Box) chi-square statistic Lag 12 24
Chi-square 8.2(DF=10) 20.5(DF=22) 36 48
28.1(DF=34) 35.3(DF=46) a
Table 2
Results of Estimating equation (1)
P
t=
(
P
t+1+
d
t+1)
θ ε
+
t Parameter Estimates Marketθˆ
(
ρ
ˆ
1)
Hansen Statistic Chow Test Statistic Public 0.8697 (39.36)a -0.0470 (0.1460)b 0.00c 0.0885d Private 0.6341 (7.91)a -0.1518 (1.5442)b 1.25c 0.2064da. The figures in parenthesis are t statistics. b. The figures in parenthesis are Ljung-Box
Q-Statistics. The significance level for 0.1460 and 1.5442 are 0.7024 and 0.2140 respectively. The two statistics are not significant.
c. Both statistics are not si d. gnificant at 5% level.
e. The Chow test statistic is F(3, 59) and F(3, 62) respectively. Both statistics are not significant at 5% level .
Table 3
Results of Estimating equation (8)
P
t*=
o+
d
t+ +
...
qd
t q+
z
t− −
β
β
1 1β
A. Par ameter estimation for pr ivate r eal estate mar ket
β
0β
1 DWb 0.021 (2.60) 0.417 (2.12) 0.94 aDW indicates Durbin-Watson Statistics. bThe figures in parenthesis are t statistics.
B. Par ameter estimation for public r eal estate mar ket
β
0β
1β
2DW
a-22.35
(-0.83)
b3.023
(0.92)
7.416
(2.21)
0.58
aDW indicates Durbin-Watson Statistics. b
The figures in parenthesis are t statistics.
Table 4
Results of Estimating equation (7) using transformed data.
P
t od
t qd
t qz
t*
...
=
β
+
β
1 −1+ +
β
−+
A. Par ameter estimation and statistics of specification tests for pr ivate mar ketβ
0β
1 2R
DWa Ramsey c Test PSWd Test 0.005 (0.16)b 8.002 (1.88) 0.04 1.87 1.265 2.700 aDW indicates Durbin-Watson Statistics. b
The figures in parenthesis are t statistics. c For doing the RESET, we put in the
ˆ
2t
P
,P
ˆ
t3 andP
ˆ
t4 and test their joint significance. The RESET statistics is distributed as F(3,T-5) . The F-statistic is insignificant.d The statistics for PSW differencing test is distributed as F(1, T-3) . The F-statistic is insignificant
B. Par ameter estimation and statistics of specification tests for public mar ket
β
0β
1β
2 2R
DWa Ramseyc Test PSWd Test 13.74 (0.75)b 1.802 (1.15) 6.681 (4.18) 0.42 1.85 14.35 52.14 aDW indicates Durbin-Watson Statistics. b
The figures in parenthesis are t statistics. c For doing the RESET, we put in the
ˆ
2t
P
,P
ˆ
t3 andP
ˆ
t4 and test their joint significance. The RESET statistics is distributed as F(3,T-6) . The F-statistic is significant.d The statistics for PSW differencing test is distributed as F(1, T-3) . The F-statistic is significant.
Figure 1. Plot of quarterly price index and dividend of Hong Kong property stock
Figure 2. Plot of quarterly price and rental index offf Hong Kong properties
0 50 100 150 200 250 300 350 Q1 80 Q4 80 Q3 81 Q2 82 Q1 83 Q4 83 Q3 84 Q2 85 Q1 86 Q4 86 Q3 87 Q2 88 Q1 89 Q4 89 Q3 90 Q2 91 Q1 92 Q4 92 Q3 93 Q2 94 Q1 95 Q4 95 Rent Index Property Price Index
0 200 400 600 800 1000 1200 1400 Q3 80 Q2 81 Q1 82 Q4 82 Q3 83 Q2 84 Q1 85 Q4 85 Q3 86 Q2 87 Q1 88 Q4 88 Q3 89 Q2 90 Q1 91 Q4 91 Q3 92 Q2 93 Q1 94 Q4 94 Q3 95 Q2 96
Property Stock Price Index
Averge Dividend of Property Stock