i
國 立 交 通 大 學
生物資訊研究所
碩 士 論 文
蛋白質催化位置之結構特性
On the structural characteristics of protein catalytic sites
研 究 生:官慧雯
指導教授:黃鎮剛 教授
i
蛋白質催化位置之結構特性
學生:官慧雯
指導教授:黃鎮剛
國立交通大學生物資訊及系統生物研究所碩士班
摘
要
大 量 的 未知 功能蛋 白 質 結構 已經被 解 出 並存 放於蛋 白 質 資料 銀 行
(Protein Data Bank-PDB)。因此,藉著蛋白質結構來臆測其功能也變得相當
重要。為了達成這個目標,蛋白質結構-功能關係的知識將會成為非常有用。
藉著一個有著 887 個已知酵素結構且有 2368 個催化殘基的資料集我們提出
了一個非常廣泛的分析。我們發現(i) 多數的催化殘基不是有電性(charged)
就是有極性(polar); (ii) 催化殘基通常座落於纏繞區(coil region); (iii) 催化
位置通常較深層; (iv) 催化殘基具有較低的韌性(flexibility); (v) 催化位置
似乎較喜歡座落於接近蛋白質領域(domain)的中心; (vi) 催化位置通常發
生在蛋白質中較緊密的地方。我們的結果也提供了蛋白質催化殘基結構特
性的資訊,這個資訊和序列保存度具有互補關係。總而言之,我們的結果
在了解蛋白質結構-功能關係上也許會有幫助。更進一步而言,這樣的結果
也許在未來預測蛋白質催化位置上能提供發展新方法的新視野。
ii
On the structural characteristics of protein catalytic sites
Student: Huei-Wen Guan Advisor: Dr. Jenn-Kang Hwang
Institute of Bioinformatics and Systems Biology
National Chiao Tung University
ABSTRACT
An
enormous number of structures of proteins with unknown function has
been solved and deposited in PDB. Hence, it becomes increasingly important to
infer function directly from protein structures. To do this, the knowledge of
protein structure-function relationship will be valuable. We carried out a
comprehensive analysis of the dataset consisting of 887 enzymes of known
structure with a total of 2368 catalytic sites. We found that (i) most catalytic
residues are either charged or polar; (ii) catalytic sites are usually located on
coil region; (iii) catalytic sites are usually buried; (iv) catalytic residues appear
to be less flexible; (v) catalytic sites seem to prefer to be in the proximity of the
centroid of the domains; (vi) catalytic sites usually occur in the compact regions
of proteins. Our results also provide information of structural characterization
of catalytic residues in protein, which is complementary to that sequence
conservation. In summary, our results may be helpful in understanding the
protein structure-function relationship. Furthermore, they may give new insight
into developing novel methods for the prediction of catalytic sites in protein.
iii
誌謝
謝謝在研究這條路上幫助我,陪伴我,指導我的所有人。還有在生活
上支持我,鼓勵我,協助我的所有人。
iv
CONTENTS
中文摘要 ... i ABSTRACT ... ii 誌謝 ... iii CONTENTS ... iv TABLE CONTENTS ... v FIGURE CONTENTS ... vi 1. Introduction ... 12. Materials and Methods ... 3
2.1 Dataset of catalytic residues ... 3
2.2 Identification and Classification of catalytic sites ... 4
2.2.1 Amino acid type ... 4
2.2.2 Sequence conservation ... 4
2.2.3 Secondary structure ... 5
2.2.4 Relative Solvent Accessibility (RSA) ... 5
2.2.5 B-factor ... 6
2.2.6 Centroid-model (CM) ... 7
2.2.7 Weighted contact number model (WCN) ... 7
3. Results and Discussion ... 9
3.1 The distribution of amino acid types in catalytic sites ... 9
3.2 The characteristic feature profiles of catalytic residues ... 10
3.2.1 Sequence conservation profile ... 10
3.2.2 Secondary structure profile ... 10
3.2.3 Relative Solvent Accessibility (RSA) profile ... 11
3.2.4 Rigidity profile ... 12
3.3 The 2D-profiles of catalytic residues ... 13
4. Conclusion ... 15
REFRENCES ... 16
TABLE ... 18
FIGURES ... 19
v
TABLE CONTENTS
vi
FIGURE CONTENTS
Figure 1. The frequency of each amino acid type in catalytic sites ………...22
Figure 2. The histograms of the frequency between catalytic sites and all residues….……..23
Figure 3. Sequence conservation distributions for individual amino acid types……….26
Figure 4. Secondary structure_H,S,C distributions for individual amino acid types………..28
Figure 5. Secondary structure_H,B,E,G,I,T,S,U distributions for individual amino acid types ………...30
Figure 6. RSA_binary model distribution for individual amino acid types………32
Figure 7. RSA_ternary model distribution for individual amino acid types………...34
Figure 8. zB-factor distribution for individual amino acid types………....36
Figure 9. CM distribution for individual amino acid types...38
Figure 10. WCN distribution for individual amino acid types ………...40
Figure 11. The XY-plot of 2-D profile ………42
1
1. Introduction
Enzymes play an important role in controlling and performing most life process. Therefore, understanding the characteristics of catalytic sites will help us realize how enzymes work. Most enzymes are proteins and their catalytic machinery occurs in a relatively small region.1 The regions of an enzyme designed to directly interact with substrates, are defined as catalytic sites. The side-chain of catalytic residues are usually polar or charged1: imidazole group of histidine, guauidinium group of arginine, amine group of lysine, carboxylate group of glutamate and aspartate, amide group of glutamine and asparagines, hydroxyl group of serine, threonine and tyrosine, and thiol group of cysteine. We consider the functions of the amino acid’s side chain as the overall structure and dynamics of enzymes in catalysis.2
The first enzyme structure was the X-ray structure of lysozyme solved in 19652. Since then, a huge number of determined enzyme structures have been stored in database. Because of the Structural Genomics Project, an increasing number of structures with unknown function were deposited in the Protein Data Bank (PDB). The vast number of structures allows us to study the structure-function relationship directly from the protein structures. Then, it is still a challenging task that using only protein structures deduce catalytic sites function.
There are many previous studies identifying and predicting the catalytic sites of enzymes. First, sequence and structural similarity based methods are the most used to recognize catalytic residues in a query enzyme. For example, a number of methods 3-8 based on the observation that most catalytic sites are highly conserved in sequence and structure; Thorton et al. 4,5developed a methodology, utilizing a library of 3D structural templates
2
formed from small number of residues to recognize catalytic sites of proteins. However, we do not have to do any sequence or structure alignment in our study. We only utilize the unique structural characteristic of enzymes to analyze catalytic sites. Then, the distinct property of large force constants associated with the catalytic residues is consistent with the recent study 9,10 that the catalytic residues usually have lower B-factors than noncatalytic residues. A residue with lower B-factors will be less flexible (i.e., more rigid). Ben-Shimon and Eisentein11 then observed that the catalytic residues are usually located in small fractions of the exposed residues closet to the protein centroid. Some literature 12,13 show that the B-factor of the atom is linearly proportional to its squared distance from the protein centriod. In another word, the residues in proximity to the protein centriod will have lower thermal fluctuation or more rigid than those further residues. Besides, a recent study 14 shows that the atom’s thermal fluctuations are linear inverse proportion to the protein contact number of this atom. It means that a residue has lower flexibility also more compact in structure. For all of this, catalytic sites may be able to be confirmed through these characteristic information.
According to the previous studies, catalytic sites probably have unusual features to differentiate themse1lves from noncatalytic sites in enzyme. With these unique characteristic structural features of catalytic sites, it may enable people to understand the structure function relationship and to identify them. Since 1988, Zvelebil, M. and Sternberg, E15formed an analysis of catalytic residues in just 17 enzymes and Thornton et al. in 20021 analyzed only 178 structures. However, the completeness of the dataset is a major problem. Hence, in this study we will carry out the most comprehensive analysis of the protein structure properties of the catalytic sites.
3
2. Materials and Methods
2.1 Dataset of catalytic residues
The enzyme was taken from the Catalytic Site Atlas (CSA)-2.2.10 which original comprised 968 protein structures 16.We do not consider the structures of proteins which situate at the cell membrane, contain inter-chain catalytic residues, and exclude the main-chain functional part. Furthermore, we only consider interactions between charged, hydrophilic residues. The nonpolar residues often not directly participate to the catalysis reaction or only create the hydrophobic environment to help the polar residues to take part in the reaction. Moreover, the nonpolar residues, especially alanine, are usually mutated from the polar charged residues. It would abolish the autoproteolytic activity during protein structure determination. In addition, there has a study also show that only the 11 polar and charged residues of the 20 amino acids are generally observed to occupy directly in catalysis17. The residues of dataset in this study are defined by the previous criteria. The final dataset consists of 887 protein structures, including 2368 catalytic residues. The length distribution of our dataset was shown in Table1. The list of our dataset was shown in Appendix I.
4
2.2 Identification and Classification of catalytic sites
2.2.1 Amino acid type
Different amino acids apparently have various propensities to be catalytic residues. Catalytic residues are classified according to the 11 standard amino acid’s three letter abbreviation, i.e., CYS, ASP, GLU, HIS, LYS, ASN, GLN, ARG, SER, THR, and TYR.
2.2.2 Sequence conservation
It is well-known that catalytic residues are highly conserved. In order to know each residue’s conservation, we use the Shannon entropy18
to represent it. Here,
Pi Pi x H n i 20 1 log ) (
where Pi is taken from the PSSM ( position-specific scoring matrices) which generated by the PSI-BLAST, has 20 L elements , where L is the length of query sequences. The base of
log is changed to 20 so that we can get the score in a range from 0 to 1, where 0 means strict
conserved.
5 2.2.3 Secondary structure
Secondary structure information may be helpful in realizing catalytic residues. The classification of secondary structures which we use is according to DSSP 19. DSSP is a database of secondary structure assignments for all protein entries in the Protein Data Bank (PDB). The elements describe the probabilities of each residue in three or eight states of secondary structure. The eight states structural categories followed by DSSPcont include
-helix(H), residue in isolated -bridge(B), extended strand, participates in -ladder(E), 310-helix(G), -helix(I), hydrogen bonded turn(T), bend(S), and others undefined(U). We further classify these eight states into helix(H)={ H,G,I }, sheet(S)={ B,E }, and coil(C)= { T,S,U}.
2.2.4 Relative Solvent Accessibility (RSA)
The surface area is an important structural characteristic since the protein-protein interaction often happens on the surface. Besides, it has been published that catalytic residues are generally more exposed to solvent than others. Amino acid relative accessibility is the degree to which a residue in a protein is accessible to a solvent module. The relative solvent accessibility is computed by
(%) 100 (%) Re MaxAcc Acc lAcc
where Acc is the solvent accessibility of a residue was assigned by using the program DSSP, (2)
6
given in Å2 units. MaxAcc is the maximal accessibility for the amino acids given by B.Rost et al 20. We use two models to define the residue’s solvent accessibility. One is binary model which distinguish all residues into two states, RelAcc <16% means Buried, 16% means Exposed. The other one is ternary model which distinguish all residues into three states, RelAcc <9% means Buried, 9-36% means Intermediate, 36% means Exposed. The thresholds that we selected are the same as those in Rost and Sander 20.
2.2.5 B-factor
The B-factor also called atomic mean-square displacement or temperature factor is
used in condensed matter physics to describe the attenuation of x-ray scattering or neutron scattering caused by thermal motion or quenched disorder. It is used to measure residue flexibility. The B-factor of a protein is presented asb
b1,b2,b3,...bN
, where bi is theB-factor of C of i residue taken from the PDB file; N is the total residue numbers of the protein. We normalize the B-factor by the following formula:
bb
i b b
Z i /
where b and b are the mean and the standard deviation of the B-factor. Later, we will
refer it to zB-factor.
7 2.2.6 Centroid-model (CM)
Residues contacting with catalytic site usually have more interaction with other residues, so centrality values of catalytic residues of enzyme structures are really important. It is a method which used to compute protein dynamics directly from the static protein geometrical shape without any mechanical models 12. It based on the observation that the deeper an atom is buried inside a protein structure, the less it will fluctuate around its equilibrium position. It calculates the square of the atomic distance from the protein’s center of mass. Let X0 be the center of mass of the protein, that is,
k k kmkXk m
X0 ,
where mk and Xk are the mass and the crystallographic position of atom k, respectively. The distance of atom i from the center of mass of the protein is computed by
0
0
2 X X X X ri i i where Xi is the coordinate of C atoms of the i residue, and X is the centroid of the 0 protein. We will refer it as the centroid-model (CM). In order to make it easier to comparison, we normalized ri2 by
2 2 / 2 2 r i r i r r Z where r and 2 r2are the mean and the standard deviation of
2
i
r .
2.2.7 Weighted contact number model (WCN)
The neighboring atoms would affect function of the catalytic residues. A recent study
21
showed that the atomic mean-square displacement (or B-factor) is closely related to the
number of noncovalent neighboring atoms. Here, we will refer to this method as the protein
(4)
8
contact number (CN). This method can be further improved if the protein CN is scaled down
by the square of the distance between the contacting pair. To consider the distance factor, a
distance-dependent contact number vi will defined by weighting the integral contact number
with the factor 1/rij2 which is the distance between Catoms of i and j residues.
N i j ij i r v 12where N is the total residue numbers of the protein. We will refer is as the weighted CN model (WCN). And, we also normalize vi to its Z-score:
vv
i v v
Z i /
where v and n are the mean and the standard deviation of v.
(6)
9
3. Results and Discussion
Detailed analyses of these unique properties were illustrated here. It was suggested that catalytic sites and all residues did differ in these characteristics.
3.1 The distribution of amino acid types in catalytic sites
We analyzed the frequency distribution of the 11 polar or charged amino acid types
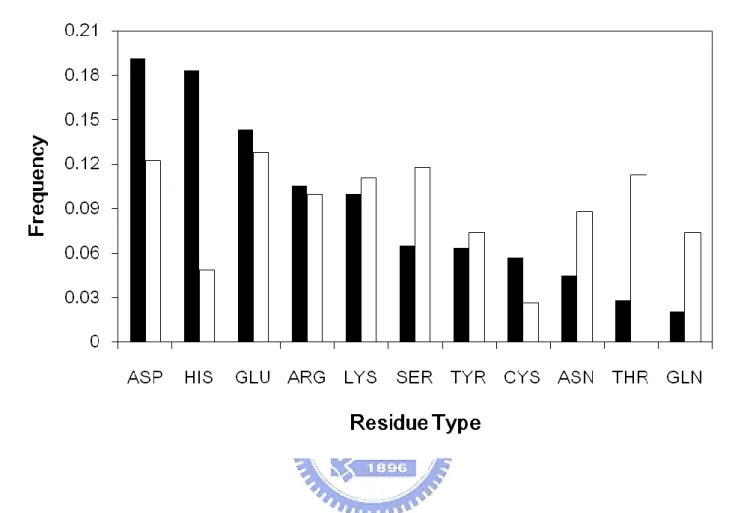
occurring in the catalytic sites compared with all residues in the dataset. Figure 1 shows that the amino acids who have positively or negatively charged R groups (ASP, GLU, HIS, ARG, LYS), they account for 71% of all catalytic residues, while 29% of catalytic residues are provided by the amino acids having polar R groups (SER, THR, CYS, ASN, GLN, TYR). As we already known that catalysis reaction involves the transfer of protons and electrons and charge stabilization, this result is consistent with the previous studies 22 showed that major contribution of enzyme catalysis came from electrostatic interaction.
Aspartate and glutamate residues compose 19% and 14% of all catalytic sites, respectively. It could be that their pKa values far from neutral, around 4.0, provide charges that affect other residues and the substrate. Moreover, aspatate has a shorter side chain than glutamate, making the side-chain less flexible to be easier getting involved with substrate.
We can also see the importance of histidine in enzyme from Figure 1. Histidine constitutes 18% of all catalytic sites. While it has a pKa value of 6, it is really close to neutral and can function as an acid-base or be involved in stabilizing the transition state of catalysis. The other most commonly observed residues are the positively charged and long side-chain residues, arginine and lysine. Both of them compose about 10% of all catalytic sites. The reason for that might be that both of them have nitrogen groups in the side-chain;
10
hence, the side-chain of them can make more electrostatic interactions.
The polar residues are used less often, since they are uncharged in proteins. They tend to form covalent intermediates during the catalysis reaction.
3.2 The characteristic feature profiles of catalytic residues
3.2.1 Sequence conservation profile
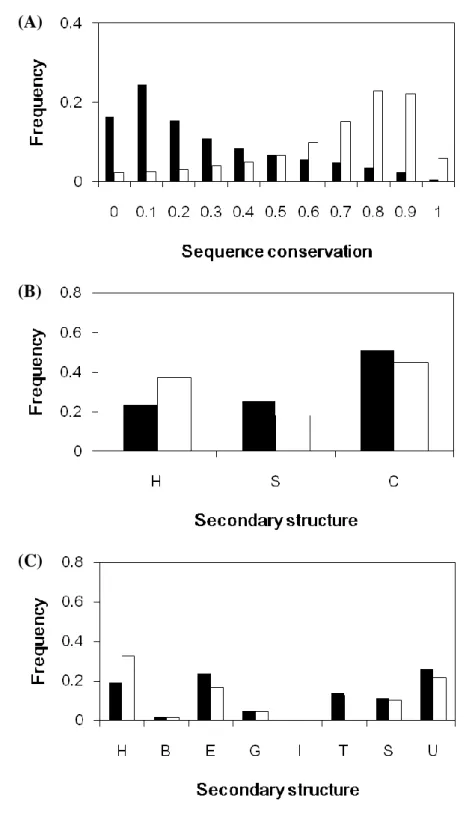
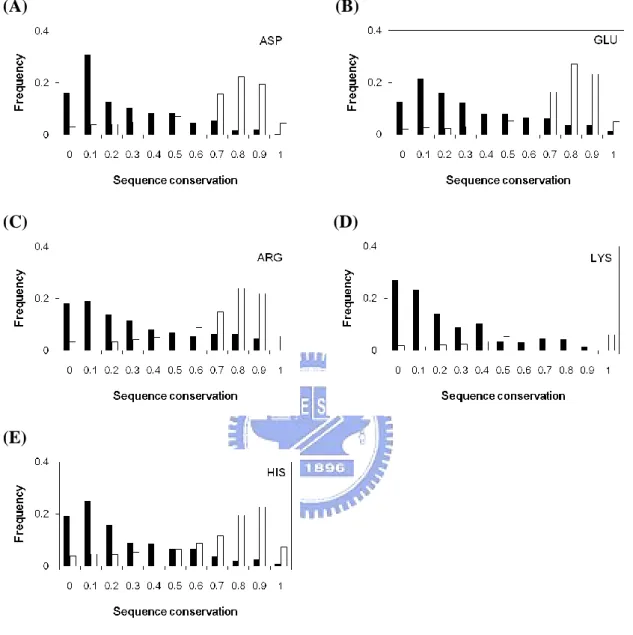
Catalytic sites are clearly more conserved than other residues; it can be shown in Figure 2(A). The average conservation score of catalytic sites is 0.09. Since the catalytic sites in proteins are all have important function, it would not be easily substituted by other amino acids. Figure 3 shows the conservation score trend of 11 amino acids respectively. The trends of the performance of these amino acids appear to be similar.
3.2.2 Secondary structure profile
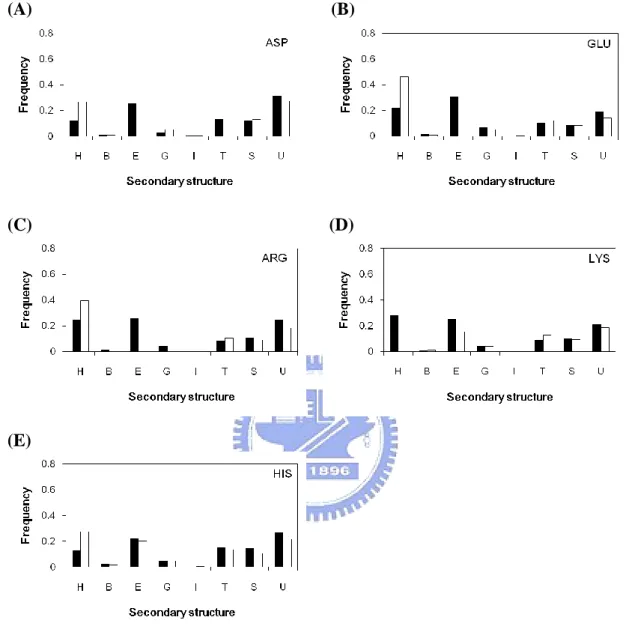
Figure 2(B) and Figure 2(C) show the secondary structure distribution of catalytic sites compared with all residues in the dataset. Catalytic sites prefer to locate on the coil regions (about 50%) than other types. On the contrary, catalytic sites not favor to occur in helix regions (only 23%). This is different from the distribution of all residues. When we use the eight states structural categories followed by DSSP, we can found out that catalytic sites are especially prefer to occur in ladder (E) and undefined (U) regions (Figure 2(C)).
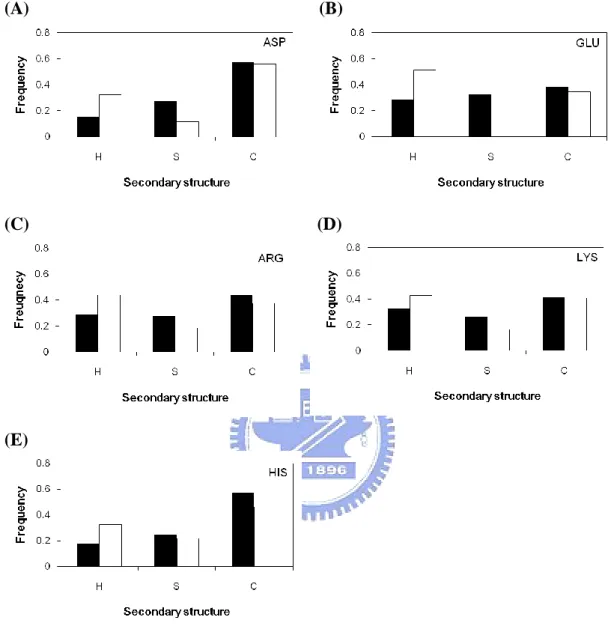
Make it more clearly, in Figure 4 and Figure 5; we analyze the 11 amino acid individually. The catalytic sites of threonine and tyrosine have different distribution with
11
others; they do not often locate on ladder. It may because both of them have the hydroxyl group on the side-chain. Furthermore, cysteine, whose side-chain has thiol group, also not prefers to occur in ladder region. Oppositely, aspartate and glutatmate, who have negatively carboxyl group on the side-chain, are more prefer to locate on ladder regions. The remaining six amino acids have similar distribution of secondary structure.
3.2.3 Relative Solvent Accessibility (RSA) profile
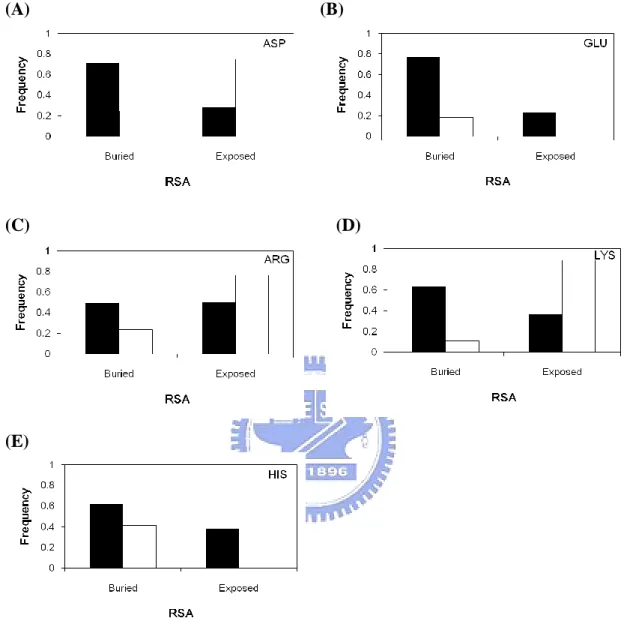
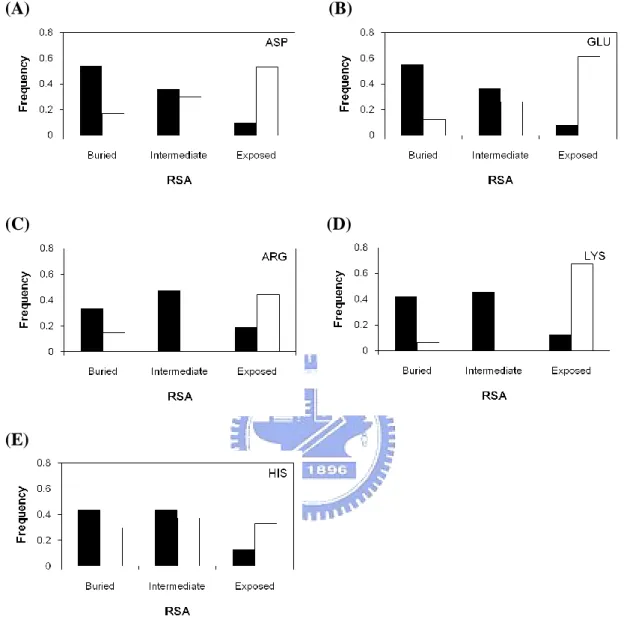
Figure 2(D) and Figure 2(E) show the relative solvent accessibilities profiles of catalytic sites compared with all residues in the dataset. As we have mentioned in our method, we use binary and ternary model to analyze the distribution of catalytic sites. The 67% of catalytic sites are more buried residues in protein structures (Figure 2(D)). While in ternary model of relative solvent accessibility, only 11% of all catalytic sites are fully exposed. This result consistent with other study which shows that the catalytic site is often occurred in a large and deep cleft or cavity 23.
We analyzed 11 amino acids respectively, as shown in Figure 6 and Figure 7. The side chain of cysteine is thiol group, surprisingly; its distribution between catalytic sites and all residues is quite different with other amino acids. The RSA trend of catalytic sites or all residues of cysteine are exceptionally similar, both of them tend to have more buried to solvent. The reason for that might because the thiol group of cysteine is the most reactive side chain found amongst the 20 naturally amino acid residues. However, the exposed frequency of catalytic sites of cysteine is unusual higher than all residues. It may due to that the side chain of cysteine is prefer to form disulfide bonds, which is a strong covalent bond and adopted in solution.
12 3.2.4 Rigidity profile
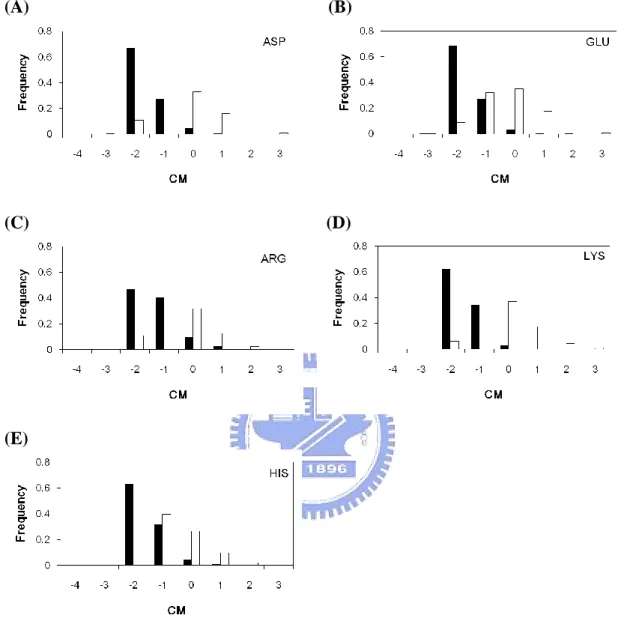
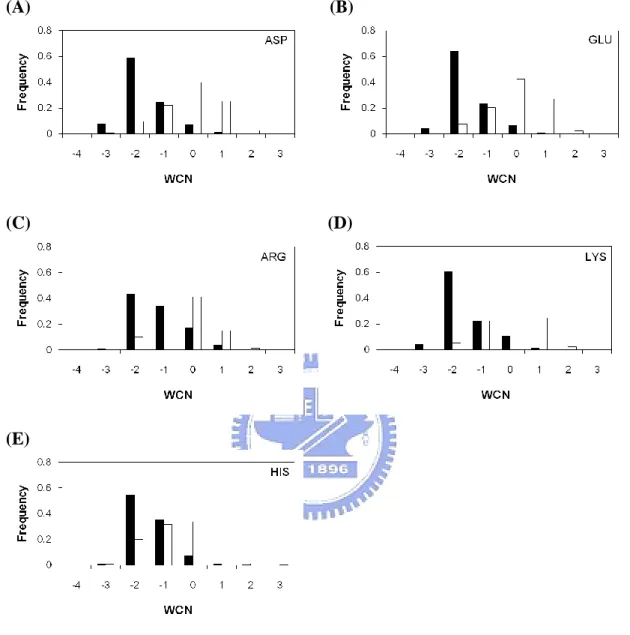
In this study we use three kind features (i.e., zB-factor, CM, WCN) to represent a protein structural rigidity. The B-factor is often used to measure residue flexibility, the smaller value is, and the less flexibility is. The smaller WCN value a residue is means that it locates on more crowded environment. The CM value represents whether a residue is close to its structural center or not.
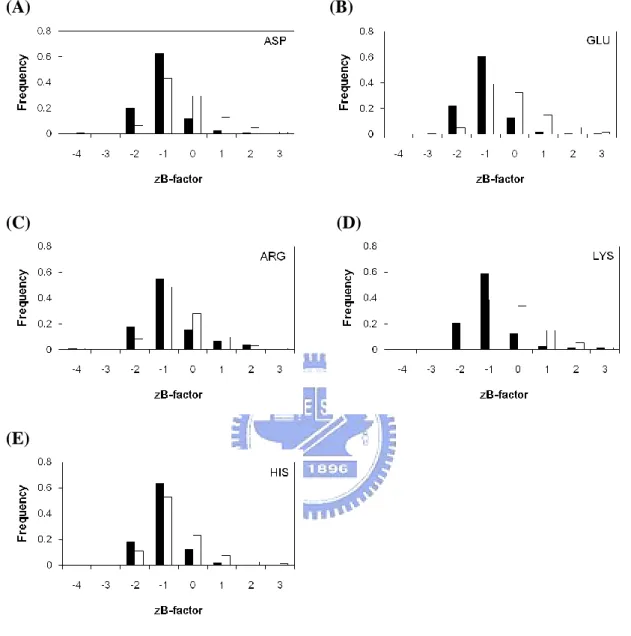
Figure 2(F) compares the zB-factor of the catalytic sites with that of all residues. There are around 81% of catalytic sites with zB-factor ≦ 0, compared with 54% of all residues. Figure 2(G) shows that the WCN of catalytic sites compared with all residues. There are around 90% of catalytic sites with WCN ≦ 0, compared with 14% of all residues. Moreover, the CM of catalytic sites compared with all residues is shown in Figure 2(H). It should be noted that there are about 94% of catalytic sites with CM ≦ 0, compared with 13% of all residues. No matter which feature of these three can suggest that catalytic residues tend to be more rigidity, it means catalytic sites often held in fixed place in enzyme than all residues.
However, we further shows that WCN and CM can perform a much better result than zB-factor. If we use a cutoff value ≦ 0, the WCN and CM will contain about more than 90% of the catalytic residues. CM shows that the catalytic sites are usually closet to the protein centroid. The lower WCN means the catalytic sites tend to lie in the more packed regions than other residues do. According to our results, CM and WCN can play an expressive role in determine the catalytic sites, since the refined B-factor easily affecting by factors like temperature, crystallization conditions or structural refinement.
zB-factor, CM, WCN plots for individual amino acid types can be seen in Figure 8,9,10, respectively. The charged side-chain catalytic residues are easier to be differentiated with all residues. Nevertheless, figure 9(F)(G) and figure10 (F)(G) show that the catalytic sites of
13
serine and threonine, which has polar side chain, especially more prefer the environment which is more crowed and more center than tyrosine. It is reasonable that tyrosi24ne needs more space for its larger side chain.
It is worth noting that, our results are consistent with previous study24. Since 1894, Emil Fisher proposed that the catalytic site has a specific geometric shape that is complementary to the geometric shape of a substrate molecule. It means that enzymes are very specific, and the catalytic site of enzyme are especially less flexibility than other residues.
3.3 The 2D-profiles of catalytic residues
In order to understand the relationship between each feature, we combine any two features to plot 2D-profiles (Figure 11).
Figure 11(A) shows the relationship between conservation score and relative solvent accessibility. Figure 11(B) shows the relationship between conservation score and normalized B-factor. Figure 11(C) shows the relationship between conservation score and centriod model and figure 11 (D) shows the relationship between conservation score and weighted contact number. The conservation score and RSA in catalytic sites are usually low, but conservation score has no readily observable connection with RSA (Figure 11 (A)). However, using the zB-factor, CM, or WCN may help the conservation score to have a better discrimination between catalytic sites and all residues as shown in Figure 11 (B) (C) (D).
Next, we discuss about the relative solvent accessibility combined with other features, which are zB-factor, CM, and WCN, the values of all features tend to be low as shown in figure 11 (E)(F)(G). In this case, we might say that if a residue’s RSA value lower than 0.36 (means intermediate or buried) 20 and CM/WCN value lower than 0, it usually located on the catalytic sites.
14
It was clear that catalytic residues tend to have lower zB-factor, CM and WCN values according to our characteristics feature profile results. As using any two of them plot a XY chart, we can figure out how correlative they are. We use the same cutoff value with the characteristics feature profile that is zB-factor, CM, WCN values ≦ 0. Figure 11 (H) shows that about 78% of catalytic sites have WCN and zB-factor ≦ 0. When CM and zB-factor ≦ 0, there has around 80% of catalytic sites are included (Figure 11 (I)). One notice that, when we use this threshold value (i.e., CM, WCN ≦ 0) for analyzing catalytic sites, Figure 11 (J) shows close to 90% of catalytic sites can be recognized only uses the CM and WCN features. It is proven that CM and WCN are indeed important characteristics of catalytic sites.
To sum up, sequence conservation score has no significant correlation with CM, or WCN value. The CM, or WCN are used for indicate structural rigidity. However, there are complementary relationship between structural characteristics of catalytic sites and those based on sequence conservation. We can say that using CM or WCN can distinguish catalytic residues from all residues although they are not conserved in sequence.
15
4. Conclusion
In this work, we represent a structural analysis of enzyme catalytic sites using a dataset of 887 enzymes which was chosen from CSA. This dataset is nonredundant, but Thornton’s group does not mention the sequence identity of this dataset. The conclusion that we draw from this analysis is that catalytic sites are highly conserved; they are often found in a coil region, and most of them have very limited exposure to solvent although they are polarity and charged. In addition, catalytic sites have large property to locate on the centroid of a protein and catalytic sites also tend to lie in the crowded regions. It means that catalytic sites are more rigid than other noncatalytic residues according to their low B-factor, CM, and WCN values. Interestingly, the B-factor profile did not perform as well as CM or WCN profiles. It may cause of the refined B-factor easily affecting by factors like temperature, crystallization conditions or structural refinement.
Based on all these distinct characteristics with catalytic sites may enable people to understand the structure-function relationship; furthermore, it will be helpful for predicting catalytic sites in enzymes of unknown function from protein structures.
16
REFRENCES
1. Bartlett GJ, Porter CT, Borkakoti N, Thornton JM. Analysis of Catalytic Residues in Enzyme Active Sites. Journal of Molecular Biology 2002;324(1):105-121.
2. Blake CCF, Koenig DF, Mair GA, North ACT, Phillips DC, Sarma VR. Structure of Hen Egg-White Lysozyme: A Three-dimensional Fourier Synthesis at 2 [angst] Resolution. Nature 1965;206(4986):757-761.
3. Lu CH, Lin YS, Chen YC, Yu CS, Chang SY, Hwang JK. The fragment transformation method to detect the protein structural motifs. Proteins 2006;63(3):636-643.
4. Torrance JW, Bartlett GJ, Porter CT, Thornton JM. Using a library of structural templates to recognise catalytic sites and explore their evolution in homologous families. J Mol Biol 2005;347(3):565-581.
5. Laskowski RA, Watson JD, Thornton JM. Protein function prediction using local 3D templates. J Mol Biol 2005;351(3):614-626.
6. Kristensen DM, Ward RM, Lisewski AM, Erdin S, Chen BY, Fofanov VY, Kimmel M, Kavraki LE, Lichtarge O. Prediction of enzyme function based on 3D templates of evolutionarily important amino acids. BMC Bioinformatics 2008;9:17.
7. Tseng YY, Liang J. Predicting enzyme functional surfaces and locating key residues automatically from structures. Ann Biomed Eng 2007;35(6):1037-1042.
8. Richard A. George RVS, Gail J. Bartlett, Alex Gutteridge, Malcolm W. MacArthur, Craig T. Porter, Bissan AI-Lazikani, Janet M. Thornton, Mark B. Swindells. Effective function annotation through catalytic residue conservation. PNAS
2005;102:12299-12304.
9. Yang LW, Bahar I. Coupling between catalytic site and collective dynamics: a requirement for mechanochemical activity of enzymes. Structure
2005;13(6):893-904.
10. Sacquin-Mora S, Laforet E, Lavery R. Locating the active sites of enzymes using mechanical properties. Proteins 2007;67(2):350-359.
11. Ben-Shimon A, Eisenstein M. Looking at enzymes from the inside out: the proximity of catalytic residues to the molecular centroid can be used for detection of active sites and enzyme-ligand interfaces. J Mol Biol 2005;351(2):309-326.
12. Shih CH, Huang SW, Yen SC, Lai YL, Yu SH, Hwang JK. A simple way to compute protein dynamics without a mechanical model. Proteins 2007;68(1):34-38.
13. Lu CH, Huang SW, Lai YL, Lin CP, Shih CH, Huang CC, Hsu WL, Hwang JK. On the relationship between the protein structure and protein dynamics. Proteins 2008;76(3).
17
14. Lin CP, Huang SW, Lai YL, Yen SC, Shih CH, Lu CH, Huang CC, Hwang JK. Deriving protein dynamical properties from weighted protein contact number. Proteins 2008;72(3):929-935.
15. Zvelebil MJ, Sternberg MJ. Analysis and prediction of the location of catalytic residues in enzymes. Protein Eng 1988;2(2):127-138.
16. Porter CT, Bartlett GJ, Thornton JM. The Catalytic Site Atlas: a resource of catalytic sites and residues identified in enzymes using structural data. Nucleic Acids Res 2004;32(Database issue):D129-133.
17. Gutteridge A, Thornton JM. Understanding nature's catalytic toolkit. Trends Biochem Sci 2005;30(11):622-629.
18. Strait BJ, Dewey TG. The Shannon information entropy of protein sequences. Biophys J 1996;71(1):148-155.
19. Kabsch W, Sander C. Dictionary of protein secondary structure: pattern recognition of hydrogen-bonded and geometrical features. Biopolymers 1983;22:2577-2637. 20. Rost B, Sander C. Conservation and prediction of solvent accessibility in protein
families. Proteins 1994;20(3):216-226.
21. Halle B. Flexibility and packing in proteins. Proc Natl Acad Sci U S A 2002;99(3):1274-1279.
22. Warshel A, Sharma PK, Kato M, Xiang Y, Liu H, Olsson MH. Electrostatic basis for enzyme catalysis. Chem Rev 2006;106(8):3210-3235.
23. Laskowski RA LN, Swindells MB, Thornton JM. Protein clefts in molecular recognition and function. Prot Sci 1996:2438–2452.
24. Fischer E. Einfluss der Configuration auf die Wirkung der Enzyme. Berichte der deutschen chemischen Gesellschaft 1894;27(3):2985 - 2993.
18
TABLE
Table 1. The length distribution of dataset
Length number ≦100 8 101~200 128 201~300 262 301~400 236 401~500 108 501~600 73 601~700 31 701~800 21 801~900 10 901~1000 2 ≧1000 8
19
FIGURES
Figure 1. The frequency of polar and charged amino acid type in catalytic sites (black) compared with all residues (white).
20 (A)
(B)
(C)
Figure 2. The histograms of the frequency between catalytic sites and all residues (A) Sequence conservation; (B) Secondary structure_Helix (H), Sheet (S), Coil (C); (C) Secondary structure_-helix (H), -bridge(B), -ladder(E), 310-helix(G), -helix(I), hydrogen bonded turn(T), bend(S), and others undefined (U); (D) Relative Solvent
Accessibility(RSA)_binary model; (E) Relative Solvent Accessibility(RSA)_tertiary model; (F) Normolized B-factor(zB-factor); (G) Weighted contact number model(WCN); (H) Centroid-model(CM).
21 (D)
(E)
22 (F) (G) (H) Figure 2. (Continued)
23 (A) (B)
(C) (D)
(E)
Figure 3. Sequence conservation for individual catalytic residues (ASP, HIS, GLU, ARG, LYS, SER, TYR, CYS, ASN, THR, GLN) compared with all residues of the same type.
(E) (C)
24 (F) (G)
(H) (I)
(J) (K)
25 (A) (B)
(C) (D)
(E)
Figure 4. Secondary structure_Helix (H), Sheet (S), Coil (C) for individual catalytic residues (ASP, HIS, GLU, ARG, LYS, SER, TYR, CYS, ASN, THR, GLN) compared with all residues of the same type.
26 (F) (G)
(H) (I)
(J) (K)
27 (A) (B)
(C) (D)
(E)
Figure 5. Secondary Structure_-helix(H), -bridge(B), -ladder(E), 310-helix(G),
-helix(I), hydrogen bonded turn(T), bend(S), and others undefined(U) for individual
catalytic residues (ASP, HIS, GLU, ARG, LYS, SER, TYR, CYS, ASN, THR, GLN) compared with all residues of the same type.
(E) (C)
28 (F) (G)
(H) (I)
(J) (K)
29 (A) (B)
(C) (D)
(E)
Figure 6. Relative Solvent Accessibility(RSA)_binary model for individual catalytic residues (ASP, HIS, GLU, ARG, LYS, SER, TYR, CYS, ASN, THR, GLN) compared with all residues of the same type.
(E) (C)
30 (F) (G)
(H) (I)
(J) (K)
31 (A) (B)
(C) (D)
(E)
Figure 7. Relative Solvent Accessibility(RSA)_ternary model for individual catalytic residues (ASP, HIS, GLU, ARG, LYS, SER, TYR, CYS, ASN, THR, GLN) compared with all residues of the same type.
(E) (C)
32 (F) (G)
(H) (I)
(J) (K)
33 (A) (B)
(C) (D)
(E)
Figure 8. zB-factor for individual catalytic residues (ASP, HIS, GLU, ARG, LYS, SER, TYR, CYS, ASN, THR, GLN) compared with all residues of the same type.
(E) (C)
34 (F) (G)
(H) (I)
(J) (K)
35 (A) (B)
(C) (D)
(E)
Figure 9. CM for individual catalytic residues (ASP, HIS, GLU, ARG, LYS, SER, TYR, CYS, ASN, THR, GLN) compared with all residues of the same type.
(E) (C)
36 (F) (G)
(H) (I)
(J) (K)
37 (A) (B)
(C) (D)
(E)
Figure 10. WCN model catalytic residues (ASP, HIS, GLU, ARG, LYS, SER, TYR, CYS, ASN, THR, GLN) compared with all residues of the same type.
(E) (C)
38 (F) (G)
(H) (I)
(J) (K)
39 (A) (B)
(C) (D)
Figure 11. The 2-D profile of catalytic residues (black dots) compare with all residues (grey dots). (A) sequence conservation and relative solvent accessibility properties; (B) sequence conservation and normalized B-factor; (C) sequence conservation and centroid model; (D) sequence conservation and weighted contact number model; (E) relative solvent accessibility properties and normalized B-factor; (F) relative solvent accessibility properties and centroid model; (G) relative solvent accessibility properties and weighted contact number model; (H) normalized B-factor and weighted contact number model; (I) normalized B-factor and centroid model; (J) weighted contact number model and centroid model.
40 (E) (F)
(G)
41 (H) (I)
(J)
42
APPENDIX
Appendix I. 887 PDBID
aIDs
12as_A 132l_A 135l_A 13pk_A 1a0i_A 1a0j_A 1a16_A 1a26_A 1a2t_A 1a41_A 1a4g_A 1a4i_A 1a4l_A 1a4s_A 1a4y_B 1a50_B 1a65_A 1a69_A 1a6d_A 1a79_A 1a7u_A 1a8h_A 1a8q_A 1a8s_A 1a95_C 1aa6_A 1aam_A 1ab4_A 1ab8_A 1abr_A 1adn_A 1af7_A 1afr_A 1afw_A 1agm_A 1agy_A 1ah7_A 1aj0_A 1aj8_A 1ak0_A 1akd_A 1akm_A 1ako_A 1al6_A 1ald_A 1alk_A 1am2_A 1am5_A 1amo_A 1amp_A 1amy_A 1aop_A 1apt_E 1apx_A 1aq0_A 1aq2_A 1aql_A 1arz_A 1ast_A 1asy_B 1at1_A 1aug_A 1aui_A 1auk_A 1auo_A 1avf_A 1avq_A 1ax4_A 1ay4_A 1azw_A 1azy_A 1b02_A 1b04_A 1b2m_A 1b2r_A 1b3m_A 1b3r_A 1b57_A 1b5d_A 1b5q_A 1b5t_A 1b65_A 1b6b_A 1b6g_A 1b6t_A 1b73_A 1b7y_A 1b8b_A 1b8f_A 1b8g_A 1b93_A 1b9h_A 1bbs_A 1bd3_A 1be1_A 1bf2_A 1bfd_A 1bg0_A 1bg6_A 1bgl_A 1bh2_A 1bhg_A 1bib_A 1bix_A 1bjo_A 1bmt_A 1bob_A 1bol_A 1boo_A 1bou_B 1bp2_A 1bqc_A 1brm_A 1brw_A 1bs0_A 1bs4_A 1bs9_A 1bsj_A 1bt1_A 1btl_A 1bu7_A 1bvv_A 1bvz_A 1bwd_A 1bwl_A 1bwp_A 1bwz_A 1bxr_B 1bya_A 1bzc_A 1bzy_A 1c0k_A 1c2t_A 1c3j_A 1c4x_A 1c4z_A 1c54_A 1c82_A 1c9u_A 1ca2_A 1ca3_A 1cb7_B 1cb8_A 1cbg_A 1cbx_A 1cd5_A 1cde_A 1cdg_A 1cel_A 1cev_A 1cf2_O 1cfr_A 1cg2_A 1cg6_A 1cgk_A 1chd_A 1chk_A 1chm_A 1ci8_A 1cjy_A 1ck7_A 1cl1_A 1cm0_A 1cms_A 1cmx_A 1cns_A 1coy_A 1cqg_A 1cqq_A 1ct9_A 1ctn_A 1ctt_A 1cv2_A 1cvr_A 1cw0_A 1cwy_A 1cz0_A 1cz1_A 1czf_A 1d0s_A 1d1q_A 1d2h_A 1d2r_A 1d2t_A 1d3g_A 1d4a_A 1d4c_A 1d6i_A 1d6m_A 1d6o_A 1d7r_A 1d8c_A 1d8h_A 1d8t_A 1daa_A 1dae_A 1db3_A 1dbf_A 1dbt_A 1dci_A 1dco_A 1dd8_A 1ddj_A 1de3_A 1de6_A 1dek_A 1df9_A 1dfo_A 1dgk_N 1dgs_A 1dhf_A 1dhp_A 1dhr_A 1di1_A 1dii_A 1din_A 1dio_A 1diz_A 1dj0_A 1dj1_A 1djl_A 1dki_A 1dl2_A 1dl5_A 1dli_A 1dmu_A 1dnk_A 1dnp_A 1do6_A 1do8_A 1dod_A 1doo_A 1dpg_A 1dqs_A 1ds2_E 1dub_A 1dup_A 1dve_A 1dwo_A 1dxe_A 1dzr_A 1e0c_A 1e19_A 1e1a_A 1e2a_A 1e2t_A 1e3v_A 1e5q_A 1e7q_A 1eag_A 1eb6_A 1ebf_A 1ec9_A 1ecf_A 1ecl_A 1ecx_A 1eed_P 1eej_A 1ef0_A 1ef8_A 1eg7_A 1eh5_A 1eh6_A 1ehy_A 1ei5_A 1eix_A 1elq_A 1els_A 1emd_A 1eo7_A 1eq2_A 1esc_A 1eso_A 1et0_A 1eu1_A 1eug_A 1eul_A 1euu_A 1euy_A 1evy_A 1ex1_A 1exn_A 1exp_A 1ey2_A 1eyi_A 1eyp_A 1ez1_A 1ez2_A 1f2d_A 1f2v_A 1f48_A 1f6d_A 1f75_A 1f7l_A 1f7u_A 1f8m_A 1f8r_A
43
1f8x_A 1fa0_A 1fc4_A 1fcb_A 1fcq_A 1fdy_A 1ff3_A 1fgh_A 1fhl_A 1fiq_C 1fnb_A 1fo6_A 1foa_A 1fob_A 1foh_A 1fps_A 1fq0_A 1fr2_B 1fr8_A 1fro_A 1fsg_A 1fua_A 1fui_A 1fva_A 1fwk_A 1fy2_A 1g0d_A 1g24_A 1g4p_A 1g64_A 1g6t_A 1g72_A 1g79_A 1g8f_A 1g8o_A 1g8p_A 1g99_A 1ga8_A 1gal_A 1gcb_A 1gcu_A 1gdh_A 1gdo_A 1ge7_A 1geq_A 1ghs_A 1gim_A 1glo_A 1gns_A 1gog_A 1gox_A 1gp1_A 1gp5_A 1gpa_A 1gpj_A 1gpm_A 1gpr_A 1gq8_A 1gqg_A 1grc_A 1gsa_A 1gt7_A 1gtp_A 1gtx_A 1guf_A 1gxs_A 1gz6_A 1h19_A 1h3i_A 1h4g_A 1h54_A 1h7o_A 1h7x_A 1hdh_A 1hfe_L 1hfs_A 1hka_A 1hpl_A 1hpm_A 1hqc_A 1hr6_B 1hr7_B 1hrd_A 1hti_A 1hto_A 1hv9_A 1hxq_A 1hy3_A 1hzd_A 1hzf_A 1i19_A 1i1e_A 1i1i_P 1i29_A 1i6p_A 1i8d_A 1i8t_A 1i9a_A 1idj_A 1idt_A 1iec_A 1ig8_A 1im5_A 1ima_A 1inp_A 1iph_A 1ir3_A 1it4_A 1itx_A 1iu4_A 1ivh_A 1iyd_A 1j00_A 1j09_A 1j2u_A 1j49_A 1j53_A 1j70_A 1j79_A 1j7g_A 1jag_A 1jch_A 1jdw_A 1jfl_A 1jh6_A 1jhf_A 1jkm_A 1jm6_A 1jms_A 1joa_A 1jof_A 1jqn_A 1jrp_B 1js4_A 1jxh_A 1k0w_A 1k30_A 1k32_A 1k4l_A 1k4t_A 1k82_A 1kae_A 1kas_A 1kaz_A 1kc7_A 1kcz_A 1kdg_A 1kez_A 1kfu_L 1kfx_L 1kim_A 1kl7_A 1knp_A 1kny_A 1kp2_A 1kqc_A 1kra_C 1ksj_A 1kws_A 1kyq_A 1kyw_A 1kzh_A 1kzl_A 1l0o_A 1l1d_A 1l1l_A 1l1r_A 1l7d_A 1l7n_A 1l7q_A 1l8t_A 1l9x_A 1lam_A 1lba_A 1lbu_A 1lcb_A 1lci_A 1ldm_A 1lij_A 1lio_A 1lj1_A 1ljl_A 1lnh_A 1ltq_A 1luc_A 1lvh_A 1lws_A 1lxa_A 1lz1_A 1m21_A 1m53_A 1m54_A 1m6k_A 1m9c_A 1mas_A 1mbb_A 1mdr_A 1mek_A 1mfp_A 1mht_A 1mhy_D 1mj9_A 1mla_A 1mlv_A 1mok_A 1moq_A 1mpp_A 1mpx_A 1mpy_A 1mqw_A 1mrq_A 1mt1_B 1muc_A 1mud_A 1mug_A 1mvn_A 1myr_A 1n20_A 1n2t_A 1naa_A 1nba_A 1nbf_A 1ndh_A 1ndi_A 1nf9_A 1nhx_A 1nid_A 1nir_A 1nkk_A 1nln_A 1nlu_A 1nml_A 1nmw_A 1nn4_A 1nsf_A 1nsj_A 1nsp_A 1nu3_A 1nvm_A 1nvt_A 1nw9_B 1nww_A 1nzy_A 1o04_A 1o98_A 1o9i_A 1oac_A 1oas_A 1oba_A 1odt_C 1oe8_A 1ofd_A 1ofg_A 1og1_A 1ogo_X 1oh9_A 1oj4_A 1ok4_A 1okg_A 1onr_A 1opm_A 1oqz_A 1or8_A 1ord_A 1oro_A 1os7_A 1otg_A 1oxa_A 1oya_A 1oyg_A 1ozh_A 1p1x_A 1p3d_A 1p4n_A 1p4r_A 1p5d_X 1p7m_A 1pa9_A 1pad_A 1pae_X 1pbg_A 1pd2_1 1peg_A 1pfk_A 1pfq_A 1pgs_A 1pii_A 1pj5_A 1pja_A 1pjb_A 1pjh_A 1pjq_A 1pkn_A 1pma_A 1pmi_A 1pnl_B 1pnt_A 1pow_A 1pp4_A 1ps1_A 1ps9_A 1psd_A 1ptd_A 1pud_A 1pvd_A 1pvi_A 1pwh_A 1pwv_A 1pxv_A 1pyl_A 1pym_A 1pz3_A 1q18_A 1q3n_A 1q3q_A 1q6x_A 1q91_A 1qam_A 1qaz_A 1qb4_A 1qba_A 1qcn_A 1qd1_A 1qe3_A 1qf6_A 1qfe_A 1qfl_A 1qfm_A 1qfn_A 1qgn_A 1qgx_A 1qh5_A 1qh9_A 1qhf_A 1qhg_A 1qho_A 1qi9_A 1qib_A 1qj2_B 1qj4_A 1qje_A 1qk2_A
44
1qlh_A 1qmh_A 1qol_A 1qq5_A 1qrg_A 1qrr_A 1qrz_A 1qsg_A 1qtn_A 1qum_A 1qv0_A 1qwn_A 1qx3_A 1qz9_A 1r16_A 1r1j_A 1r30_A 1r44_A 1r4f_A 1r4z_A 1r6w_A 1r76_A 1ra0_A 1ra2_A 1rba_A 1rbl_A 1rbn_A 1rdd_A 1req_A 1rgq_A 1rhc_A 1rhs_A 1rk2_A 1rne_A 1ro7_A 1roz_A 1rpt_A 1rpx_A 1rql_A 1rtf_B 1rtu_A 1ru4_A 1rvv_A 1s20_A 1s2k_A 1s3i_A 1s76_D 1s95_A 1s9c_A 1sca_A 1ses_B 1sll_A 1slm_A 1sme_A 1sml_A 1smn_A 1snn_A 1snz_A 1sox_A 1ssx_A 1stc_E 1std_A 1szd_A 1szj_G 1t0u_A 1t7d_A 1tah_A 1tde_A 1tdj_A 1teh_A 1thg_A 1tht_A 1ti6_A 1tlp_E 1tml_A 1tmo_A 1tox_A 1tph_1 1trk_A 1tyf_A 1tys_A 1tz3_A 1u3f_A 1u5u_A 1u7u_A 1u8v_A 1uae_A 1uag_A 1uam_A 1uaq_A 1uas_A 1uch_A 1uf7_A 1uk7_A 1ula_A 1un1_A 1uok_A 1uox_A 1uqr_A 1uqt_A 1uro_A 1ush_A 1uw8_A 1v04_A 1v0e_A 1v0y_A 1v25_A 1vao_A 1vas_A 1vid_A 1vie_A 1vlb_A 1vnc_A 1vom_A 1vq1_A 1vr7_A 1vzx_A 1vzz_A 1w0h_A 1w1o_A 1w2n_A 1wd8_A 1wgi_A 1wnw_A 1x7d_A 1x9h_A 1x9y_A 1xa8_A 1xgm_A 1xik_A 1xqd_A 1xqw_A 1xrs_B 1xtc_A 1xva_A 1xvt_A 1xyz_A 1y9m_A 1ybq_A 1ybv_A 1ycf_A 1ygh_A 1ylu_A 1yon_A 1ysc_A 1ytw_A 1yve_I 1ze1_A 1zio_A 1zm2_B 1znv_B 1zoi_A 1zrz_A 1zym_A 206l_A 2a0n_A 2a86_A 2aat_A 2abk_A 2ace_A 2acu_A 2acy_A 2adm_A 2alr_A 2amg_A 2apr_A 2ayh_A 2b3i_A 2bbk_L 2bhg_A 2bif_A 2bkr_A 2blt_A 2bmi_A 2bsx_A 2bx4_A 2c7v_A 2cnd_A 2cpo_A 2cpu_A 2dbt_A 2dhn_A 2dln_A 2dor_A 2dw7_A 2ebn_A 2eng_A 2eql_A 2esd_A 2f61_A 2f9r_A 2f9z_C 2fmn_A 2fok_A 2gsa_A 2hdh_A 2his_A 2hsa_A 2isd_A 2jcw_A 2jxr_A 2lip_A 2lpr_A 2nac_A 2nlr_A 2npx_A 2oat_A 2pda_A 2pec_A 2pfl_A 2pgd_A 2phk_A 2pia_A 2plc_A 2pth_A 2qf7_A 2rnf_A 2tdt_A 2thi_A 2tmd_A 2toh_A 2tpl_A 2tps_A 2ts1_A 2xis_A 2ypn_A 3cla_A 3csm_A 3eca_A 3mdd_A 3nos_A 3pca_M 3pva_A 3r1r_A 4kbp_A 4mdh_A 5cox_A 5cpa_A 5eat_A 5enl_A 5fit_A 5rsa_A 7atj_A 7nn9_A 7odc_A 8pch_A 8tln_E 9pap_A
a