THE SEX RATIOS AND GROWTH STRATEGIES OF WILD AND CAPTIVE JAPANESE EELS Anguilla japonica
Wann-Nian Tzeng
Department of Zoology, College of Science, National Taiwan University, Taipei, Taiwan 106, ROC
Tel: 886-2-23639570, Fax: 886-2-23636837, E-mail: wnt@ccms.ntu.edu.tw
Yu-San Han and Je-Tung He
Department of Zoology, College of Science, National Taiwan University, Taipei, Taiwan 106, ROC
Tel: 886-2-23639570, Fax: 886-2-23636837, E-mail: wnt@ccms.ntu.edu.tw
Abstract
The role of gender and sexual differences in the growth histories of Japanese eel Anguilla japonica were linked with respect to the sex ratio and growth rate of wild eels collected from Taiwanese rivers. The sex ratio of wild eels was compared with that of eels semi-intensively cultured in a pond and intensively cultured in an aquarium. The sex ratio of wild eels from a low-density river habitat was dominated by females (86.4% of sex-determined eels), slightly dominated by males (57.1%) in a cultured pond, and dominated by males (90.0%) in an aquarium. This evidence supported the hypothesis that the sex of eels is determined by population density. The parameters of the von Bertalanffy growth equation demonstrated that males grew faster to reach a smaller asymptotic length than did females. We propose that the variation in eel sex ratio interacts with sex-linked differences in growth strategy to play an important role in density-dependent population regulation.
Keyword: Japanese eel (Anguilla japonica); sex ratio; growth strategy Introduction
The Japanese eel, Anguilla japonica Temminck and Schlegel, is a catadromous fish (Ege, 1939). The population is panmictic (Sang et al., 1994), spawning west of the Mariana Islands (Tsukamoto, 1992) and growing in brackish estuaries and freshwater rivers and lakes in Taiwan, China, Korea and Japan in northeastern Asia (Tesch, 1977). The eel enters coastal estuaries and freshwaters as a sexually undifferentiated elver, which feeds and grows as a yellow eel for 5-8 years until metamorphosing from yellow to silver eel (Tzeng et al., 2000a). After maturation, eels migrate back to their birthplace to spawn and die (Tesch, 1977). Japanese, European (A. anguilla) and American (A. rostrata) eels have been reported to have ZW sex chromosomes (Passakas and Klekowski, 1972; Park and Grimm, 1981). However, further karyotype studies failed to identify heteromorphic sex chromosomes (Sola et al., 1980; Wiberg, 1983). Sexual differentiation of the eel occurs during the yellow phase. Ovaries are found in European eels of 22-30 cm in length, possibly derived from undifferentiated gonads or from the Syrski organ, a gonad containing both early testes and oogonia, and spermatogonium B-type testes are observed in eels longer than 30 cm (Colombo and Grandi, 1996). Elvers of undifferentiated sex could be feminized by treatment with estrodiol-17β (Degani and Kushnirov, 1992; Chiba et al., 1993), indicating that the sex of the eel is labile. A long period of undifferentiated status and influenceable sex indicates that the sex determination mechanisms of the eel are complicated and unique. In a natural environment, eels show a variable sex ratio, ranging from almost all males to predominantly female (Matsui, 1972; Parsons et al., 1977; Tesch, 1977; Jessop, 1987; Tzeng et al., 1995; Oliveira, 1997; 1999; Oliveira et al., 2001). Parsons et al. (1977) demonstrated that the proportion of migrating male silver eels markedly increased at higher elver restocking densities in a lough with low eel density. Oliveira et al. (2001) found that the percentage of lake area in a river significantly affected the sex ratio of the eel, i.e., eels migrating from lacustrine habitats of the river were mostly females, but eels migrating from fluvial habitats were mostly males. Whether the sex determination and differentiation of eels is dependent upon genotype or phenotype (environmental) is controversial. Two main hypotheses have been proposed to explain the sexual variability throughout the eel’s distribution. First, if eel sex determination is genotype-dependent, then the unequal distributions of the sexes in the rivers might be the result of different habitat choice, with females preferring to migrate upstream and males preferring to stay in estuaries (Bertin, 1956; Tesch, 1977), or perhaps females prefer a habitat suitable for faster growth while males prefer a slow-growth habitat (Helfman et al., 1987). Second, if eel sex determination is phenotype-dependent, then the habitat in which they grow will affect their sex. Most studies favor the environmental sex-determination hypothesis, i.e., at high population densities,
males dominate the sex ratio and at low population densities females dominate (Colombo et al., 1984; Krueger and Oliveira, 1999). In addition, male eels have been hypothesized to maximize evolutionary fitness by time-minimizing in the growth-phase, yellow eel stage, whereas females use a size-maximizing strategy that spends more time to gain a larger size to increase fecundity (Helfman et al., 1987). A sex ratio that varies with population density is consistent with different growth rates for each sex.
The relationship between the variability in eel sex ratio and their growth strategy was evaluated by comparing the sex ratios at different population densities of wild and captive eels and by comparing the growth rates of each sex in relation to sex ratio.
Materials and Methods
Wild Japanese eels were collected by eel trap in the down stream of the Kaoping River of southwest Taiwan (120 50’ E and 22 40’ N) between November 1998 and November 2001. Cultured eels were obtained from a semi-intensively cultured pond in the Lukang area of central Taiwan (n= 49), and from an indoor aquarium at the Taiwan Fisheries Research Institute (TFRI) (n=40, 600 days old). Total length (±1 mm) and weight (±0.1g) of the eels were measured. The density of wild eels in the river (d) was estimated by the formula:
d = N/A
A = π (S/2)2 (1)
where N is the number of the eels caught by an eel trap and A is the area of the fishing zone. S is the distance between two eel traps, approximately 10 m, while the density of captive eels was the number of reared eels divided by the bottom area of the pond and aquarium.
The sex of each eel was determined by gonad histology. The eel gonads were fixed in Bouin’s solution, dehydrated in an ethanol series and embedded in paraffin, sectioned at 5 µm and stained with haematoxylin and eosin. The developmental stages of ovaries and testes were classified according to the methods of Yamamoto et al. (1974) and Miura et al. (1991), respectively. The sex ratios of the eels in relation to length, month and environmental history pattern were tested with Chi-square analysis of Contingency Tables (Mason et al., 1994). The sex ratios of wild eels from the Kaoping River, Taiwan and reared eels from Lukang and TFRI were compared with those of previous studies of wild eels from the Tanshui River north Taiwan and reared eels from Japan. (Tzeng et al., 1995; Satoh and Nimura, 1991; 1992).
The largest pair of otoliths (sagitta) of the eel was extracted, dried at 60° C for 10 min and embedded in a silicon rubber mould with petropoxy 154 (Palouse Petro Products, U.S.A.). Each otolith was ground and polished from the proximal side with sandpaper until the primordium was revealed and coated with carbon. Strontium (Sr) and calcium (Ca) concentrations in otolith were measured with a wavelength-dispersive X-ray spectrometer (Shimadzu-ARL-EMX-SM7). The measurement procedures for Sr and Ca were similar to those of previous studies (Tzeng et al., 1997; 2002). The Sr/Ca ratios in otolith were used to reconstruct the previous migratory and environmental history of each sex so as to evaluate whether the sex ratio of the eel changed with habitat.
After microchemistry analysis, the otolith was etched with EDTA to reveal the annulus for age determination (Tzeng et al., 1994; 2002b). The radii from the primordium to the glass eel mark (ro), annuli (rn) and the otolith edge (R) were measured to estimate the total lengths at the glass eel stage (lo) and at the annulus formation period (ln) by the Dahl-Lea formula (Francis, 1990):
ln = rn L R-1 (2)
where, L is the total length of the silver eel at capture. The mean ln was used to estimate the growth parameters (K, growth coefficient; L∞, asymptotic length) of the von Bertalanffy growth equation by Ford-Walford plot (Ricker, 1958). The growth parameters K and L∞ for males and females were compared for eels collected from the Kaoping River and for those from previous studies of the Pearl River of South China and Japan (Tzeng et al., 2000a, 2002).
The wild eels were divided by skin coloration pattern into yellow and silver stages: 1) yellow stage: the eel was white/gray on the pectoral fins, green/gray on the back and yellow/white on the belly; 2) silver stage: the eel was countershaded, with dark pigmentation on the back and pectoral fins, and silver/bronze on the belly. Then the mean absolute growth rate (G) of the silver eels was calculated according to the formula:
G = (L - lo) t -1 (3)
where lo is the total length at the glass eel stage as estimated from ro and t is the age of silver eels estimated from counts of the otolith annuli. The effect of growth rate on the age and size of the eel at metamorphosis from the yellow to the migratory silver eel stage was examined by calculating the regressions of age and length on growth rate for each sex of the silver eels collected from the Kaoping River of Taiwan and from China and Japan (Tzeng et al., 2000a; 2002). The significant differences in mean length and age of the silver eels between the sexes were examined using one-way analysis of variance (ANOVA) and Tukey’s
pairwise comparison of means or Kruskal-Wallis ANOVA on ranks with Dunn’s pairwise comparison of mean ranks if the data were not normally distributed with equal variance (Mason et al., 1994).
Results
1. Comparison of the sex ratio of wild and cultured eels
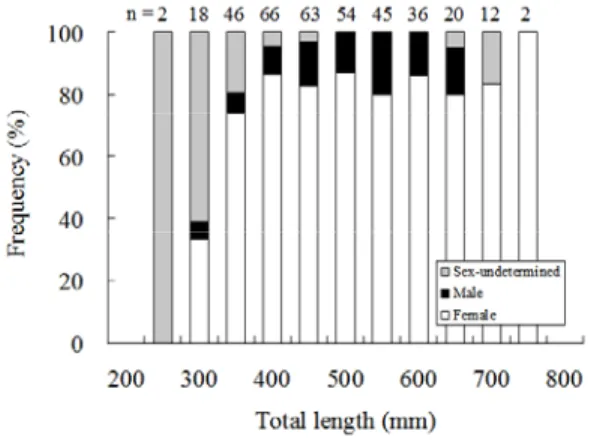
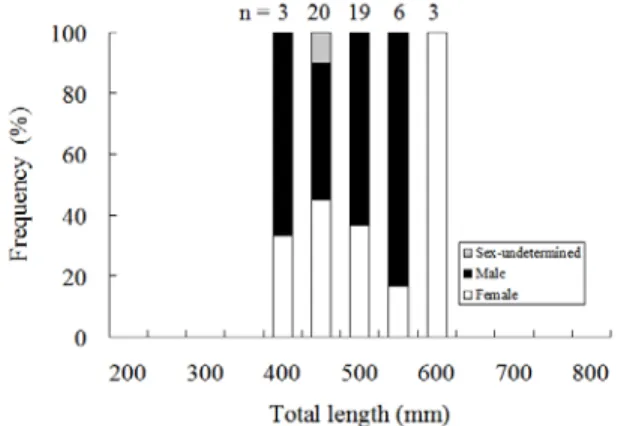
The sex of most Japanese eels longer than 250 mm was readily determined. The density of eels in the sampling area of the Kaoping River was approximately 0.02±0.01 eels/m2. Females comprised 87.1% of the eels for which sex was determined. The sex ratio did not change with growth or season because the sex ratio was not significantly related to eel total length (Wild: χ2=3.469, p=0.483, Fig. 1; Captivity: χ2=0.484, p=0.785, Fig. 2) or to seasonal occurrence (χ2=7.782, p=0.051, Fig. 3). The sample size of the sex ratio for the environmental history comparison was too small to calculate the χ2 but the proportion of females was larger than for males in all the cases (Fig. 4). Thus, females, irrespective of eel developmental stage seasonal occurrence or habitat choice, dominated the sex ratios of wild eels from the Kaoping River. Thus, females, irrespective of eel developmental stage, seasonal occurrence or habitat choice, dominated the sex ratios of wild eels from the Kaoping River.
In contrast, the sex ratio of eels reared at a density of approximately 20.0 eels/m2 in a semi-intensively cultured pond in the Lukang area was slightly dominated by males (more than 50% the sex-determined eels) (Fig2, Table1).
Japanese eels in the Kaoping River.
Figure 2. The sex ratio in relation to total length of Japanese eels in a semi-intensively cultured pond in Lukang.
Figure 3. The sex ratio, by month, of Japanese eels in the Kaoping River.
Figure 4. The sex ratio of Japanese eels with different environmental histories in the Kaoping River. SS: seawater, BFS: between fresh water and seawater, FF: freshwater.
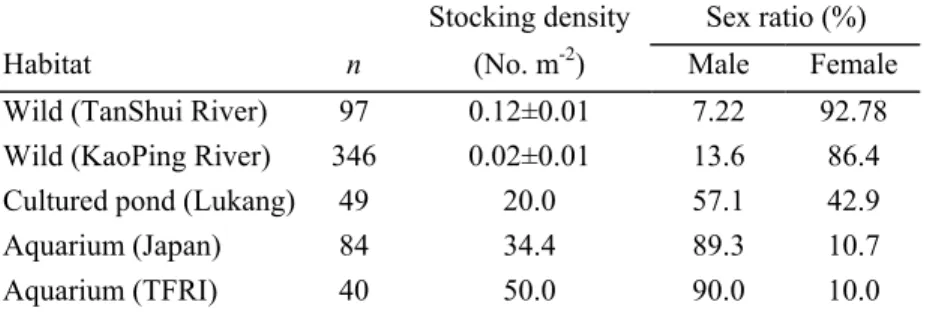
Table 1. Sex ratios of Anguilla japonica in the wild and in captivity.
Stocking density Sex ratio (%)
Habitat n (No. m-2) Male Female
Wild (TanShui River) 97 0.12±0.01 7.22 92.78 Wild (KaoPing River) 346 0.02±0.01 13.6 86.4 Cultured pond (Lukang) 49 20.0 57.1 42.9
Aquarium (Japan) 84 34.4 89.3 10.7
Aquarium (TFRI) 40 50.0 90.0 10.0
The sex ratio of eels reared at a density of 50.0 eels/m2 in an intensive aquarium at the TFRI was almost all males (90%) (Table 1), while females were dominant in the low-density Tanshui River of north Taiwan (Table 1, Tzeng et al., 1995), and males were dominant in a high-density aquarium in Japan (Table 1, Satoh and Nimura, 1991; 1992).
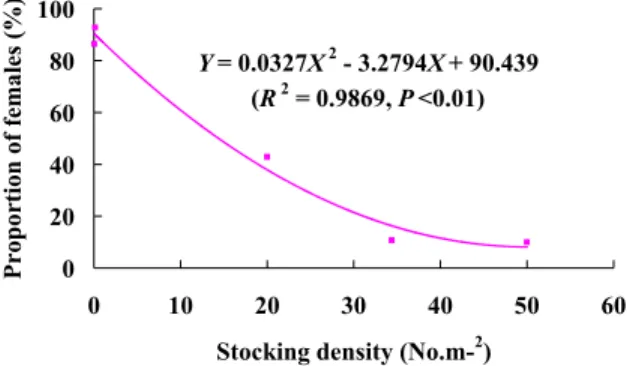
The proportion of females was negatively correlated with the stocking density of both wild and captive eels (R2=0.99, Fig. 5). Thus, the sex ratios of Japanese eels were predominately female at low densities and predominately male at high densities.
Y = 0.0327X2 - 3.2794X + 90.439 (R2 = 0.9869, P <0.01) 0 20 40 60 80 100 0 10 20 30 40 50 6
Stocking density (No.m-2)
Propo
rtion of females (%
)
0
Figure 5. The relationship between proportions of females and eel density.
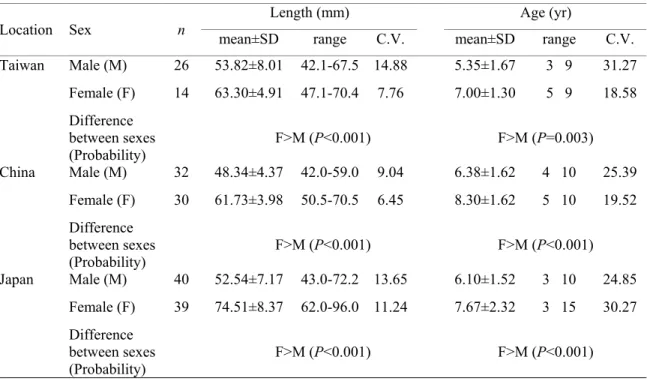
Table 2. Significant test of the difference in mean length and age of wild silver Japanese eels from Taiwan, China and Japan. C.V. (%) is the coefficient of variation.
Length (mm) Age (yr)
Location Sex n mean±SD range C.V. mean±SD range C.V.
Taiwan Male (M) 26 53.82±8.01 42.1-67.5 14.88 5.35±1.67 3 9 31.27 Female (F) 14 63.30±4.91 47.1-70.4 7.76 7.00±1.30 5 9 18.58 Difference between sexes (Probability) F>M (P<0.001) F>M (P=0.003) China Male (M) 32 48.34±4.37 42.0-59.0 9.04 6.38±1.62 4 10 25.39 Female (F) 30 61.73±3.98 50.5-70.5 6.45 8.30±1.62 5 10 19.52 Difference between sexes (Probability) F>M (P<0.001) F>M (P<0.001) Japan Male (M) 40 52.54±7.17 43.0-72.2 13.65 6.10±1.52 3 10 24.85 Female (F) 39 74.51±8.37 62.0-96.0 11.24 7.67±2.32 3 15 30.27 Difference between sexes (Probability) F>M (P<0.001) F>M (P<0.001)
2. Difference in growth strategies between sexes
The mean lengths of silver eels were significantly smaller for males than females from the Kaoping River of Taiwan and from China and Japan (P<0.001) (Table 2). This is probably because males have a higher von Bertalanffy growth coefficient (K) than do females. Thus, male eels grow faster to reach an asymptotic length (L∞) that is smaller than for female eels because the relationship between K and L∞ was inversely related between the sexes (Table 3).
Table 3. Parameters of the von-Bertalanffy growth equation for Japanese eel Anguilla japonica from Taiwan, China, and Japan.
Location Sex n K L∞ t0 Taiwan Male 26 0.28 59.43 -0.08 Female 14 0.17 79.79 -0.22 China Male 31 0.24 53.74 -0.22 Female 29 0.15 76.02 -0.43 Japan Male 40 0.28 56.43 -0.26 Female 39 0.23 80.02 -0.28
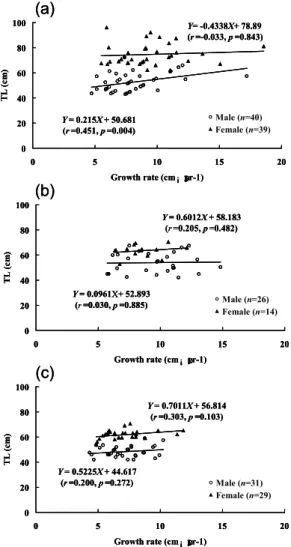
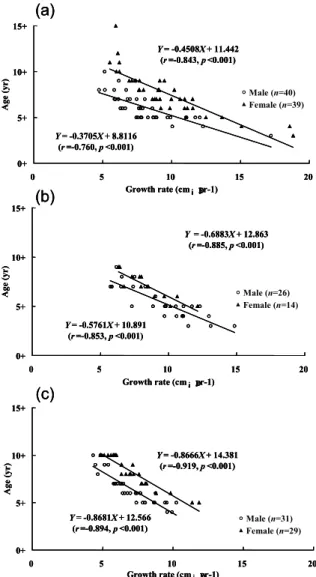
The regressions of length on growth rate were not significant for eels of either sex from Japan, Taiwan and China except the male of Japan (Fig 6). In contrast, the ages of both sexes were all significantly negatively correlated with their mean growth rates, irrespective of location (Fig.7). This indicated that the total lengths of silver eels did not change with growth rate, but the ages of silver eels changed with growth rate for both sexes. The coefficient of variation of the age of silver eels (18.58-31.27%) was approximately three-fold greater than that for the length of the eel (6.45-14.88%) (Table2). In other words, the length of the eel at metamorphosis from the yellow to silver eel stage was constant irrespective of the great variability in growth rates. However, the age at metamorphosis varied greatly with growth rate, with faster growing eels metamorphosing earlier than slower growing eels. The age of silver eels at metamorphosis from the yellow stage was more susceptible to influence by growth rate than was length.
(a) (b) (c) Y = 0.215X + 50.681 (r =0.451, p =0.004) Y= -0.4338X+ 78.89 (r =-0.033, p =0.843) 0 20 40 60 80 100 0 5 10 15 20
Growth rate (cm¡ Dyr-1)
TL ( cm ) Male (n=40) Female (n=39) Y = 0.0961X+ 52.893 (r =0.030, p =0.885) Y = 0.6012X + 58.183 (r =0.205, p =0.482) 0 20 40 60 80 100 0 5 10 15 20
Growth rate (cm¡ Dyr-1)
TL ( cm ) Male (n=26) Female (n=14) Y = 0.5225X + 44.617 (r =0.200, p =0.272) Y = 0.7011X + 56.814 (r =0.303, p =0.103) 0 20 40 60 80 100 0 5 10 15 20
Growth rate (cm¡ Dyr-1)
TL ( cm ) Male (n=31) Female (n=29) (a) (b) (c) (a) (b) (c) Y = 0.215X + 50.681 (r =0.451, p =0.004) Y= -0.4338X+ 78.89 (r =-0.033, p =0.843) 0 20 40 60 80 100 0 5 10 15 20
Growth rate (cm¡ Dyr-1)
TL ( cm ) Male (n=40) Female (n=39) Y = 0.215X + 50.681 (r =0.451, p =0.004) Y= -0.4338X+ 78.89 (r =-0.033, p =0.843) 0 20 40 60 80 100 0 5 10 15 20
Growth rate (cm¡ Dyr-1)
TL ( cm ) Male (n=40) Female (n=39) Y = 0.0961X+ 52.893 (r =0.030, p =0.885) Y = 0.6012X + 58.183 (r =0.205, p =0.482) 0 20 40 60 80 100 0 5 10 15 20
Growth rate (cm¡ Dyr-1)
TL ( cm ) Male (n=26) Female (n=14) Y = 0.0961X+ 52.893 (r =0.030, p =0.885) Y = 0.6012X + 58.183 (r =0.205, p =0.482) 0 20 40 60 80 100 0 5 10 15 20
Growth rate (cm¡ Dyr-1)
TL ( cm ) Male (n=26) Female (n=14) Y = 0.5225X + 44.617 (r =0.200, p =0.272) Y = 0.7011X + 56.814 (r =0.303, p =0.103) 0 20 40 60 80 100 0 5 10 15 20
Growth rate (cm¡ Dyr-1)
TL ( cm ) Male (n=31) Female (n=29) Y = 0.5225X + 44.617 (r =0.200, p =0.272) Y = 0.7011X + 56.814 (r =0.303, p =0.103) 0 20 40 60 80 100 0 5 10 15 20
Growth rate (cm¡ Dyr-1)
TL (
cm
)
Male (n=31) Female (n=29)
Figure 6. The total length relative to growth rate, by sex, of silver-phase Japanese eels from Japan (a), Taiwan (b) and China (c).
(a) (b) (c) Y = -0.3705X + 8.8116 (r =-0.760, p <0.001) Y = -0.4508X + 11.442 (r =-0.843, p <0.001) 0+ 5+ 10+ 15+ 0 5 10 15 20
Growth rate (cm¡ Dyr-1)
Age ( yr) Male (n=40) Female (n=39) Y = -0.5761X + 10.891 (r =-0.853, p <0.001) Y = -0.6883X + 12.863 (r =-0.885, p <0.001) 0+ 5+ 10+ 15+ 0 5 10 15 20
Growth rate (cm¡ Dyr-1)
A ge (yr) Male (n=26) Female (n=14) Y = -0.8681X + 12.566 (r =-0.894, p <0.001) Y = -0.8666X + 14.381 (r =-0.919, p <0.001) 0+ 5+ 10+ 15+ 0 5 10 15 20
Growth rate (cm¡ Dyr-1)
Age (yr ) Male (n=31) Female (n=29) (a) (b) (c) (a) (b) (c) Y = -0.3705X + 8.8116 (r =-0.760, p <0.001) Y = -0.4508X + 11.442 (r =-0.843, p <0.001) 0+ 5+ 10+ 15+ 0 5 10 15 20
Growth rate (cm¡ Dyr-1)
Age ( yr) Male (n=40) Female (n=39) Y = -0.3705X + 8.8116 (r =-0.760, p <0.001) Y = -0.4508X + 11.442 (r =-0.843, p <0.001) 0+ 5+ 10+ 15+ 0 5 10 15 20
Growth rate (cm¡ Dyr-1)
Age ( yr) Male (n=40) Female (n=39) Y = -0.5761X + 10.891 (r =-0.853, p <0.001) Y = -0.6883X + 12.863 (r =-0.885, p <0.001) 0+ 5+ 10+ 15+ 0 5 10 15 20
Growth rate (cm¡ Dyr-1)
A ge (yr) Male (n=26) Female (n=14) Y = -0.5761X + 10.891 (r =-0.853, p <0.001) Y = -0.6883X + 12.863 (r =-0.885, p <0.001) 0+ 5+ 10+ 15+ 0 5 10 15 20
Growth rate (cm¡ Dyr-1)
A ge (yr) Male (n=26) Female (n=14) Y = -0.8681X + 12.566 (r =-0.894, p <0.001) Y = -0.8666X + 14.381 (r =-0.919, p <0.001) 0+ 5+ 10+ 15+ 0 5 10 15 20
Growth rate (cm¡ Dyr-1)
Age (yr ) Male (n=31) Female (n=29) Y = -0.8681X + 12.566 (r =-0.894, p <0.001) Y = -0.8666X + 14.381 (r =-0.919, p <0.001) 0+ 5+ 10+ 15+ 0 5 10 15 20
Growth rate (cm¡ Dyr-1)
Age (yr
)
Male (n=31) Female (n=29)
Figure 7. The age relative to growth rate, by sex, of silver-phase Japanese eels from Japan (a), Taiwan (b) and China (c).
The sex ratio of Japanese eels at high stocking densities was dominated by males, as was also found for American and European eels (Parsons et al., 1977; Jessop, 1987; Beullens et al., 1997; Roncarati et al., 1997; Oliveira, 1997, 1999; Oliveira et al., 2001). If the sex determination of the eel is genotypically determined, then unequal sex distributions for eels in a river should result from different habitat preferences by each sex. Both sexes may have different hydrotaxis and migratory behavior with females prefering lacustrine habitats while males prefer fluvial habitats (Bertin, 1956; Todd, 1980; Haraldstad et al., 1985; Helfman et al., 1987; Krueger and Oliveira, 1999). However, we found that wild eels in the Kaoping River were mostly female, irrespective of their environmental history (Fig. 4). This indicated that there was no difference in marine or freshwater habitat preference between sexes. Furthermore, captivity limits eel migration and thus differences between the sexes in behaviour should not influence the sex ratio. Thus, the hypothesis that habitat choice was the proximate cause of the varied sex distributions in rivers may not be true.
Most studies agreed that population density is probably the principal factor determining the sex of the eel, with habitats having high densities of eels dominated by males and low density habitats dominated by females (Tesch, 1977; Krueger and Oliveira, 1999; Oliveira et al., 2001). Elver restocking experiments further support this conclusion (e.g. Parsons et al., 1997; Roncarati et al., 1997). Degani and Kushnirov (1992) demonstrated that European eels maintained at higher densities produced more males than those maintained at lower densities. Our data indicated that females predominated in the low density habitats in the rivers of Taiwan and males predominated in a crowded aquarium (Figs. 1-4, Table 1). Thus, eel sex determination may be due primarily to environmental factors, particularly density. Alternatively, the sex of elvers in high-density captivity could be feminized by the treatment of estradiol-17β (Degani and Kushnirov, 1992; Satoh et al., 1992; Chiba et al., 1993). We do not know if pollutants in the Kaoping River and estuary contained environmental hormone analogues capable of influencing the gender of eels.
In Taiwan, Japanese eel elvers in the estuary were overexploited for aquaculture (Tzeng, 1984; 1997). Consequently, the eel population density in the river was very low (Table 1). Thus, the high proportion of female eels in the rivers of Taiwan may support the density-dependent environmental sex determination hypothesis (Colombo et al., 1984; Krueger and Oliveira, 1999). How the signal of population density switches on the process of sex differentiation in the eel is unknown. However, it is clear that the variation in sex ratio, with high-density stocks dominated by males and low-density stocks dominated by females, is
advantageous for eel population growth.
Males at the metamorphosis from the yellow to the migratory silver eel stage are smaller and younger than females, i.e., the male eels exhibit a time-minimizing growth strategy by maturing as soon as possible, while females postpone maturation with a size-maximizing growth strategy to attain higher fecundity (Helfman et al., 1987; Vøllestad and Johnson, 1986; Larsson et al., 1990; Vøllestad, 1992). Thus, density-dependent sex determination is a very important mechanism for eel population regulation. In high-density habitats, food resources are limited and the earlier differentiation of males may promote an earlier spawning migration. This could reduce intraspecific competition and population mortality. In contrast, in low-density stocks, food resources are relatively plentiful and eels differentiating into females would have enough time to fully utilize the resources and grow larger to achieve higher fecundity and increased reproductive success. This could help in eel population recovery.
In conclusion, eel population density is probably a trigger for sex differentiation and the variation in sex ratio in conjunction with different growth strategies for each sex serves to maximize the evolutionary fitness of the eel. However, the mechanism of how population density generates the signal to begin sexual differentiation of the eel requires further study.
Acknowledgments
This study was financially supported by the National Science Council, Taiwan, R.O.C. (NSC-89-2311-B002-077 and NSC 89-2313-B056-008) and the Council of Agriculture, Executive Yuan, Taiwan, R.O.C. (90AS -1.4.5-FA-F1-36). The authors are grateful to Mr. G. H. Cheng for sample collection and data processing, Prof. H. R. Lin of China and Prof. H. P. Oka of Japan for providing specimens and Mr. B. M. Jessop of Canada for reviewing the manuscript.
References
Bertin, L. 1956. Eels: A Biological Study. Cleaver-Hume Press Ltd, London. 192pp.
Beulens, K., E.H. Eding, P. Gilson, F. Ollevier, J. Komen and C. J. Richter. 1997. Gonadal differentiation, intersexuallity and sex ratios of European eel (Anguilla anguilla L.) maintained in captivity. Aquaculture 153:135-150.
Chiba, H., K. Iwatsuk, K. Hayami and K. Yamauchi. 1993. Effect of dietary estradiol- 17β on feminization, growth and body composition in the Japanese eel (Anguilla japonica). Comp. Biochem. Physiol. 106A:367-372.
Colombo, G. and G. Grandi. 1996. Histological study of the development and sex differentiation of the gonad in the European eel. J. Fish Biol. 48:493-512.
Colombo, G., G. Grandi and R. Rossi. 1984. Gonad differentiation and body growth in Anguilla anguilla. L. J. Fish Biol. 24:215-228.
Degani, G. and D. Kushnirov 1992. Effects of 17β- estradiol and grouping on sex determination of European eels. Progressive Fish-Culturist 54:88-91. Ege, V. 1939. A revision of the genus Anguilla Shaw, a systematic, phylogenetic
and geographical study. Dana Report. 16:1-256.
Francis, R.I.C.C. 1990. Back-calculation of fish length: a critical review. J. Fish Biol 36:883-902.
Haraldstad, O., L.A. Vøllestad and B. Jonsson. 1985. Descent of European silver eels, Anguilla anguilla L., in a Norwegian watercourse. J. Fish Biol. 26:37-41.
Helfman, G.S., D.E. Facey, L.S. Hales and Jr.E.L. Bozeman. 1987. Reproductive ecology of the American eel. In: Common Strategies of Anadromous and Catadromous Fishes. (M. J. Dadswell, R. J. Klauda, C. M. Moffit, R.L., R.A. Saunders, Rulifson and J. E. Cooper, eds). Amer. Fish. Soc. Symp. 1, Bethesda, pp.42-56.
Jessop, B.M. 1987. Migrating American eels in Nova Scotia. Trans. Am. Fish. Soc. 116:161-170.
Krueger, W. and K. Oliveira. 1999. Evidence for environmental sex determination in the American eel, Anguilla rostrata. Env. Biol. Fish. 55:381-389. Larsson, P., S. Hamrin and L. Okla. 1990. Fat content as a factor inducing
Naturwissenschaften 77:488-490.
Matsui, I. 1972. Unagigaku: Eel Biology. Tokyo: Kosei-sha Kosei-Kaku.
Miura, T., K. Yamauchi, H. Takahashi and Y. Nagahama. 1991. Hormonal induction of all stages of spermatogenesis in vitro in the male Japanese eel (Anguilla japonica). Proceedings of the National Academy of Sciences of the United States of America. 88:5774-5778.
Mason, R. D., D.A. Lind and W.G. Marchal. 1994. Statistics (4th ed). Saunders College Publishing, USA, 660pp.
Oliveira, K. 1997. Movements and growth rates of yellow phase American eels, Anguilla rostrata, in the Annaquatucket River, Rhode Island. Trans. Am. Fish. Soc. 126:638-646.
Oliveira, K. 1999. Life history characteristics and strategies of the American eel, Anguilla rostrata. Can. J. Fish. Aquat. Sci. 56:795-802.
Oliveira, K., J.D. McCleave and G.S. Wippelhauser. 2001. Regional variation and the effect of lake: river area on sex distribution of American eels. J. Fish Biol. 58:943-952.
Park, E.H. and H. Grimm. 1981. Distribution of C-band heterochromatin in the ZW sex chromosomes of European and American eels (Anguillidae, Teleostomi). Cytogenet. Cell Genet. 31:167-174.
Parsons, J., K.U. Vickers and Y. Warden. 1977. Relationship between elver recruitment and changes in the sex ratio of silver eels Anguilla anguilla L. migrating from Lough Neagh, Northern Ireland. J. Fish Biol. 10:211-229.
Passakas, T. and R.Z. Klekowski. 1972. Chromosomes of European eel (Anguilla anguilla) as related to in vivo sex chromosome. Pol. Arch. Hydrobiol. 20:517-519.
Ricker, W. E. 1958. Handbook of computations for biological statistic of fish populations. Bull. Fish. Res. Board Canada 119.
density of European eel (Anguilla anguilla, L.) elvers on sex differentiation and zootechnical performances. J. Appl. Ichthyol. 13:131-136.
Sang, T. K., H.Y. Chang, T.C. Chen and C.F. Hui. 1994. Population structure of the Japanese eel Anguilla japonica. Mol. Biol Evol. 11:250-260. Satoh, H. and Y. Nimura. 1991. Growth promotion in Japanese eel by oral
administration of an estrogen (diethylstilbostrol). Nippon Suisan Gakkaishi 57:21-27.
Satoh, H., Y. Nimura and T. Hibiya. 1992. Sex control of the Japanese eel by an estrogen (DES-Na) in feed. Nippon Suisan Gakkaishi 58:1211-1218. Sola, L., G. Gentili and S. Cataudella. 1980. Eel chromosomes: cytotaxonomical
interrelationships and sex chromosomes. Copeia 4:911-913.
Tesch, F.W. 1977. The Eel. Biology and management of anguillid eels. London: Chapman and Hall.
Todd, P. R. 1980. Size and age of migrating New Zealand freshwater eel (Anguilla spp.). New Zealand J. Mar. Fresh. Res. 14:283-293.
Tsukamoto, K. 1992. Discovery of the spawning area for Japanese eel. Nature 356:789-791.
Tzeng, W.N. 1984. An estimate of the exploitation rate of Anguilla japonica elvers immigrating into the coastal waters of Shuang-Chi River, Taiwan. Bull. Inst. Zool. Acad. Sin. 23:173-180.
Tzeng, W.N., H.F. Wu and H Wickström. 1994. Scanning electron microscope analysis of annulus microstructure in otolith of European eel, Anguilla anguilla. J. Fish Biol. 45:479-492.
Tzeng, W.N., P.W. Cheng and F.Y. Lin. 1995. Relative abundance, sex ratio and population structure of the Japanese eel Anguilla japonica in the Tanshui River system of northern Taiwan. J. Fish Biol. 46:183-201.
Tzeng, W. N., J.J. Hsiao, H.P. Shen, Y.T. Chem, Y.T. Wang and J.Y. Wu. 1995. Feeding habit of the Japanese eel, Anguilla japonica, in the streams of
northern Taiwan. J. Fish. Soc. Taiwan 22:279-302.
Tzeng, W. N. 1997. Short- and long-term fluctuations in catches of elvers of the Japanese eel, Anguilla japonica. In Developing and Sustaining World Fisheries Resources: The State of Science and Management. 2nd World Fisheries Compress Proceedings, pp 85-89.
Tzeng, W.N., K.P. Severin and H. Wickström. 1997. Use of otolith microchemistry to investigate the environmental history of European eel Anguilla anguilla. Mar. Ecol. Prog. Ser. 149:73-81.
Tzeng, W.N., H.R. Lin, C.H. Wang and S.N. Xu. 2000a. Differences in size and growth rates of male and female migrating Japanese eels in Pearl River, China. J. Fish Biol. 57:1245-1253.
Tzeng, W.N., C.H. Wang, H. Wickström and M. Reizenstei. 2000b. Occurrence of the semi-catadromous European eel Anguilla anguilla (L.) in Baltic Sea. Mar. Biol. 137:93-98.
Tzeng, W.N., Y. Iizuka, J.C. Shiao, Y. Yamada and H.P. Oka. 2002. Identification and growth rates comparison of divergent migratory contingents of Japanese eel (Anguilla japonica). Aquaculture 61948 (2002) in press. Vøllestad, L.A. 1992. Geographic variation in age and length at metamorphosis of
maturing European eel: environmental effects and phenotypic plasticity. J. Anim. Ecol. 61:41-48.
Vøllestad, L.A. and B. Jonsson. 1986. Life-history characteristics of the European eel Anguilla anguilla in he Imsa River, Norway. Trans. Am. Fish. Soc. 115:864-871.
Wiberg, U.H. 1983. Sex determination in the European eel (Anguilla anguilla, L). Cytogenet. Cell Genet. 36: 589-598.
Yamamoto, K., M. Oomori and K. Yamauchi. 1974. Oogenesis of the Japanese eel. Bull. Jap. Soc. Sci. Fish. 40:9-15.
