DOI: 10.1002/ejoc.201101623
A BODIPY-Based Highly Selective Fluorescent Chemosensor for Hg
2+
Ions
and Its Application in Living Cell Imaging
Mani Vedamalai
[a]and Shu-Pao Wu*
[a]Keywords: Sensors / Mercury / Fluorescence / Imaging agents
A new boron–dipyrromethene (BODIPY) derivative (FS1) containing two triazole units exhibits an enhanced fluores-cence in the presence of Hg2+ions and a high selectivity forHg2+ions over competing metal ions in methanol: Ag+, Ca2+,
Cd2+, Co2+, Cu2+, Fe2+, Fe3+, K+, Mg2+, Mn2+, Ni2+, Pb2+, and
Introduction
Mercury is one of the most toxic heavy metal elements.
[1]It exists in three different forms: Inorganic mercury,
alkyl-mercury, and elemental mercury. Mercury contamination
occurs through various processes, such as the combustion
of fossil fuels, mining, and solid-waste incineration.
Mer-cury ions show a high affinity for thiol groups in proteins,
leading to the malfunction of cells and consequently
caus-ing many health problems in the brain, kidney, and central
nervous system. Its accumulation in the body can
contrib-ute to the development of a wide variety of diseases, such
as prenatal brain damage, serious cognitive and motion
dis-orders, and Minamata disease.
[2]Owing to the extreme
tox-icity of mercury, the United States Environmental
Protec-tion Agency (EPA) established the standard for the
maxi-mum allowed level of mercury in dietary and environmental
sources to be 2 ppb (10 n
m).
Numerous methods
[3]for the detection of mercury ions
in various samples have been proposed, including atomic
absorption/emission spectroscopy,
[4]inductively coupled
plasma-mass spectroscopy (ICPMS),
[5]inductively coupled
plasma-atomic emission spectrometry (ICP-AES),
[6]and
voltammetry.
[7]Most of these methods require expensive
in-struments and are not suitable for performing assays. Over
the past decade more attention has been focused on the
development of fluorescent chemosensors for the detection
of Hg
2+ions.
[8][a] Department of Applied Chemistry, National Chiao Tung University,
Hsinchu, Taiwan, Republic of China Fax: +886-3-5723764
E-mail: [email protected]
Supporting information for this article is available on the WWW under http://dx.doi.org/10.1002/ejoc.201101623.
Zn2+ produced only minor changes in the fluorescence of
FS1. The apparent dissociation constant (Kd) of FS1–Hg2+
was found to be 62μM. Moreover, fluorescence microscopy experiments showed that FS1 can be used as a fluorescent probe for detecting Hg2+ions in living cells.
Because Hg
2+is known to be a fluorescence quencher,
most fluorescent chemosensors detect Hg
2+by fluorescence
quenching through spin–orbit coupling.
[9]Owing to their
sensitivity, fluorescent chemosensors that detect metal ions
by fluorescence enhancement are more easily monitored
than those that operate by fluorescence quenching. This
pa-per reports on a newly designed BODIPY-based fluorescent
enhancement chemosensor for Hg
2+based on
photoin-duced electron transfer (PET). The binding of Hg
2+to the
chemosensor blocks the PET mechanism and greatly
en-hances the fluorescence of BODIPY.
In this work we designed a BODIPY-based fluorescent
chemosensor for metal-ion detection. Two parts make up
the chemosensor FS1: A BODIPY moiety as reporter and
two triazole units that chelate the metal ion (Scheme 1).
FS1 exhibits weak fluorescence due to quenching by
photo-induced electron transfer from the lone-pair electrons on
the nitrogen atom attached to the phenyl group. The
bind-ing of metal ions to the chemosensor blocks the PET
mechanism and results in considerable fluorescence
en-hancement of BODIPY. The metal ions Ag
+, Ca
2+, Cd
2+,
Co
2+, Cu
2+, Fe
2+, Fe
3+, Hg
2+, K
+, Mg
2+, Mn
2+, Ni
2+, Pb
2+,
and Zn
2+were tested for metal-ion-binding selectivity with
FS1, but Hg
2+was the only ion that caused green emission
upon binding with FS1.
Results and Discussion
Synthesis of FS1
The synthesis of FS1 is outlined in Scheme 1. Aniline
was treated with propargyl bromide in the presence of
K
2CO
3to afford compound 1. Compound 2 was obtained
Scheme 1. Synthesis of FS1.
DMF at 80 °C. Treatment of compound 2 with excess
pyrrole in the presence of TFA under nitrogen yielded the
corresponding dipyrromethane 3. In the next step,
com-pound 3 was oxidized with DDQ to yield the corresponding
dipyrromethene, which was transformed into the BODIPY
skeleton 4 in the presence of BF
3under N
2. Treatment of
compound 4 with picolyl azide yielded FS1 under click
chemistry conditions. FS1 has an absorbance maximum at
493 nm, assigned to the S
0씮S
1transition of the BODIPY
chromophore,
[10]and a molar extinction coefficient of
3.83
⫻ 10
4m
–1cm
–1. FS1 displays weak fluorescence with a
quantum yield of Φ = 0.002, because photoinduced electron
transfer from the aromatic amine group to the BODIPY
moiety takes place.
Figure 1. Color (top) and fluorescence (bottom) changes in FS1 (30 μm) upon the addition of various metal ions (60 μm) in methanol.
Cation-Sensing Selectivity
The sensing ability of FS1 was tested by mixing it with
the metal ions Ag
+, Ca
2+, Cd
2+, Co
2+, Cu
2+, Fe
2+, Fe
3+,
Hg
2+, K
+, Mg
2+, Mn
2+, Ni
2+, Pb
2+, and Zn
2+.
Qualita-tively, Hg
2+was the only ion that caused a change in color
(from red to yellow) of the FS1 solution and green
fluores-cence from FS1 (Figure 1). Other metal ions had no
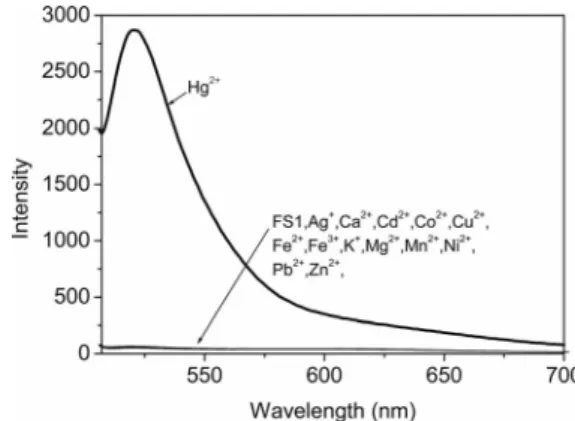
signifi-cant effect on the fluorescence of FS1. Quantitative
fluores-cence spectra of FS1 were recorded in the presence of
sev-eral transition-metal ions. Hg
2+was the only metal ion that
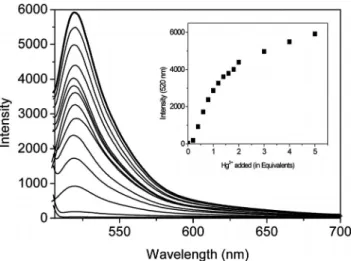
caused significant green emission (Figure 2). During the
ti-tration of FS1 against Hg
2+, a new emission band centered
at 520 nm was observed (Figure 3). After the addition of
4 equiv. of Hg
2+, the emission intensity reached a
maxi-mum. The quantum yield of the emission band was Φ =
0.035, which is 17-fold higher than that of FS1, with Φ =
0.002. These results indicate that Hg
2+is the only metal ion
of those studied that readily binds to FS1, causing
signifi-cant fluorescence enhancement and permitting the highly
selective detection of Hg
2+.
Figure 2. Fluorescence response of FS1 (30 μm) to various metal cations (30 μm) in methanol. The excitation wavelength was 492 nm.
To study the influence of other metal ions on the binding
of Hg
2+to FS1, we performed competitive experiments
with Hg
2+(150 μ
m) and other metal ions (150 μm;
mix-Figure 3. Fluorescence response of FS1 (30 μm) to various equiva-lents of Hg2+in methanol. The excitation wavelength was 492 nm.
tures of Hg
2+with most metal ions was similar to that
caused by Hg
2+alone. Reduced fluorescence enhancement
was observed when Hg
2+was mixed with Co
2+or Fe
3+.
This indicates that only Co
2+and Fe
3+compete with Hg
2+for binding with FS1. Most of the other metal ions do not
interfere with the binding of FS1 to Hg
2+.
Figure 4. Fluorescence response of FS1 (30 μm) to Hg2+(150 μm)
and other metal ions (150 μm; black bars) and to mixtures of Hg2+
(150 μm) with other metal ions (150 μm; gray bars) in methanol.
To determine the binding stoichiometry of the FS1–Hg
2+complex, the emission intensity of FS1 at 520 nm was
plot-ted as a function of the molar fraction of FS1 under a
con-stant total concentration. The resulting Job plot is shown
in Figure 5. The maximum emission intensity was reached
when the molar fraction was 0.5, which indicates a 1:1 ratio
for the FS1–Hg
2+complex, that is, one Hg
2+ion binds to
one molecule of FS1. Furthermore, the formation of a 1:1
FS1–Hg
2+complex was confirmed by ESI-MS, in which the
peak at m/z = 828.1 indicates a 1:1 stoichiometry for the
FS1–Hg
2+complex (see Figure S9 in the Supporting
Infor-mation). The apparent dissociation constant was calculated
from Figure 3 by using a nonlinear regression analysis; a
value of 62.1
⫾5.7 μm was determined (see Figure S10 in
the Supporting Information). The detection limit of FS1 as
a fluorescent sensor for the analysis of Hg
2+was
deter-mined from the variation of fluorescence intensity as a
function of the concentration of Hg
2+(see Figure S12 in
the Supporting Information). It was found that FS1 has a
detection limit of 2.8 μ
m, which allows micromolar
concen-trations of Hg
2+to be detected.
Figure 5. Job plot of FS1–Hg2+complexes in methanol. The
solu-tions were monitored at a wavelength of 520 nm. The total concen-tration of the sensor and Hg2+ion was 250 μm.
To gain a clearer understanding of the structure of the
FS1–Hg
2+complex,
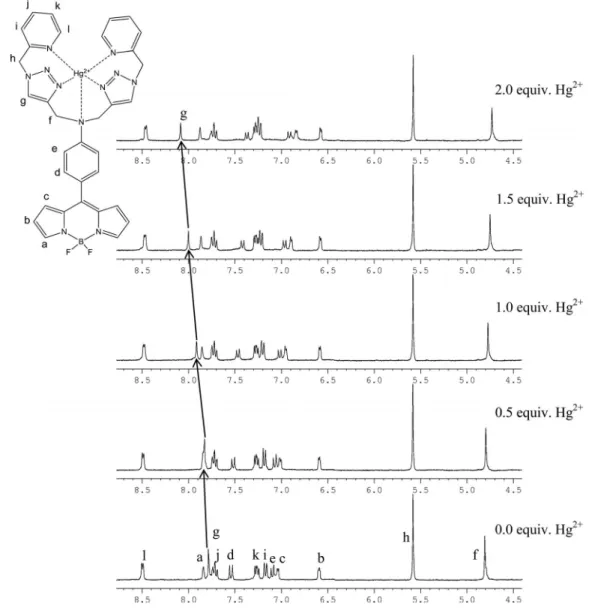
1H NMR spectroscopy (Figure 6) was
employed. Hg
2+is a heavy metal ion and can affect the
proton signals that are close to the Hg
2+binding site.
[11]The
1H NMR spectra of FS1 recorded with increasing
amounts of Hg
2+show that the proton (H
g
, triazole) signal
at δ = 7.8 ppm is shifted downfield as Hg
2+is added. This
indicates that Hg
2+binds to FS1 mainly through the
nitro-gen atom in the triazole ring. The proton signals H
eand
H
dare shifted upfield upon addition of Hg
2+. This also
indicates that Hg
2+binds through the amino group
at-tached to the phenyl ring. The proton signals from H
i, H
j,
H
k, and H
lon the pyridine ring are slightly affected by the
binding of Hg
2+. These observations show that Hg
2+binds
to FS1 through an amino group, two nitrogen atoms of two
triazole units, and two pyridine nitrogen atoms.
A pH titration of FS1 was carried out to investigate a
suitable pH range for Hg
2+sensing. As depicted in Figure 7,
the emission intensities of metal-free FS1 are very low at all
pH values. After mixing FS1 with Hg
2+, the emission
inten-sity at 520 nm is markedly higher at pH = 5.0 and is a
maxi-mum in the pH range 5.0–10.0. At pH
⬎ 10, the emission
intensity decreases. This indicates poor stability of the FS1–
Hg
2+complexes at high pH values. At pH
⬍ 5, the emission
intensity is also lower due to the protonation of the amino
groups, which prevents the formation of the FS1–Hg
2+complex.
Living Cell Imaging
FS1 was also used for living cell imaging. For the
detec-tion of Hg
2+in living cells, HeLa cells were treated with
20 µ
m Hg(BF
4)
2for 30 min and washed with
phosphate-buffered saline (PBS) three times. Then the cells were
incu-bated with FS1 (20 µ
m) for 30 min and washed with PBS to
Figure 6.1H NMR spectra of FS1 (5 mm) in the presence of different concentrations of Hg2+in CD 3CN.
Figure 7. Fluorescence intensity (520 nm) of free FS1 (30 μm; 䊊) and of FS1 after the addition of Hg2+ (150 μm; 䊏) in methanol/
water solution (9:1, v/v; 1 mm buffer) as a function of the pH. The excitation wavelength was 492 nm. Buffer solutions: pH = 1–2, KCl/HCl; pH = 2.5–4, KHP/HCl; pH = 4.5–6, KHP/NaOH; pH = 6.5–12 HEPES.
Figure 8. Hg2+-treated HeLa cell images. Top left: bright-field
remove any remaining sensor. Images of the HeLa cells
were obtained with a fluorescence microscope. Figure 8
shows the images of the HeLa cells with FS1 after treatment
of Hg
2+. The overlapping of the fluorescence and
bright-field images reveals that the fluorescence signals are
local-ized in the intracellular area, which indicates a subcellular
distribution of Hg
2+and good permeability of the cell
membrane of FS1.
Conclusions
The new fluorescence chemosensor FS1 exhibits a high
affinity and selectivity for Hg
2+ions over competing metal
ions. The fluorescence of FS1 was significantly enhanced in
the presence of Hg
2+, and the addition of Ag
+, Ca
2+, Cd
2+,
Co
2+, Cu
2+, Fe
2+, Fe
3+, K
+, Mg
2+, Mn
2+, Ni
2+, Pb
2+, or
Zn
2+barely affected the fluorescence. This BODIPY-based
Hg
2+chemosensor is also an effective method for Hg
2+sensing in living cell imaging.
Experimental Section
General: All solvents and reagents were obtained from commercial sources and used as received without further purification. UV/Vis spectra were recorded with an Agilent 8453 UV/Vis spectrometer. Fluorescence spectra were recorded with a Hitachi F-4500 spec-trometer.1H and13C NMR spectra were recorded with a Bruker
DRX-300 NMR spectrometer.
Synthesis of N,N-Diprop-2-ynylaniline (1): Compound 1 was ob-tained in modest yield by treating aniline with propargyl bromide in the presence of potassium carbonate.[12]
Synthesis of 4-(Diprop-2-ynylamino)benzaldehyde (2): Phosphorus oxychloride (306.7 mg, 2 mmol) was added dropwise to a solution of compound 1 (338.2 mg, 2 mmol) in DMF (2 mL), and the mix-ture was then heated at 90 °C for 3 h. After cooling to ambient temperature, the reaction mixture was dissolved in CH2Cl2
(100 mL) and washed with a dilute sodium hydrogen carbonate solution. The solvent was evaporated under reduced pressure, and the crude product was purified by column chromatography (ethyl acetate/hexane, 1:10) to give compound 2 as a white solid. Yield: 354.7 mg (90 %); m.p. 54–55 °C.1H NMR (CDCl 3): δ = 9.82 (s, 1 H), 7.81 (d, J = 8.7 Hz, 2 H), 6.96 (d, J = 8.7 Hz, 2 H), 4.22 (d, J = 2.4 Hz, 4 H), 2.30 (t, J = 2.4 Hz, 2 H) ppm.13C NMR (CDCl 3): δ = 191.0, 152.2, 132.2, 127.9, 113.7, 78.7, 73.6, 40.5 ppm. MS (EI): m/z (%) = 197 (100.0), 172 (13.86), 167 (58.54), 132 (19.59). HRMS (EI): calcd. for C13H11NO 197.0841; found 197.0838.
Synthesis of 4-[Bis(1H-pyrrol-2-yl)methyl]-N,N-diprop-2-ynylaniline (3): Trifluoroacetic acid (TFA, 0.1 mL) was added to a solution of compound 2 (296 mg, 1.5 mmol) in pyrrole (2 mL). The solution was stirred under nitrogen at room temperature for 4 h, and the reaction was then quenched with 0.1m sodium hydroxide. The or-ganic phase was extracted with ethyl acetate and dried with anhy-drous MgSO4. The solvent was evaporated under reduced pressure,
and the crude product was purified by column chromatography (ethyl acetate/hexane, 3:10) to give compound 3 as a yellowish vis-cous liquid. Yield: 389.9 mg (83 %).1H NMR (CDCl
3): δ = 7.91 (s, 2 H), 7.13 (d, J = 8.7 Hz, 2 H), 6.91 (d, J = 8.7 Hz, 2 H), 6.67– 6.69 (m, 2 H), 6.15 (q, J = 2.7 Hz, 2 H), 5.91–5.94 (m, 2 H), 5.42 (s, 1 H), 4.11 (d, J = 2.4 Hz, 4 H), 2.25 (t, J = 2.4 Hz,2 H) ppm. 13C NMR (CDCl 3): δ = 146.4, 133.1, 132.8, 129.0, 117.0, 115.6, 108.1, 106.9, 79.1, 72.8, 42.9, 40.4 ppm. MS (FAB): m/z = 313. HRMS (FAB): calcd. for C21H19N3313.1579; found 313.1578.
Synthesis of 4,4-Difluoro-8-[4-(N,N-diprop-2-ynylamino)phenyl]-4-bora-3a,4a-diaza-s-indacene (4): 2,3-Dichloro-5,6-dicyano-1,4-benzoquinone (DDQ; 318 mg, 1.4 mmol) dissolved in CH2Cl2
(50 mL) was added to a solution of compound 3 (376 mg, 1.2 mmol) in CH2Cl2 (100 mL) under nitrogen, and the mixture
was stirred for 3 h. It was then treated with Et3N (4 mL) and
BF3·OEt2(5 mL) for 12 h. The solvent was evaporated under
re-duced pressure, and the crude product was purified by column chromatography (ethyl acetate/hexane, 1:10) to give compound 4 as an orange solid. Yield: 258.6 mg (60 %); m.p. 226–227 °C. 1H
NMR (CDCl3): δ = 7.90 (s, 2 H), 7.58 (d, J = 8.7 Hz, 2 H), 7.02–
7.05 (m, 4 H), 6.55 (d, J = 2.4 Hz, 2 H), 4.24 (d, J = 2.4 Hz, 4 H), 2.33 (t, J = 2.4 Hz, 2 H) ppm.13C NMR: δ = 149.7, 147.8, 142.6,
134.6, 132.6, 131.1, 124.2, 118.0, 113.7, 78.4, 73.1, 40.2 ppm. MS (FAB): m/z = 359. HRMS (FAB): calcd. for C21H16BF2N3
359.1405; found 359.1407.
Synthesis of 4,4-Difluoro-8-[4-(N,N-bis{[1-(pyridin-2-ylmethyl)-1H- 1,2,3-triazol-4-yl]methyl}amino)phenyl]-4-bora-3a,4a-diaza-s-indacene (FS1): Picolyl azide (180 mg, 1.34 mmol), CuSO4·5H2O,
(16.8 mg, 10 mol-%), and sodium ascorbate (26.6 mg, 20 mol-%) were added to a solution of compound 4 (240.6 mg, 0.67 mmol) in THF/H2O (7:3, v/v; 15 mL) under nitrogen. The solution was
stirred at room temperature for 12 h. A saturated ammonium chloride solution (20 mL) was added to the reaction mixture, and the organic phase was extracted with dichloromethane (10 mL, 3⫻). The combined organic extracts were dried with anhydrous MgSO4. The solvent was evaporated under reduced pressure, and
the crude product was purified by column chromatography (dichlo-romethane/methanol, 6:1) to give compound FS1 as a dark-red so-lid. Yield: 320.0 mg (76 %); m.p. 145–146 °C.1H NMR (CD 3CN): δ = 8.50 (d, J = 4.2 Hz, 2 H), 7.84 (s, 2 H), 7.79 (s, 2 H), 7.72 (dt, J= 1.8, 7.5 Hz, 2 H), 7.53 (d, J = 9.0 Hz, 2 H), 7.26 (dd, J = 4.8, 7.5 Hz, 2 H), 7.18 (d, J = 7.8 Hz, 2 H), 7.09 (d, J = 8.7 Hz, 2 H), 7.03 (d, J = 3.9 Hz, 2 H), 6.59 (dd, J = 2.1, 4.1 Hz, 2 H), 5.58 (s, 4 H), 4.81 (s, 4 H) ppm. 13C NMR (CD 3CN): δ = 155.7, 151.8, 150.4, 149.2, 145.2, 142.5, 138.0, 134.9, 134.0, 131.8, 124.4, 124.0, 122.9, 122.8, 118.7, 113.4, 55.8, 46.8 ppm. MS (ESI): m/z = 628.3 [M + H]+. HRMS (ESI): calcd. for C
33H29BF2N11 [M + H]+
628.2669; found 628.2678.
Determination of the Binding Stoichiometry and the Apparent Disso-ciation Constants for the Binding of HgIIto FS1: The binding stoi-chiometry of the FS1–Hg2+complex was determined from a Job
plot. The fluorescence intensity at 520 nm was plotted against the molar fraction of FS1 with a total concentration of the sensor and Hg2+ion of 250 μm. The molar fraction at maximum emission
in-tensity represents the binding stoichiometry of the FS1–Hg2+
com-plex. The maximum emission intensity was reached at a molar frac-tion of 0.5 (Figure 4). This result indicates that chemosensor FS1 forms a 1:1 complex with Hg2+. The apparent dissociation constant
(Kd) was calculated by nonlinear regression analysis.[13]The plot
was fitted with normalized fluorescence emission intensity against the concentration of the Hg2+ ion according to Equation (1) in
which F is the fluorescence intensity at 520 nm at any given Hg2+
concentration, Fminis the fluorescence intensity at 520 nm in the
absence of Hg2+, F
max is the maximum fluorescence intensity at
520 nm in the presence of Hg2+, n is the number of Hg2+ ions
bound per probe molecule, and Kdis the dissociation constant: n
= 1 according to the Job plot.
Cell Culture: The cell line HeLa was provided by the Food Industry Research and Development Institute (Taiwan). The HeLa cells were grown in DMEM supplemented with 10 % FBS at 37 °C and 5 % CO2. Cells were plated on 14 mm glass coverslips and allowed
to adhere for 24 h.
Fluorescence Imaging: HeLa cells were cultured in Dulbecco’s mo-died Eagle’s medium (DMEM) supplemented with 10 % fetal bo-vine serum (FBS) at 37 °C under an atmosphere of 5 % CO2. Cells
were plated on 14 mm glass coverslips and allowed to adhere for 24 h. Experiments to assess the Hg2+uptake were performed in
phosphate-buffered saline (PBS) with 20 µm Hg(BF4)2. The cells
were treated with 10 mm solutions of Hg(BF4)2(2 µL; final
concen-tration: 20 µm) dissolved in sterilized PBS (pH = 7.4) and incubated at 37 °C for 30 min. The treated cells were washed with PBS (3⫻2 mL) to remove remaining metal ions. Culture medium (2 mL) was added to the cell culture, which was then treated with a 10 mm solution of chemosensor FS1 (2 µL; final concentration: 20 µm) dissolved in DMSO. The samples were incubated at 37 °C for 30 min. The culture medium was removed, and the treated cells were washed with PBS (3⫻2 mL) before observation. Fluorescence imaging was performed with a ZEISS Axio Scope A1 fluorescence microscope. Cells loaded with FS1 were excited at 480 nm by using a 50 W Hg lamp. An emission filter of 535 nm was used.
Supporting Information (see footnote on the first page of this arti-cle): 1H and13C NMR spectra of compounds 2, 3, 4, and FS1;
ESI-MS of FS1–Hg2+.
Acknowledgments
We gratefully acknowledge the financial support of the National Science Council (ROC) and National Chiao Tung University.
[1] a) D. W. Boening, Chemosphere 2000, 40, 1335–1351; b) J. M. Benoit, W. F. Fitzgerald, A. W. Damman, Environ. Res. 1998,
78, 118–133; c) A. Renzoni, F. Zino, E. Franchi, Environ. Res. 1998, 77, 68–72; d) H. H. Harris, I. J. Pickering, G. N. George,
Science2003, 301, 1203.
[2] a) T. Takeuchi, N. Morikawa, H. Matsumoto, Y. Shiraishi,
Acta Neuropathol.1962, 2, 40–57; b) M. Harada, Crit. Rev.
Toxicol.1995, 25, 1–24.
[3] K. Leopold, M. Foulkes, P. Worsfold, Anal. Chim. Acta 2010,
663, 127–138.
[4] a) Y. Gao, S. De Galan, A. De Brauwere, W. Baeyens, M. Leer-makers, Talanta 2010, 82, 1919–1923; b) M. J. da Silva, A. P. S. Paim, M. F. Pimentel, M. L. Cervera, M. de la Guardia, Anal.
Chim. Acta2010, 667, 43–48.
[5] a) F. Moreno, T. Garcia-Barrera, J. L. Gomez-Ariza, Analyst 2010, 135, 2700–2705; b) M. V. B. Krishna, K. Chandraseka-ran, D. Karunasagar, Talanta 2010, 81, 462–472; c) W. R. L. Cairns, M. Ranaldo, R. Hennebelle, C. Turetta, G. Capodaglio, C. F. Ferrari, A. Dommergue, P. Cescon, C. Barbante, Anal.
Chim. Acta2008, 622, 62–69.
[6] X. Chai, X. Chang, Z. Hu, Q. He, Z. Tu, Z. Li, Talanta 2010,
82, 1791–1796.
[7] a) X. Fu, X. Chen, Z. Guo, C. Xie, L. Kong, J. Liu, X. Huang,
Anal. Chim. Acta2011, 685, 21–28; b) F. Wang, X. Wei, C. Wang, S. Zhang, B. Ye, Talanta 2010, 80, 1198–1204. [8] a) X. Guo, X. Qian, L. Jia, J. Am. Chem. Soc. 2004, 126, 2272–
2273; b) J. Wang, X. Qian, Chem. Commun. 2006, 109–111; c) M. Yuan, Y. Li, J. Li, C. Li, X. Liu, J. Lv, J. Xu, H. Liu, S. Wang, D. Zhu, Org. Lett. 2007, 9, 2313–2316; d) A. Coskun, M. D. Yilmaz, E. U. Akkaya, Org. Lett. 2007, 9, 607–609; e) M. H. Lee, S. W. Lee, S. H. Kim, C. Kang, J. S. Kim, Org. Lett. 2009, 11, 2101–2104; f) J. Fan, K. Guo, X. Peng, J. Du, J. Wang, S. Sun, H. Li, Sens. Actuators B 2009, 142, 191–196; g) V. Bhalla, R. Tejpal, M. J. Kumar, A. Sethi, Inorg. Chem. 2009,
48, 11677–11684; h) K. G. Vaswani, M. D. Keranen, Inorg.
Chem.2009, 48, 5797–5800; i) N. Wanichacheva, M. Siriprum-poonthum, A. Kamkaew, K. Grudpan, Tetrahedron Lett. 2009,
50, 1783–1786; j) J. Du, J. Fan, X. Peng, P. Sun, J. Wang, H. Li, S. Sun, Org. Lett. 2010, 12, 476–479; k) W. Shi, S. Sun, X. Li, H. Ma, Inorg. Chem. 2010, 49, 1206–1210; l) S. Atilgan, T. Ozdemir, E. U. Akkaya, Org. Lett. 2010, 12, 4792–4795; m) O. A. Bozdemir, R. Guliyev, O. Buyukcakir, S. Selcuk, S. Kole-men, G. Gulseren, T. Nalbantoglu, H. Boyaci, E. U. Akkaya,
J. Am. Chem. Soc.2010, 132, 8029–8036. [9] D. S. McClure, J. Chem. Phys. 1952, 20, 682–686.
[10] a) W. Qin, T. Rohand, W. Dehaen, J. N. Clifford, K. Driesen, D. Beljonne, B. Van Averbeke, M. Van der Auweraer, N. Boens,
J. Phys. Chem. A2007, 111, 8588–8597; b) A. Loudet, K. Bur-gess, Chem. Rev. 2007, 107, 4891–4932.
[11] M. Kaupp, O. L. Malkina, V. G. Malkin, P. Pyykko, Chem.
Eur. J.1998, 4, 118–126.
[12] N. G. Kundu, B. Nandi, J. Org. Chem. 2001, 66, 4563–4575. [13] S. C. Dodani, Q. He, C. J. Chang, J. Am. Chem. Soc. 2009, 131,
18020–18021.
Received: November 10, 2011 Published Online: January 4, 2012