Facilitating Interactive ADR Signal Detection and Analysis with
Data Cube Technology
Wen-Yang Lin and He-Yi Li
Dept. of Computer Science and Information Engineering
National University of Kaohsiung
[email protected], [email protected]
Abstract
Adverse Drug Reaction (ADR) is one of the most important issues on drug safety assessment. In the past few years, many approaches that utilizes statistical and data mining methods for detecting ADRs has been proposed. However, most of these stand-alone methods are tedious and inconvenient to users and the processes of exploration are time-consuming. In a previous work, we have proposed an interactive system platform for ADR detection, which by integrating the ADR data warehouse and innovative frequent pattern mining techniques, can support multidimensional analysis of ADRs. In this paper, we enhance the performance of the platform further. Specifically, a data cube-based method for facilitating interactive detection of suspected ADR signals is proposed.
Keywords: Pharmacovigilance, adverse drug
reactions, data mining, contingency cube, data cube.
1. Introduction
Adverse Drug Reactions (ADRs) or Adverse Drug Events (ADEs) refer to uncomfortable, noxious, unexpected, or potentially harmful reactions resulting from the use of given medications for patients [5]. Notably, it refers to the reaction arisen from the normal doses of drugs for disease prevention, diagnosis, treatment, or for the modification of the physiological functions, thus excludes drug withdrawal symptoms, including drug abuse, poisoning or drug overdose. Adverse drug reactions would waste a lot of unnecessary social resources, bringing different levels of psychological or physiological sufferings to patients and their relatives. They also would limit the efficacy of treatments and increase the waste of medical resources, thereby increase medical costs and decrease medical quality.
The most famous event of adverse drug reactions occurred in 1950, when the new drug Thalidomide made in German that was used to relieve pregnancy caused more than 12000 fetus limb deformities and more than 1300 people are suffering from polyneuritis in more than twenty countries in Europe and Japan. After this event, all countries in the world established strict adverse drug reaction reporting procedures, such as the United Kingdom's Yellow
Card Scheme. The Department of Health in Taiwan also established an adverse drug reaction reporting system and formulated relevant laws and regulations for upgrading the public for the attention of drug safety [1]. These reporting systems collected a lot of instant accessible data for drug safety.
In light of the above, if more signals of adverse drug reactions can be extracted from reporting systems to exhort humans the risk of drug usage, a large amount of tragedies and accidents can be avoided.
Currently, many studies have been conducted to detect possible adverse drug reactions or analyze the factors of adverse drug reactions. These studies generally can be divided into two categories. The first category focuses on how to employ statistical or data-mining methods to identify signals of adverse drug reactions [6, 10, 12, 13, 14, 15, 23]. These stand-alone methods, without integration with knowledge discovery systems, are tedious and inconvenient for users to identify possible adverse drug reactions. Another category is devoted to the construction of adverse drug reactions exploration systems [3, 13]. Although users can use these systems to identify possible adverse drug reactions, they have to wait a long time to see the results of each exploration process and would likely become reluctant to exploit further from different viewpoints.
Based on the above observation, we have developed a platform for analyzing adverse drug reactions by hybridizing data warehousing and data mining technologies [2], through which users can observe and analyze adverse drug reactions from different views. In this paper, we enhance the performance of the platform further. Specifically, a contingency cube-based method for facilitating interactive detection of suspected ADR signals is proposed. Experimental results show that the cube-based approach significant outperforms our previous associative-classification-based approach; users can employ interactive exploitation of suspected association of drugs and symptoms from data warehouse more efficiently.
The reminder of this paper is organized as follows. In Section 2, related work and terminology is described. The proposed method is described in Section 3. Section 4 presents the experiments and the conclusions are summarized in Section 5.
2. Related Work
Adverse Drug Reaction (ADR) is one of the most important issues on drug safety assessment. In fact, many of adverse drug reactions cannot be discovered through limited pre-marketing clinical trials; instead, they can only be recognized by a long term of post-marketing surveillance of drug usages. In light of this, how to detect adverse drug reactions as early as possible has been an important research topic to the pharmaceutical industry. This topic is called pharmacovigilance [18]. Recently, the accumulation of large volumes of adverse events and the flourishing of data mining technology have encouraged the development of statistical or data mining methods for detecting ADRs. These methods can be summarized into two categories: the measures of disproportionality and the Bayesian method.
The measures of disproportionality are commonly used techniques for indentifying ADRs. Although different measures for calculating of disproportionality are not concord, they are all based on the 2×2 contingency table as shown in Table 1. The most famous measures include Proportional Reporting Ratio (PRR) used by the UK Yellow Card database [12], Reporting Odds Ratio (ROR) used by the Netherlands Pharmacovigilance Foundation [11], and the MHRA, an integrated measure used by UK Medicines and Healthcare products Regulatory Agency (MHRA) [12]. MHRA combines the PRR, the numbers of reporting, and the measure of chi-squared test. The definitions of these measures are shown in Table 2.
Table 1. The 2×2 contingency table used for identifying ADRs.
Suspected
ADR All other ADRs Total Suspected drug a b a + b All other drugs c d c + d Total a + c b + d a + b + c + d Table 2. The measures of proportionality used for
identifying ADRs.
Measure Formula Definition PRR ) /( ) /( d c c c a a + + PRR − 1.96δ > 1 ROR d b c a / / ROR − 1.96δ > 1 MHRA PRR, a, χ2 PRR ≥ 2, a ≥ 3, χ2 ≥ 4
The most well-known Bayesian-based menthod is Bayesian Confidence Propagation Neural Network (BCPNN) used by World Health Organization (WHO) [6][19]. This approach implements Bayesian statistics in a neural network architecture and calculates an
information component (IC) for each drug–ADR combination. The IC value measures the strength of association between the two variables, a drug x and a ADR y, which is defined as the following formula:
) )( ( ) ( log ) ( ) ( ) , ( log2 2 c a b a d c b a a y p x p y x p IC + + + + + = ≡
where p(x) is the probability of drug x in all reports, p(y) is the probability of ADR y in all reports, and p(x, y) is the probability of drug x and ADR y together in all reports. If the IC value of a drug-ADR pair is higher than a threshold, the drug is regarded to have a significant association with the ADR.
US Food and Drug Administration (FDA) uses an algorithm called Empirical Bayes Gamma-Poisson Shrinker (EBGPS) to detect the ADRs which have the frequency of reporting higher than the expected value [9]. This algorithm also uses Bayesian statistical formula to calculate the observed reporting value and expected reporting value for each drug-ADR pair. The observed ratio of reporting value and expected reporting value represents the strength of signal of drug-ADR pair. A drug-ADR pair with observed ratio higher than the threshold is more significant for further investigation.
An algorithm that adopts the temporal association rule technology, called MUTARC, is proposed by Jin et al. [15]. Using a database provided by Queensland Department of Health, called Queensland Linked Data Set Jin et al. defined an Unexpected Temporal Association Rule (UTAR) to identify ADRs. In other words, if an event happened in a certain period after medication of a patient unexpectedly, then this event may be an ADR. So, the algorithm must prune the expected events which are the diseases of the patient before a process of exploration, and use support and leverage [21] to filter and order the association rules. The support of an association rule refers to the percentage of the total reports for which the pattern is true. The leverage of an association rule refers to the measure of dependency between the antecedent (factor) X and consequent (symptom) Y of a rule. An association rule with leverage higher than zero means X is regarded to have a positive association with Y, that with leverage less than zero means X is negatively associated with Y, and that with leverage equal to zero means X is independent with Y. The formula of leverage is defined in the following.
Leverage(X → Y) = sup(X ∩ Y) – sup(X)sup(Y)
= 2 ) (a b c d bc ad + + + −
In addition, Jin et al. also used PRR (called Relative Risk (RR) in his thesis) to measure the importance of rules.
Huang et al. [14] proposed a statistical method based on the chi-square test and conditional probability. The goal of their work is to find the drug-drug interaction for the ADRs. First the author uses
the chi-square test to calculate the dependency of entire drugs and symptom pairs. The chi-square test, however, can only show the relative strength of association, but cannot distinguish whether the ADR is caused by drug-drug interaction or a single drug. So, the authors use the conditional probability to resolve this problem.
In addition, a study that focused on the construction of the ADR exploration system was proposed by Fram et al. in 2003 [13]. The authors used the EBGPS to implement a platform that is used to identify factors of ADRs. This platform can let users to find the interested factors of ADRs themselves.
3. Cube-based Method for ADRs Signal
Detection
Since a spontaneous reporting database, such as Adverse Event Reporting System (AERS) database [4] of The US Food and Drug Administration (FDA), usually contains a very large amount of data, how to facilitate interactive detection and analysis of ADRs is a challenging task. Inspired by the success of OLAP operations [8, 16] that can respond to user queries immediately and in light of the technique for data cube processing is commonly supported by contemporary data warehousing systems [16], we adopt the OLAP cube technique into the establishment of our ADRs mining methods.
A crucial issue to be resolved for this purpose is what structure the data cube should be to speed up the calculation of measures. The definitions of the measures of disproportionality provide the answer: all of them are derived from the contingency table. In light of this, we propose the concept of contingency cubes to refer to the set of pre-stored data cubes for ADR detection. Although such a framework must cost external amount of storage space, users can get fast and accurate results. In the following subsections, we will describe the concept of contingency cubes and the proposed cube-based algorithms.
3.1. Contingency Cube
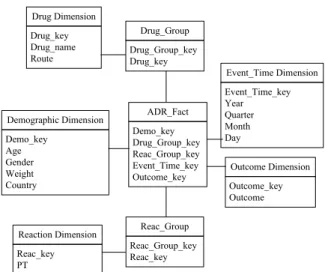
Before we introduce the concept of contingency cube, we have to first tackle an important issue related to the many-to-many relationships existing in the ADR star as shown in Figure 1. The two bridge tables, Drug_Group and Reac_Group, represent the drug records and symptom records of the anamneses, respectively. The Drug_Group_key and Reac_Group_key are the identifiers of drug group and symptoms group, indicating a patient who took many drugs and suffered many symptoms.
A report sent to the spontaneous reporting database contains information about one or more suspected drugs and symptoms. This implies that the relationships between the suspected drugs and
Drug Dimension Drug_key Drug_name Route Demographic Dimension Demo_key Age Gender Weight Country Outcome Dimension Outcome_key Outcome Reaction Dimension Reac_key PT Drug_Group Drug_Group_key Drug_key Event_Time Dimension Event_Time_key Year Quarter Month Day Reac_Group Reac_Group_key Reac_key ADR_Fact Demo_key Drug_Group_key Reac_Group_key Event_Time_key Outcome_key
Figure 1. The star schema of ADR warehouse.
symptoms are undistinguished, e.g., a symptom may be caused by a certain drug or drug-drug interaction.To fit into the data cube structure we have to disintegrate the report to single drug and single symptom pairs. For example, a report records two suspected drugs and three suspected symptoms will be partitioned into six records. Besides, the associations between other risk factors and symptoms must also be considered. Therefore, we generate a base cube BC that stores all demographic attributes, timeline, and symptom from the ADR warehouse by performing the following SQL statement:
SELECT demo.key, Year, Age, Gender, Weight,
Country, Drug, PT
FROM ADRDW
GROUP BY demo.key, Year, Age, Gender,
Weight, Country, Drug, PT where ADRDW refers to the ADR data warehouse, PT (Preferred Term) is the attribute records the symptoms. Note that in this base cube there is no measure attribute. This is because each record is singular and so its count isalways one, which can be omitted.
For ADR signaling rules, the measure values of proportionality must be calculated based on 2×2 contingency table. Intuitionally, the values of each cell can be obtained by aggregating the count in the base cube. However, since the relationship between Drug and PT attributes is many-to-many, if the count is aggregated directly from base cube, it will be calculated repeatedly and does not coincide with the facts. Thus, first of all, we must distinguish the uniqueness of drugs and symptoms, and then calculate the count. The detailed formulas are shown in Table 3, where count(risk pattern, symptom) refers to the number of occurrences of the itemset forming a rule: risk pattern → symptom. For example, for a rule: Age = a2, Weight = w2, Drug = d1 → PT = s1, the itemset forming this rule occurs two times in the base cube, i.e., count(Age = a2, Weight = w1, Drug = d1, PT = s1) = 2.
In short, the concept of contingency cube is a data cube with dimensions constructed from the attributes corresponding to a rule risk pattern and symptom, in which each cell stores the occurrences of the itemset forming a possible rule. These aggregated cubes are defined as contingency cubes.
Table 3. The formula of each cell in 2×2 contingency table.
Cell The formula
a count(risk pattern, symptom) b count(risk pattern) – a c count(symptom) – a
d N – a – b – c
*N: the number of reports.
Note that Drug and PT are two mandatory attributes that must be included in the dimensions of the contingency cube used for calculating the value a in a 2×2 contingence table. Since there are four demographic attributes in the ADR star that are optional dimensions for constructing contingency cube, we totally can construct 24 = 16 different contingency cubes. The relationships of these 16 cubes can be expressed as a lattice that is shown in Figure 4.2. In addition, since a rule must occur no less than the threshold, only the cells in a contingency cube with count over the specified threshold have to be stored. In this context, the resulting contingency cube can be regarded as an iceberg cube [7], which contains only those cells that meet an aggregate condition.
The corresponding SQL statement for generating such a contingency cube from the base cube is shown as follows:
SELECT *, Drug, PT, count(*) AS count FROM BC
GROUP BY *, Drug, PT
HAVING count(*) >= frequency threshold
where * can be replaced by any subset of five demographic factors and BC represents the base cube.
As to calculate value b, it can be regarded as subtracting the occurrences of the suspected risk patterns and symptoms together from the occurrences of the suspected risk patterns. When calculating the value b, the Drug attribute is mandotary and so we have in total 25 = 32 different contingency cubes with dimensions corresponding to risk patterns. The occurrences of the suspected risk patterns can be acquired by these contingence cubes. However, if these contingence cubes are generated from the base cube in the same way as that for calculating value a, duplicate occurrences will be accounted since we have disintegrated drugs and symptoms. Therefore, we must distinguish a drug in a report only occurs once. The corresponding SQL statement for generating the contingency cubes to store the occurrences of the suspected risk factors is shown as follows:
SELECT *, Drug, count(*) AS count FROM (
SELECT DISTINCT *, Drug FROM BC) GROUP BY *, Drug
HAVING count(*) >= frequency threshold
The value c can be expressed as subtracting the occurrences of the suspected risk patterns and symptoms together from the occurrences of the suspected symptoms. Only one contingency cube has to be constructed to store the occurrences of all symptoms. The SQL statement is shown as follows:
SELECT PT, count(*) AS count
FROM (SELECT DISTINCT PT FROM BC) GROUP BY PT
HAVING count(*) >= frequency threshold
The value d is simply calculated by subtracting a, b, and c from the total number of reports. Finally, we can use these cell values to calculate the measure value for signal detection. All possible contingency cubes, in total 65, are generated in advance and stored in the off-line process. In the on-line ADRs detection process, the expensive computation of generating suitable contingency cubes can thus be omitted.
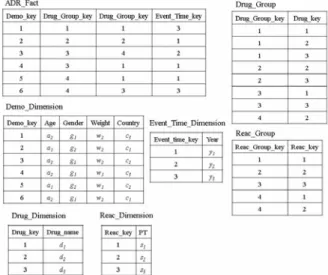
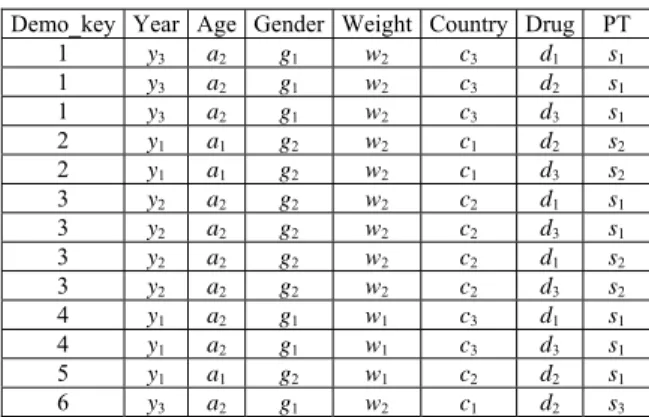
Example 1. Consider an ADR warehouse with six
reports, as shown in Figure 2. The resulting base cube BC generated from the six reports is shown in Table 4, where Year, Age, Gender, Weight, and Country are mining attributes while Drug and PT represent drug and symptom.
Figure 1. A simple ADR star composed of six reports.
3.2. Cube-based Method for ADR Detection
The proposed algorithm, namely CBM_ADR (Cube-Based Method for ADR detection), employs contingency cubes to generate signals of ADRs caused by drug with/without other demographic attributes, which consists of four phases: (1) Contingency cubes selection phase; (2) Rules generation phase; (3) Measure calculation phase; and
(4) Signals ranking and top-k outputting phase. In the following, we describe each of the four phases. An example is also given to illustrate the CBM_ADR algorithm.
Table 4. A base cube BC derived from Figure 1.
Demo_key Year Age Gender Weight Country Drug PT 1 y3 a2 g1 w2 c3 d1 s1 1 y3 a2 g1 w2 c3 d2 s1 1 y3 a2 g1 w2 c3 d3 s1 2 y1 a1 g2 w2 c1 d2 s2 2 y1 a1 g2 w2 c1 d3 s2 3 y2 a2 g2 w2 c2 d1 s1 3 y2 a2 g2 w2 c2 d3 s1 3 y2 a2 g2 w2 c2 d1 s2 3 y2 a2 g2 w2 c2 d3 s2 4 y1 a2 g1 w1 c3 d1 s1 4 y1 a2 g1 w1 c3 d3 s1 5 y1 a1 g2 w1 c2 d2 s1 6 y3 a2 g1 w2 c1 d2 s3 (1) Contingency cubes selection phase
According to the demographic attributes that users selected, the proposed approach selects the suitable contingency cubes from the stored repository of contingency cubes and loads them into memory. (2) Rules generation phase
The main task of this phase is to generate all rules from contingency cubes. The proposed approach first lists every pair of risk patterns and symptoms exhaustively. That is, each row of the contingency cube with dimensions composed of Drug, PT, and the user specified demographic attributes will generate a corresponding rule for this purpose.
(3) Measure calculation phase
In this phase, the proposed approach will inspect signals whose measure passes the measurement threshold. For each generated rule, four values in the 2×2 contingency table, including a, b, c, and d, must first be calculated. Then, according to the selected measurement, calculate the measure value of each rule and check whether it passes the threshold or not. (4) Signals ranking and top-k outputting phase The proposed approach sorts all signals by their measure values and outputs top-k signals for users in this phase. The parameter k is specified by users.
Example 2. Continuing with Example 1, assume that
a query Q includes the selected attribute Age and the selected measure PRR is specified. In other words, the antecedent of generated rules must have age and drug information and the consequent is symptom. Let the frequency threshold be 3. The execution of the proposed CBM_ADR algorithm is illustrated step by step. In contingency cubes selection phase, it selects the suitable contingency cubes for query Q, i.e., Ca = 〈Age, Drug, PT〉, Cb = 〈Age, Drug〉, and Cc = 〈PT〉 are selected. These contingency cubes in table format are shown in Tables 5, 6 and 7.
Table 5. The contingency cube Ca. Age Drug PT count
a2 d1 s1 3
a2 d3 s1 3
Table 6. The contingency cube Cb. Age Drug count
a2 d1 3
a2 d3 3
Table 7. The contingency cube Cc. PT count
s1 4
In rules generation phase, each row of the contingency cubes Ca will be issued as a rule. For example, the rule generated corresponding to the first row of Ca is:
Age = a2, Drug = d1 → Symptom = s1 Next in signals generation phase the measure of each generated rule in the previous phase is calculated and inspected whether it passes the threshold or not. The results are shown in Table 8.
Table 8. The results after signals generation phase.
Rule a b c d PRR PRR -1.96SE > 1 Age = a2, Drug = d1 → Symptom = s1 3 0 1 2 3 Yes Age = a2, Drug = d3 → Symptom = s1 3 0 1 2 3 Yes
Finally, it sorts all signals by their measure values and outputs top-k signals for users in the last phase. The results are shown in Table 9.
Table 9. The result of signals.
Signal PRR Age = a2, Drug = d1 → Symptom = s1 3 Age = a2, Drug = d3 → Symptom = s1 3
4. Experiments
4.1 Performance Study
The proposed CBM_ADR algorithm is compared with our previously proposed method, called ACM_ADR (Associative-Classification-based
Method for ADR detection) [2], which is a
modification of the CMAR algorithm [17]. All implementations and experiments were performed on a personal computer with Intel Core2 Duo 2.33Ghz CPU, 3GB main memory, and 320 GB hard disk. The operation system is Windows XP. The database
system we used is Microsoft SQL SERVER 2005. The AERS data reported by FDA in 2004, 2005, 2006 and 2007, totally four years are used in this experiment. There are about 60,000 to 110,000 reports in each quarter of years, and the total number of reports in each year is 272400, 326626, 324077 and 378736.
The efficiencies of CBM_ADR and ACM_ADR were evaluated over five datasets, which are the subsets of the data in 2007, containing different number of transactions, namely T10K, T50K, T100K, T150K and T200K, respectively. Detailed parameter settings of these five datasets are shown in Table 10.
Table 10. Parameter settings for data sets.
Parameters T10K T50K T100K T150K T200K Number of transactions 10K 50K 100K 150K 200K Number of drugs 14437 Number of demographic values 230 Number of symptoms 10436
We considered two query conditions: (1) No demographic attribute is selected, and (2) All demographic attributes are selected. The results of CBM_ADR and ACM_ADR with these two conditions are depicted in Figures 3 and 4, respectively. It can be seen that the cube-based approach CBM_ADR exhibits linear scalability and outperforms ACM_ADR significantly, approximately 4 to 10 times faster. Note that CBM_ADR performs better in the case with all demographic attributes than that with no demographic attribute, while ACM_ADR behaves opposite. This is because the more demographic conditions the smaller the corresponding contingency cube. On the contrary, algorithm ACM_ADR will consume more computation to generate satisfied itemsets when more demographic conditions are specified.
0 5 10 15 20 25 10K 50K 100K 150K 200K Data size E xe cut ion t im e (S ec .) CBM_ADR ACM_ADR
Figure 3. Performance evaluation of CBM_ADR and ACM_ADR on queries with no demographic
attributes.
4.2 ADR Signals Detection
The proposed CBM_ADR algorithm has been
0 5 10 15 20 25 30 10K 50K 100K 150K 200K Data size E xecut io n t im e (S ec .) CBM_ADR ACM_ADR
Figure 4. Performance evaluation of CBM_ADR and ACM_ADR on queries with all demographic
attributes.
added into our ADR detection platform. Figure 5 illustrates a snapshot of the user interface of our system platform. Through this system interface, we also conducted several experiments to inspect the effectiveness of CBM_ADR on detecting suspected ADRs. Two examples are given to demonstrate the evaluation results.
Figure 5. A snapshot of the user interface for detecting ADRs.
Example 3. The query is specified as Drug
= ”CAPTOPRIL”, Demographic attributes: Null, and Measure: ROR.
There are 263 signals contain distinct symptoms related to CAPTOPRIL. We ranked these signals according to the ROR value and list TOP-10 signals associated with CAPTOPRIL in Table 11. Each of them is represented by listing three attributes, “Symptom”, “ROR value” and “Count”. For example, among the ten signals, the frequency of BASAL GANGLION DEGENERATION is 6 and its ROR value is 1336.8434 in the whole dataset. The
frequency of OESOPHAGEAL INFECTION is 3 and its ROR value is 398.9214, and so on.
Table 11. TOP-10 suspected symptoms associated with drug “CAPTOPRIL”.
No. Symptom ROR value Count
1 BASAL GANGLION DEGENERATION 1336.8434 6 2 OESOPHAGEAL INFECTION 398.9214 3 3 LARGE INTESTINAL OBSTRUCTION 222.4044 5 4 INJECTION SITE PHLEBITIS 181.325 3 5 NODAL ARRHYTHMIA 97.8079 6 6 VIRAL UPPER RESPIRATORY TRACT INFECTION 79.78 3 7 HYPERTROPHIC CARDIOMYOPATHY 78.3525 4 8 JAW FRACTURE 62.3452 12 9 PALMAR ERYTHEMA 62.327 3 10 PANCREATIC NEOPLASM 62.327 3
A document reported in [9] described that “CAPTOPRIL is an ACE inhibitor. This medicine is used to treat high blood pressure and heart failure. It is used to treat heart damage after a heart attack. It can also slow the progression of kidney disease in diabetic patients.”
From this report, we can know that CAPTOPRIL is often used in the treatment of high blood pressure and heart diseases. Besides, another documents reported that symptoms BASAL GANGLION DEGENERATION and LARGE INTESTINAL OBSTRUCTION can be treated by CAPTOPRIL integrates with other drugs [22]. Thus, we can find
that BASAL GANGLION DEGENERATION (No. 1), LARGE INTESTINAL OBSTRUCTION (No. 3) and HYPERTROPHIC CARDIOMYOPATHY (No. 7) indeed are noises. In addition, we can not find any relevant documents that reported INJECTION SITE PHLEBITIS (No. 4) and JAW FRACTURE (No. 8) are related to CAPTOPRIL. These two signals need further professional analysis and literature validation. Other remaining signals are the adverse drug reactions of CAPTOPRIL.
Example 4. The query is specified as Drug
= ”RANITIDINE”, Demographic attributes: Year, Age, Gender, Weight, Country, and Measure: IC.
There are 78 signals contain distinct symptoms with other mining attributes related to RANITIDINE. We ranked these signals according to the IC value and list TOP-10 signals associated with RANITIDINE in Table 12. Each of them is represented by listing eight attributes, including “Year”, “Age”, “Gender”, “Weight”, “Country”, “Symptom”, “IC value” and “Count”.
A document reported that “RANITIDINE is a type of antihistamine that blocks the release of stomach acid. It is used to treat stomach or intestinal ulcers. It can relieve ulcer pain and discomfort, and the heartburn from acid reflux.” [9]
From the above report, we know that RANITIDINE is often used in the treatment of stomach or intestinal ulcers. In these ten distinct symptoms of signals, we observe that the noise is NEUTROPENIC COLITIS (No. 2) which is related to intestinal ulcers. Other nine symptoms are recorded as the adverse drug reactions of RANITIDINE. In addition, MENINGITIS BACTERIAL is an ADR that is easily caused by RANITIDINE in young children [22].
Table 12. TOP-10 suspected symptoms with demographic attributes associated with “RANITIDINE”.
No. Year Age Gender Weight Country Symptom value IC Count
1 2007 14~20 M 54.0~ UNITED STATES FLUID IMBALANCE 13.2358 3 2 2007 4~7 F 10.0~15.0 UNITED
STATES NEUTROPENIC COLITIS 12.0983 5 3 2007 7~14 M 30.0~40.0 KINGDOM UNITED MALIGNANT HYPERTENSION 11.3988 3
4 2007 ~1 F ~2.5 GERMANY CATHETER SEPSIS 11.1289 3
5 2007 14~20 M 54.0~ UNITED STATES MENINGITIS BACTERIAL 11.0783 3 6 2007 20~60 M 54.0~ KINGDOM UNITED PO2 DECREASED 10.5905 6 7 2007 7~14 M 30.0~40.0 SPAIN CAPILLARY EAK SYNDROME 10.497 3
8 2006 60~ F 54.0~ FRANCE LARYNGEAL OEDEMA 9.8955 3
9 2007 7~14 M 30.0~40.0 KINGDOM UNITED REVERSIBLE POSTERIOR LEUKOENCEPHALOPATHY SYNDROME 9.1076 3 10 2006 20~60 F 54.0~ UNITED
5. Conclusions
In this paper, we have proposed a cube-based method for analyzing and detecting adverse drug reactions that reveal harmful reactions resulting from the use of given drugs for some types of patients. Experimental results on a real spontaneous reporting database have shown the efficiency and effectiveness of our proposed algorithm; users can interact, through this cube-based method, with our proposed platform to obtain satisfying results by selecting and re-adjusting interesting parameters.
The ultimate goal of our work is to develop a system for monitoring and analysis of adverse drug reactions. However, the exploited signals through our system still need further clinical verification. In the future, we will cooperate with pharmaceutical experts to validate its practical usefulness.
References
[1] 行 政 院 衛 生 署 藥 物 不 良 反 應 通 報 系 統 , http://adr.doh.gov.tw/ [2] 林文揚.李和益,藥物不良反應成因的分析 與偵測之知識發掘平台,第十三屆人工智慧 與應用研討會論文集,2008。 [3] 魏志軍等,上海市藥品不良反應自發呈報數 據庫定量信號檢測系統的建立,復旦學報, 第33 卷,第 4 期,頁 475-479,2006。 [4] Adverse Event Reporting System (AERS),http://www.fda.gov/cder/aers/default.htm [5] WHO Technical Report No 498, World Health
Organization, 1972.
[6] A. Beta, M. Lindquist, I.R. Edwards, S. Olsson, R. Orre, A. Lansner, and R.M. De Freitas, “A bayesian neural network method for adverse drug reaction signal generation,” European Journal of Clinical Pharmacology, Vol. 54, No.
4, pp. 315- 321, 1998.
[7] K. Beyer and R. Ramakrishnan, “Bottom-up computation of sparse and iceberg cubes,” in Proceedings of the ACM SIGMOD Conference, pp. 359-370,1999.
[8] S. Chaudhuri and U. Dayal, “An overview of data warehouse and OLAP technology,” ACM SIGMOD Record, vol. 26, pp. 65-74, 1997. [9] Drug digest,
http://www.drugdigest.org/wps/portal/ddigest. [10] W. DuMouchel, “Bayesian data mining in large
frequency tables, with an application to the FDA spontaneous reporting system,” The American Statistician, vol. 53, no. 3, pp. 177-190, 1999.
[11] A.C. Egberts, R.H. Meyboom, and E.P. van Puijenbroek, “Use of measures of disproportionality in pharmacovigilance: three
Dutch examples,” Drug Safety, vol. 25, no. 6, pp. 453-458, 2002.
[12] S.J. Evans, P.C. Waller, S. Davis, “Use of proportional reporting ratios (PRRs) for signal generation from spontaneous adverse drug reaction reports,” Pharmacoepidemiol Drug Safety, vol. 10, no. 6, pp. 483-486, 2001.
[13] D.M. Fram, J.S. Almenoff, and W. DuMouchel, “Empirical bayesian data mining for discovering patterns in post-marketing drug safety,” in Proceedings of SIGKDD’03, pp. 359-368, 2003.
[14] Y.T. Huang, S.F. Lin, C.C. Chiu, H.Y. Yeh, and V.W. Soo, “Probability analysis on associations of adverse drug events with drug-drug interactions,” in Proceedings of the 7th IEEE International Conference on Bioinformatics and Bioengineering, pp. 1308-1312, 2007.
[15] H. Jin, J. Chen, H. He, G.J. Williams, and C. Kelman, and C.M. O’Keefe, “Mining unexpected temporal associations: Applications in detecting adverse drug reactions,” IEEE Transactions on Information Technology in Biomedicine, 2007.
[16] R. Kimball, L. Reeves, M. Ross and W. Thornthwaite, The Data Warehouse Lifecycle Toolkit, John Wiley & Sons, New York, 1998. [17] W.M. Li, J.W. Han, and J. Pei, “CMAR:
Accurate and efficient classification based on multiple class-association rules,” in Proceedings of IEEE International Conference on Data Mining, pp. 369-376, 2001.
[18] The Importance of Pharmacovigilance⎯Safety Monitoring of medicinal products, World Health Organization, 2002.
[19] R. Orre, A. Lansner, A. Bate, and M. Lindquist, “Bayesian neural networks with confidence estimations applied to data mining,” Computational Statistics & Data Analysis, vol. 34, no. 4, pp.473-493, 2000.
[20] T.B. Pedersen and C.S. Jensen, “Research issues in clinical data warehousing,” in Proceedings of the Tenth International Conference on Scientific and Statistical Database Management, pp.43-52, July, 1998. [21] G. Piatetsky-Shapiro, “Discovery, analysis, and
presentation of strong rules,” in Knowledge Discovery in Databases, edited by G. Piatetsky-Shapiro and W. Frawley, pp. 229-248, AAAI/M1T Press, 1991.
[22] PubMed,
http://www.ncbi.nlm.nih.gov/pubmed.
[23] A. Szarfman, S.G. Machado, and R.T. O’Neill, “Use of screening algorithms and computer systems to efficiently signal higher-than- expected combinations of drugs and events in the US FDA’s spontaneous reports database,” Drug Safety, vol. 25, no. 6, pp. 381-392, 2002.